Week 4.1 - Genetic Algorithm
AIM: To optimise the stalagmite function and to find the global maxima of the function using MATLAB program.
TASK:
- To show three studies of graph, on giving unbounded inputs, bounded inputs and bounded inputs with increased ga iterations and check the change of values of F max and iterations.
- To explain about ga and syntax for ga.
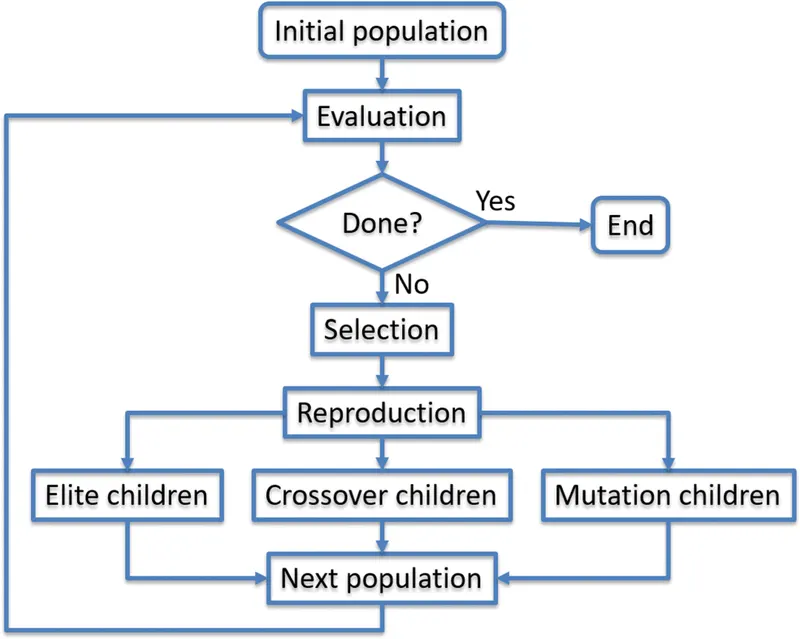
Genetic algorithm (ga) is a tool for finding solutions for complex search problems. Genetic algorithms are commonly used to generate high-quality solutions to optimization and search problems on biological streamed operators such as mutation, crossover and selection. It is an iterative procedure which maintain a fixed-size population. Each iterative step is called a generation. It is based on the biological evalution theory of natural selection and genetics.
- Initialization - It creates an initial population. This population is usually randomly generated and can be any desired size, from few individuals to thousands.
- Evaluation - Each member of the population is then evaluated and we calculate a 'fitness' for that function. The fitness value is calculated by how well it fits with our desired requirements. These requirements could be simple, faster algorithms are better, or more complex.
- Selection - We want to be constantly improving our populations overall fitness. Selection helps us to discard the bad designs and only keeping the best individuals in the population. There are a few different selection methods but the basic idea is the same, fitter individuals will be selected for the next generation.
- Crossover - During crossover we create new individuals by combining parents of our selected individuals. By combining certain traits from two or more individuals we will create an even 'fitter' offspring which will inherit the best traits from each of it's parents.
- Mutation - Mutation typically works by making very small changes at random to an individuals genome. A common method of implementing the mutation operator involves generating a random variable for each bit in a sequence. This random variable tells whether or not a particular bit will be flipped. This mutation procedure, based on the biological point mutation, is called single point mutation.
syntax for Ga
[x, fval, exitflag, output, population, scores]=ga(function, nvarbl, A, B, Aeq, Beq, lb, ub, nonlinconst, intconst, options)
L.H.S,
X = input optimum values.
fval = optimum function values.
exitflag = to stop or hault iterations.
output = optimization process output.
population = gives final population.
scores = gives final scores.
R.H.S,
func = fitness function.
nvarbl = no. of variables.
A, B = linear inequality constraints.
Aeq, Beq = linear equality constraints.
lb = lower bounds
up = upper bounds
nonlinconst = non linear constraints.
intconst = solution in integer
options = used to set population size.
Flow chart:
Fitness function: using negavtive sign here to reverse the graph hence to find the maxima of the given function (f).
function[f]= get_stalagmite(input_vector)

x=input_vector(1);
y=input_vector(2);

f1=(sin(5.1*pi*x+0.5))^6;
f2=(sin(5.1*pi*y+0.5))^6;
f3=exp(-4*log(2)*((x-0.667)^2)/0.64);
f4=exp(-4*log(2)*((y-0.667)^2)/0.64);

f=-(f1*f2*f3*f4);

end
Main body of the program with comments for three variations:
clear all
close all
clc

%generating values for seperate axes
x=linspace(0,0.6,150);
y=linspace(0,0.6,150);
%no. of iterations to be done
num_cases=50;

%for creating 2D mesh in x and y axis
[xx,yy]=meshgrid(x,y);

tic     % generating tic and toc command
for i=1:length(xx)
    for j=1:length(yy)
        input_vector(1)=xx(i,j);
        input_vector(2)=yy(i,j);
        f(i,j)=get_stalagmite(input_vector);   %function values for given vector
    end
end
study_time=toc;     %generated time for this study

surfc(xx, yy, -f)    %to generate a surface in 3 axis
shading interp       %to undo the lines created by mesh grid
xlabel('xvalue')     %to label x axis
ylabel('yvalue')     %to label y axis
title('stalagmite function')     %for giving title

tic
%study 1- statistical behaviour
for i=1:num_cases
    [inputs,fopt(i)]=ga(@get_stalagmite,2);
    xopt(i)=inputs(1);       % optimizing value of func at each iteration
    yopt(i)=inputs(2);
end
study1_time=toc;       %generated time for study 1

figure(1)         %to generate the graph figure
subplot(2,1,1)     %to give boundaries for 3 axis
hold on
surfc(x, y, -f)
shading interp
plot3(xopt,yopt,-fopt,'marker','o','markersize',5,'markerfacecolor','r') %to plot 3 axis with a marker
title('unbounded inputs')
xlabel('x')
ylabel('y')
zlabel('-f')

subplot(2,1,2)   %another subplot to make plot clear for fopt
plot(-fopt)     %using negative sign to get the maxima for fopt
xlabel('Iterations')
ylabel('Function minimum')

tic
%study 2- statistical behaviour with upper and lower bounds
for i=1:num_cases
    [inputs,fopt(i)]=ga(@get_stalagmite,2,[],[],[],[],[0;0],[1;1]);
    xopt(i)=inputs(1);
    yopt(i)=inputs(2);
end
study2_time=toc;

figure(2)
subplot(2,1,1)
hold on
surfc(x, y, -f)
shading interp
plot3(xopt,yopt,-fopt,'marker','o','markersize',5,'markerfacecolor','r')
title('bounded inputs')
xlabel('x')
ylabel('y')
zlabel('-f')

subplot(2,1,2)
plot(-fopt)
xlabel('Iterations')
ylabel('Function minimum')


tic
%study 3- statistical behaviour with increasing ga iterations

options=optimoptions('ga');
options=optimoptions(options,'populationsize',200); %increasing the population size

for i=1:num_cases
    [inputs,fopt(i)]=ga(@get_stalagmite,2,[],[],[],[],[0;0],[1;1],[],[],options);
    xopt(i)=inputs(1);
    yopt(i)=inputs(2);
end
study3_time=toc;

figure(3)
subplot(2,1,1)
hold on
surfc(x, y, -f)
shading interp
plot3(xopt,yopt,-fopt,'marker','o','markersize',5,'markerfacecolor','r')
title('bounded inputs with increased ga conditions')
xlabel('x')
ylabel('y')
zlabel('-f')

subplot(2,1,2)
plot(-fopt)
xlabel('Iterations')
ylabel('Function minimum')
Explanation:
- starting the program with clear all, close all, clc command to stop or clear any previous preceeding programs.
- input values for x and y axis with linspace command for generating specific no. of outputs inbetween the given values.
- no. of times the iteration should be done for optimizing the function is given in num cases command.
- then to create a 2d mesh in the two vectors to find the maxima of the function, for that mesh command is given.
- then for loop is used for stalagmite function command to generate inputs in x and y axis.
- using tic and toc command here to find the time taken to run the program.
- using surface command to generate a surface for x, y, and f axis.
- shading interp command is used to undo the lines created by mesh grid.
- using label command to give labels to x and y axis.
- title command to give title for the stalagmite function.
- the output graph we get will be like
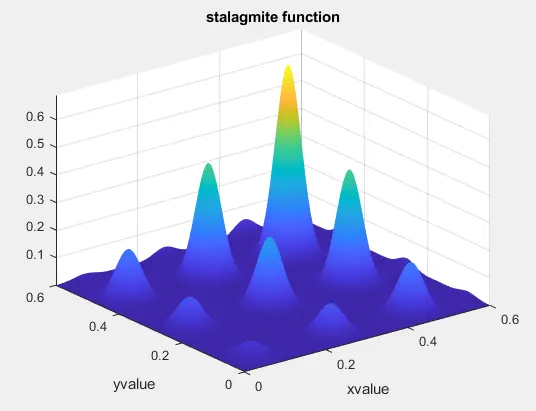
Study1 of statistical behaviour - unbounded inputs
- In this we're going to optimize the value of fitness function with no. of variables at each iteration for gertting the values of x and y.
- using tic and toc command to find the time taken to generate the program for study1.
- figure command is used to show the graph1 picture.
- subplot is used for giving boundary plotting for each axis.
- hold on command is used to jump on to next without disturbing the previous one.
- surfc command is used to generate the surface plots for x, y, and f axis.
- negative function represents the graph in upside down to fing the maxima value.
- using plot3 command to plot x, y, and f optimum with a marker command to plot the marker for the respective points also by giving marker size and color.
- title command to give title for the program.
- then another plot command is used to subplot only the fopt value to make the plot clear.
- for representing the graph with iterations to the function minimum value.
- the resultant graph for unbounded inputs will be like
- from the graph we can see that the results of this graph gives high variation in plotting and also the f value differs more. since, it is unbounded the values generated will be not in any limit.
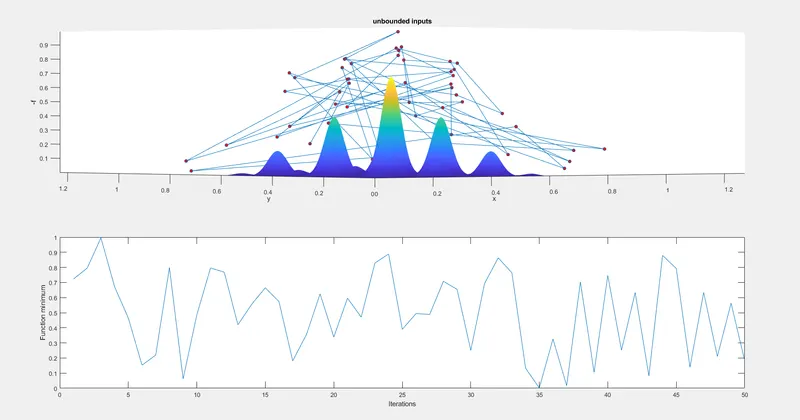
Study2 of statistical behaviour - bounded inputs
- It is same as the previous one, where we give bounded values to the function here.
- giving lower bound and upper bounds here to set the x and y values limited and running the function.
- we can see that the values generated is between 0 to 1 in both the axis.
- here the search space for this study is set.
- now, we can see it is less varied and some what accurate when compared to the study1.
- we can see that the generated points is similar when compared to both the axis.
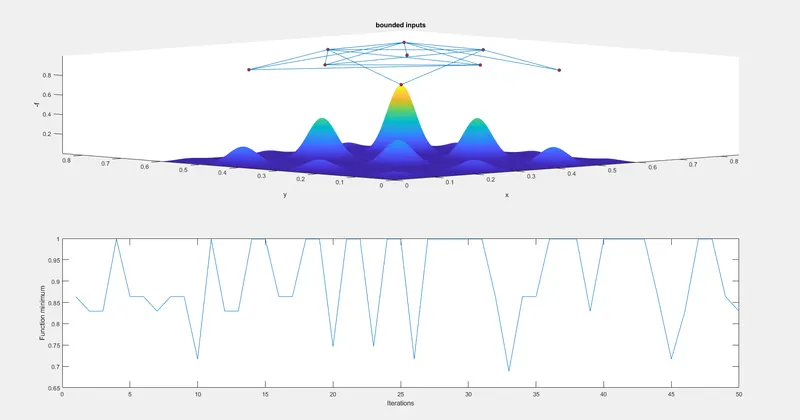
Study3 of statistical behaviour - bounded inputs with increased ga conditions.
- here we will be using the same programs as for bounded inputs, but we are going to increase the size of population by using optimoptions command.
- this command helps to input more no. of population size in the given boundaries.
- thus to find the best fitness function by generating more set of numbers.
- increase in graph accurate by giving more no. of population size thus to find the best value in each and every corner.
- increasing ga conditions will lead to take more time than the two studies to optimize the function.
- from this resultant graph we can see that the variation has reduced a lot when increasing the ga conditions.
- the increased ga conditions in the loop is generated thus it runs for various times to check and find the correct value for maxima
- the resultant graph can be seen here with no variations and fixed maxima points.
- the ga value can never be accurate for any function value as the max value lies at -1.
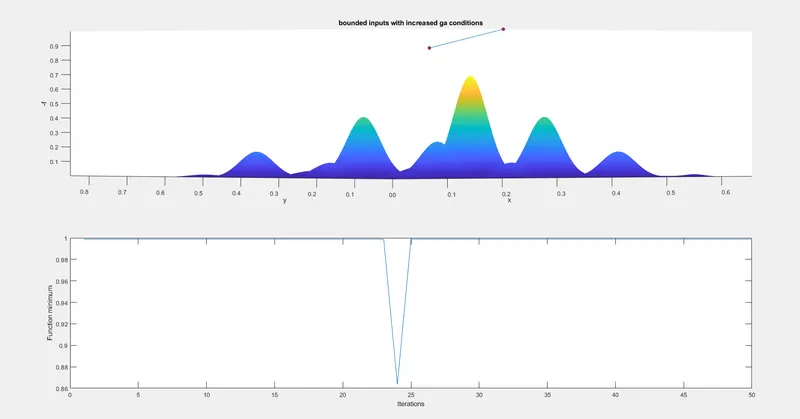
Thus, on increasing the population size with bounded values we get accurate values with reduced variations. This tells us genetic algorithm works brilliantly on any max. no. of size and gives precissed and accurate output to define the maximum strength or point for any given element.
Errors:
the errors which i got while programming is basic like i gave the function name mismatched, saving it in different names like unrecognized variable errors.