Project 1 - Parsing NASA thermodynamic data
AIM: By reading NASA thermodynamic data, to extract 14 temperature co-efficients and to calculate specific heat, enthalpy and entropy for all the species in the data file and to show the plotting especially for O2,N2,CO2 and to calculate the molecular weight.
Parsing a file means reading in a data stream of some sort and building an in memory model of the semantic content of that data. This aims at perfoming some kind of transformation on the data. Parse means to ''resolve a sentence into its component parts and describe their syntactic roles''. In computing, parsing is an act of parsing a string or a text.
specific heat is defined by the amount of heat needed to raise the temperature of 1 gram of a substance 1 degree Celsius (°C).
Enthalpy is a property of a thermodynamic system, defined as the sum of the system's internal energy and the product of its pressure and volume.
Entropy, the measure of a system's thermal energy per unit temperature that is unavailable for doing useful work. Because work is obtained from ordered molecular motion, the amount of entropy is also a measure of the molecular disorder, or randomness, of a system.
The equations used to calculate cp, H, S:

where,
Cp = specific heat
H = enthalpy
S = entropy
R = universal gas constant
a1-a7 = high temperature co-efficients
b1-b7 = low temperature co-efficients
T = local mid temperature
mw = molecular weight
Calculating function:
function [cp,H,S]=calculating_func(a1,a2,a3,a4,a5,a6,a7,b1,b2,b3,b4,b5,b6,b7,t,R,local_mid_temp)

  for i=1:length(t)
   if t(i)>local_mid_temp
     cp(i)=R*(a1+(a2*t(i))+(a3*t(i)^2)+(a4*t(i)^3)+(a5*t(i)^4));
     H(i)=R*t(i)*(a1+(a2*t(i)/2)+(a3*t(i)^2/3)+(a4*t(i)^3/4)+(a5*t(i)^4/5)+(a6/t(i)));
     S(i)=R*((a1*log(t(i)))+(a2*t(i))+(a3*(t(i)^2/2))+(a4*(t(i)^3/3))+(a5*(t(i)^4/4))+a7);

   else
     cp(i)=R*(b1+(b2*t(i))+(b3*t(i)^2)+(b4*t(i)^3)+(b5*t(i)^4));
     H(i)=R*t(i)*(b1+(b2*t(i)/2)+(b3*t(i)^2/3)+(b4*t(i)^3/4)+(b5*t(i)^4/5)+(b6/t(i)));
     S(i)=R*((b1*log(t(i)))+(b2*t(i))+(b3*(t(i)^2/2))+(b4*(t(i)^3/3))+(b5*(t(i)^4/4))+b7);
   end
  end
end- calling the function to calculate cp, H, S for the given elements.
- using for loop to calculate the values for all the elements.
- if else command is used here to specify the given command is true or false.
calculating molecular weight:
function [mw]= calculating_mw(species_name)
atoms = ['H','O','C','N','S','A'];
atomic_weight = [1.007,15.999,12.011,14.006,32.059,39.792];

mw=0;

for i = 1:length(species_name)
  for j = 1:length(atoms)
     if strcmpi(species_name(i),atoms(j))
        mw = mw+atomic_weight(j);
        pos=j;
     end
    n=str2double(species_name(i));
  end
    if n>1
      mw = mw+atomic_weight(pos)*(n-1)
    end
end
end- to call a function to calculate the molecular weright.
- giving the atoms and their atomic weight, to be calculated.
- using strcmp to compare the strings of species with atoms.
- str2double command to take strings out for species name.
- giving mol.w formula to calculate weight for each elements.
Main program:
clear all
close all
clc

%fopen command to obtain data from required file
f1=fopen('THERMO.dat','r');

%fgetl to read line by line from data
fgetl(f1);
%taking first line
l1=fgetl(f1);
%strsplit to produce specified delimeter for strings or characters
A=strsplit(l1,' ');

%taking global temp values
global_low_temp=str2double(A{2})
global_mid_temp=str2double(A{3})
global_high_temp=str2double(A{4})

%skipping next three lines
for i=1:3
fgetl(f1);

end

%loop is created to calculate the 14 co-efficients and local mid temp for
%53 elements
for i=1:53

%reading next line
l2=fgetl(f1);
l2=strsplit(l2,' ')
%denoting species name from line2 first element
species_name=l2{1}
%taking the local temp from the same line
local_low_temp =str2double(l2{end-3})
local_mid_temp =str2double(l2{end-1})
local_high_temp =str2double(l2{end-2})
t=linspace(local_low_temp,local_high_temp,200);
%reading next line to take the coefficients
l3=fgetl(f1);
%to find string E in line3
a=findstr(l3,'E')
l3(12)
l3(1:12)
l3(1:12+3)
a1=l3(1:a(1)+3)
a1=str2double(a1)
a2=l3(a(1)+4:a(2)+3)
a2=str2double(a2)
a3=l3(a(2)+4:a(3)+3)
a3=str2double(a3)
a4=l3(a(3)+4:a(4)+3)
a4=str2double(a4)
a5=l3(a(4)+4:a(5)+3)
a5=str2double(a5)
%to read next line to take the coefficients
l4=fgetl(f1);
b=findstr(l4,'E')
a6=l4(1:b(1)+3)
a6=str2double(a6)
a7=l4(b(1)+4:b(2)+3)
a7=str2double(a7)

b1=l4(b(2)+4:b(3)+3)
b1=str2double(b1)
b2=l4(b(3)+4:b(4)+3)
b2=str2double(b2)
b3=l4(b(4)+4:b(5)+3)
b3=str2double(b3)
%to read next line to take the coefficients
l5=fgetl(f1)
c=findstr(l5,'E')
b4=l5(1:c(1)+3)
b4=str2double(b4)
b5=l5(c(1)+4:c(2)+3)
b5=str2double(b5)
b6=l5(c(2)+4:c(3)+3)
b6=str2double(b6)
b7=l5(c(3)+4:c(4)+3)
b7=str2double(b7)

%universal gas constant
R=8.314

%calculating function for cp, H, S
[cp,H,S]=calculating_func(a1,a2,a3,a4,a5,a6,a7,b1,b2,b3,b4,b5,b6,b7,t,R,local_mid_temp)

%calculating molecular weight
mw=calculating_mw(species_name)

%plotting cp, H, S with respect to temperature
%to make a directory file and by changing current folder
  mkdir(species_name)
  cd(species_name)
%to create figure
  figure(1)
%to plot temperature with specific heat
  plot(t,cp,'linewidth',4,'color','g')
%to give title for the graph
  title('specificheat vs temperature')
%labelling x and y axis
  xlabel('temperature')
  ylabel('specificheat')
%to show grid lines
  grid on;

  figure(2)
  plot(t,H,'linewidth',4,'color','b')
  title('enthalpy vs temperature')
  xlabel('temperature')
  ylabel('enthalpy')
  grid on;

  figure(3)
  plot(t,S,'linewidth',4,'color','r')
  title('entropy vs temperature')
  xlabel('temperature')
  ylabel('entropy')
  grid on;

 %to save the generated graphs in the directory file created for fig 1,2,3
 saveas(1,'cp_vs_t.jpg')
 saveas(2,'H_vs_t.jpg')
 saveas(3,'S_vs_t.jpg')

 cd ..
end
fclose(f1);
Explanation for main program:
- starting the program with clear all close all clc to terminate any ongoing program or code.
- fopen command to open the data file and read the thermo.dat file from the directory.
- using fgetl command to get the data line by line.
- then skipping next three lines given as comments.
- strsplit to provide delimeter for strings or characters.
- taking global temp values and converting it from string to number.
- then creating loop for 53 elements to calculate the co-efficients and temperature for all elements.
- by reading consecutive lines and to take the values for co-efficients.
- species name command is given.
- now to give code to take every values of co-efficients of first 7 high temp and and next 7 low temp and converting it from string to number.
- giving gas constant, and calling function for molecular weight and calculating function.
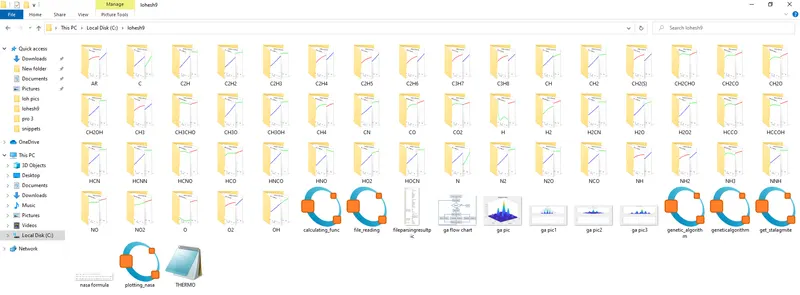
- creating new directory to save the plots using mkdir
- cd to change the folders for every consecutive plots is given.
- figure command to create figure window for plots 1,2,3.
- plot command to plot the two respective elements,
- label command to label the plot.
- title command to give title to the graphs obtained.
- grid on command to show grids.
- using saveas command to save the generated plots for the elements in the respected folder and is save din .jpg format.
- cd.. to end the change folder command.
- end the function loop.
- fclose(f1) to close the fopen command.
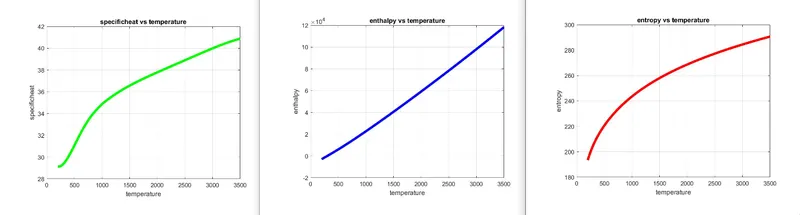
O2 plot:
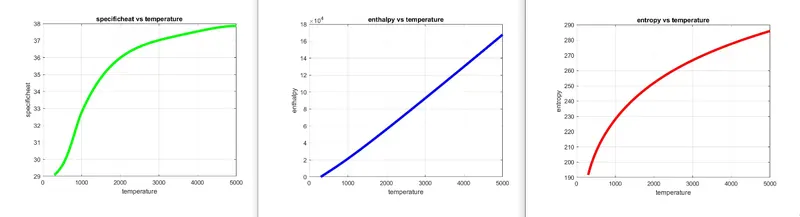
N2 plot:
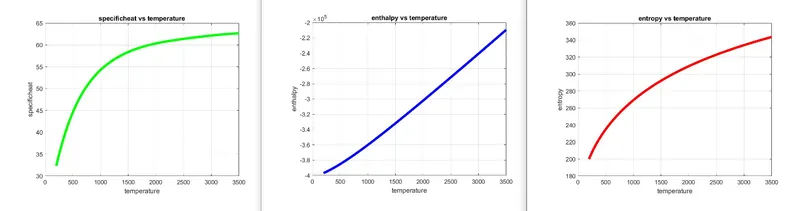
CO2 plot:
Screenshot of the window where all folders are saved:
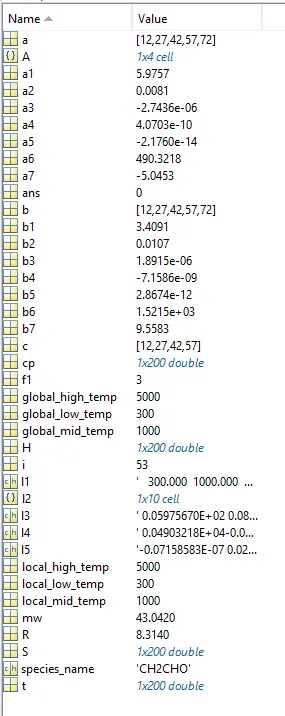
Resultant values from workspace:
Errors:
- Rather than to assign local temp, assigned global temp.
- Brackets assigning mistake in calculating fiunction for cp,H,S.