Assignment 4-RADIOSS Material Laws Challenge
AIM:
To compare the results of LAW2,failure mode,PLAST_TAB and LAW27.
Below are the cases to compare the results for different material card.
Case 1: Run the model as it is and name it as Law2_epsmax_failure.
Case 2: In /FAIL/JOHNSON, change Ifail_sh=1, Dadv=1 and Ixfem=1. Run the model as Law_epsmax_crack.
Case 3: Delete /FAIL/JOHNSON CARD and run the model as Law2_epsmax_nofail.
Case 4: Delete the value of the EPS_p_max and run the model with name Law2.
Case 5: Convert this material model to LAW1 elastic with same density, E, nu and run. Check the results.
Case 6. Convert the card to LAW36 elastic plastic material based on the given details in the below image.
Case 7. Open LAW27_0000.rad.
- Change the shell properties to the recommended Shell Properties.
- Notice the material card. Johnson Cook parameters but different values for EPS based failure.
- Run the model with name Law27.
PROCEDURE:
Case 1: Run the model as it is and name it as Law2_epsmax_failure.
- To run the model as it is, it is first moved to a different new folder and renamed as Law2_epsmax_failure_0000.rad and Law2_epsmax_failure_0001.rad.
- After renaming the file, it can be imported to the hypermesh radioss and the file can be ran.
- To import the file, import>solver deck>select the file>import.
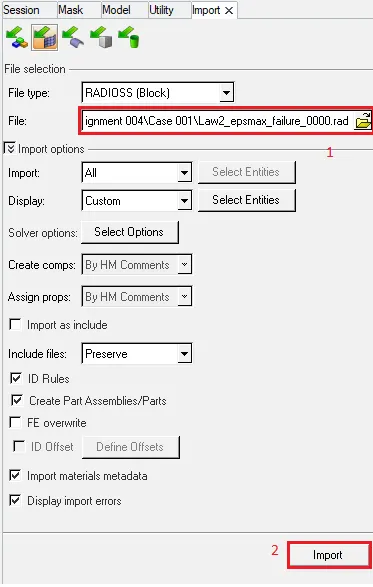
- To run the file, Analysis>Radioss>Select the file location>Radioss.
- Results are viewed in the hyperview.
- The GIF below shows the simulation of the run file.
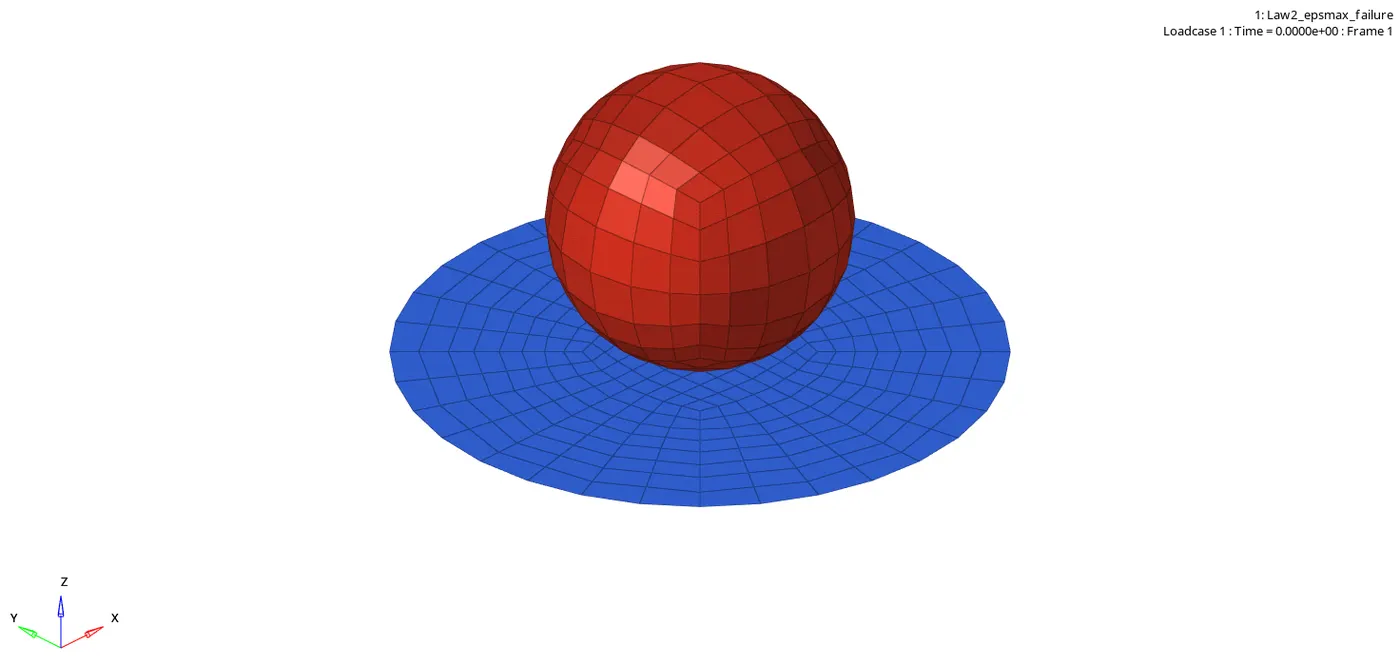
- To check for Von Mises stress induced in the plate during the process, Countour > Change the result type as Von Mises > Select the component > Set the averaging method as simple > Apply.
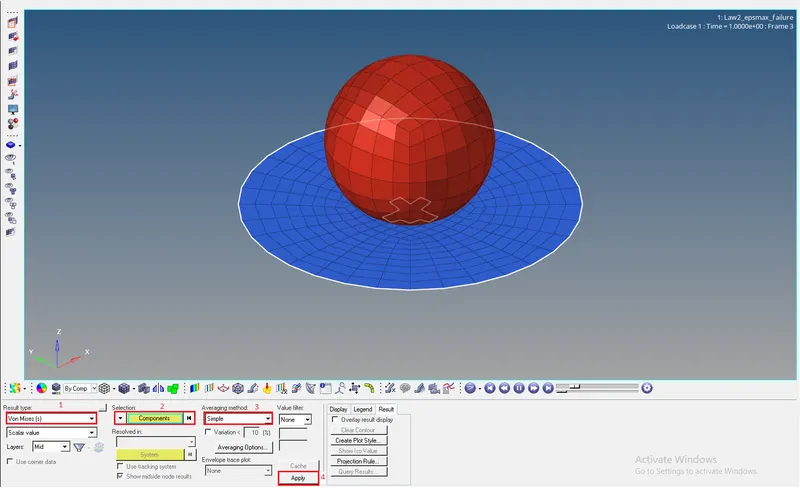
- This will show the Von Mises stress induced in the plate during the punch process.
- The animation below shows the Von Mises stress which reaches maximum of 2.752E+02 ie, 275.2 MPa and minimum of 0 MPa.
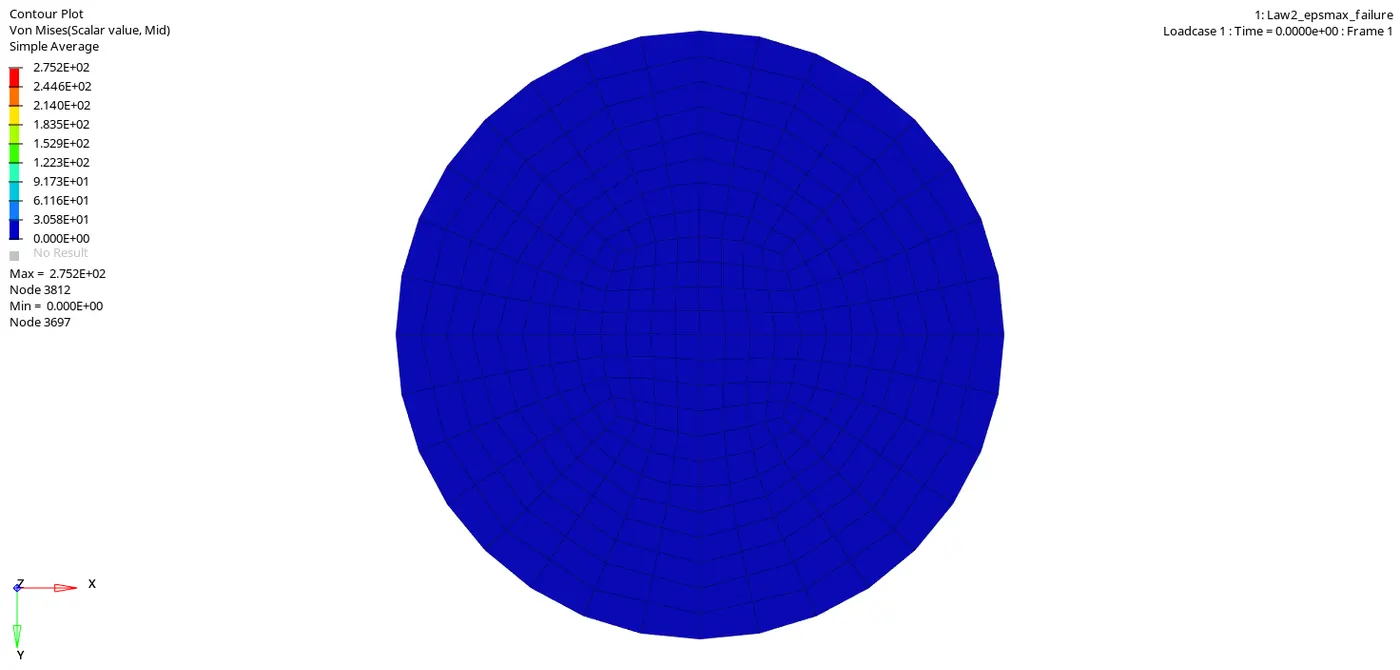
- In the animation, some elements are deleted as the strain reaches the maximum value of 0.151.
- Deletion of element is due to the failure mode. Here Ixfem=0 implies that the elements are deleted as soon as it fails.
PLOTTING THE GRAPH:
- The time vs energies graph is ploted to check for internal energy, total energy, contact energy and hourglass energy.
- To plot the graphs, go to Hypergraph 2D and upload the Law2_epsmax_failureT01 file.
- After upoading the file, select the y components, y requests and y type to plot the respective graph.
- Below graph shows the Internal energy, Total energy, contact energy and hourglass energy vs time.
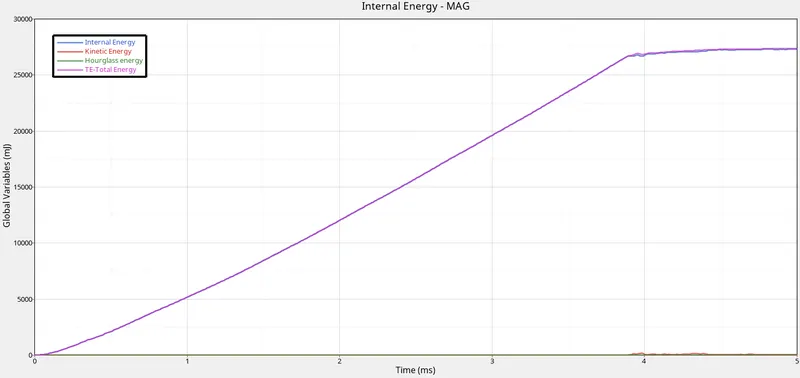
- In the graph, internal energy and total energy is almost same, while kinetic energy is almost zero and rises a bit at the ened of the simulation.
- Kinetic energy is almost zero as the plate is stationary and at the end of the simulation, some elements are disintegrated from the plate. Hence there is a small variation in the graph at the ened of the simulation.
- As the ball hits the plate, all the kinetic energy from the ball is transffered into the plate and this energy deforms the plate. Hence the internal energy and total energy is almost same and has some variation at the end due to the slight variation in the kinetic energy.
- As Ishell is 24(QEPH) in the given Rasdioss file, the energy error is 0.8% and the hourglass energy is zero.
|
Maximum Internal energy |
2.732245e+04 mJ |
|
Maximum Kinetic energy |
1.792562e+02 mJ |
|
Maximum Hourglass energy |
0.000000e+00 mJ |
|
Maximum Total energy |
2.737593e+04 mJ |
Case 2: In /FAIL/JOHNSON, change Ifail_sh=1, Dadv=1 and Ixfem=1. Run the model as Law_epsmax_crack.
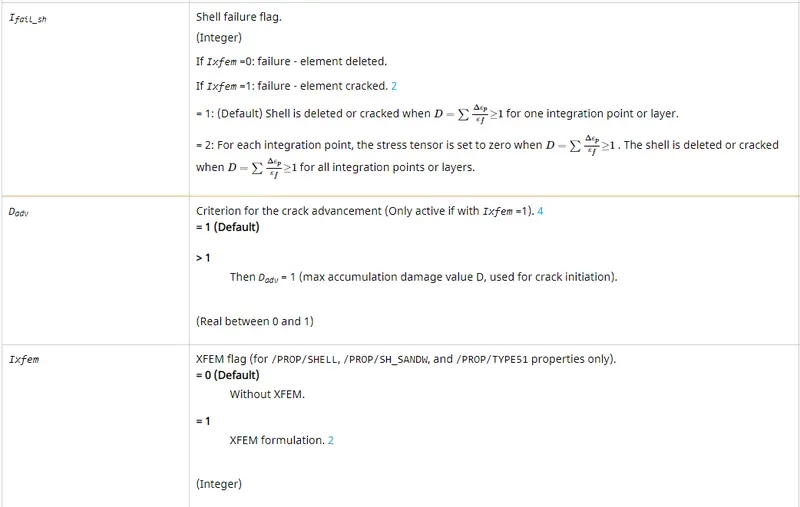
- In this case failure mode has been changed, i.e Ifail, Dadv and Ixfem values are changed.
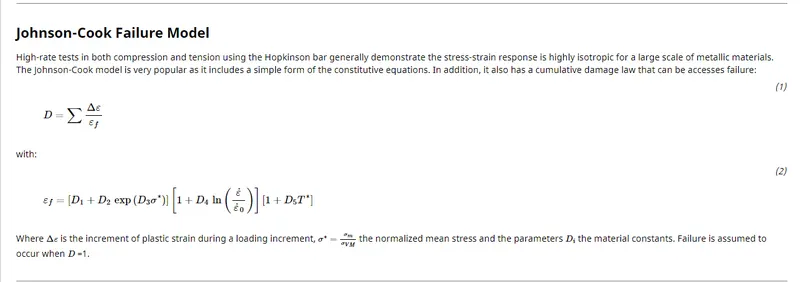
- Here Johnson-Cook failure model is used in this simulation as it includes a simple form of the constitutive equations.
- Below image shows the Johnson-Cook failure model.
- Below image shows the significance of the Ifail, Dadv and Ixfem.
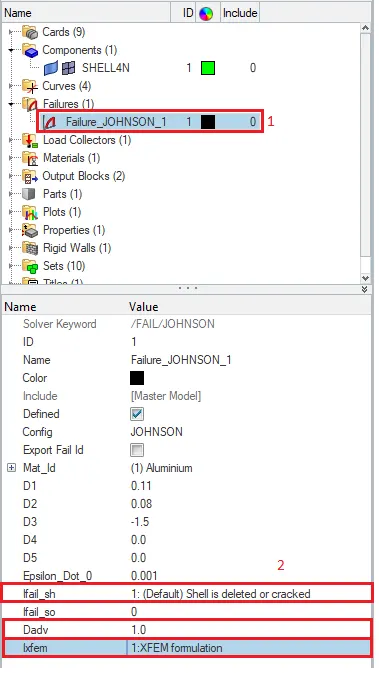
- In order to change the values, Model view > failure > Failure_JOHNSON_1 > On clicking, a tab will open at the bottom, change the values of the Ifail, Dadv and Ixfem in the tab.
- After changing the values, run this program as Law2_epsmax_crack.
- After running the program, open in Hyperview and play the simulation.
- Below image shows the ball hitting the plate simulation.
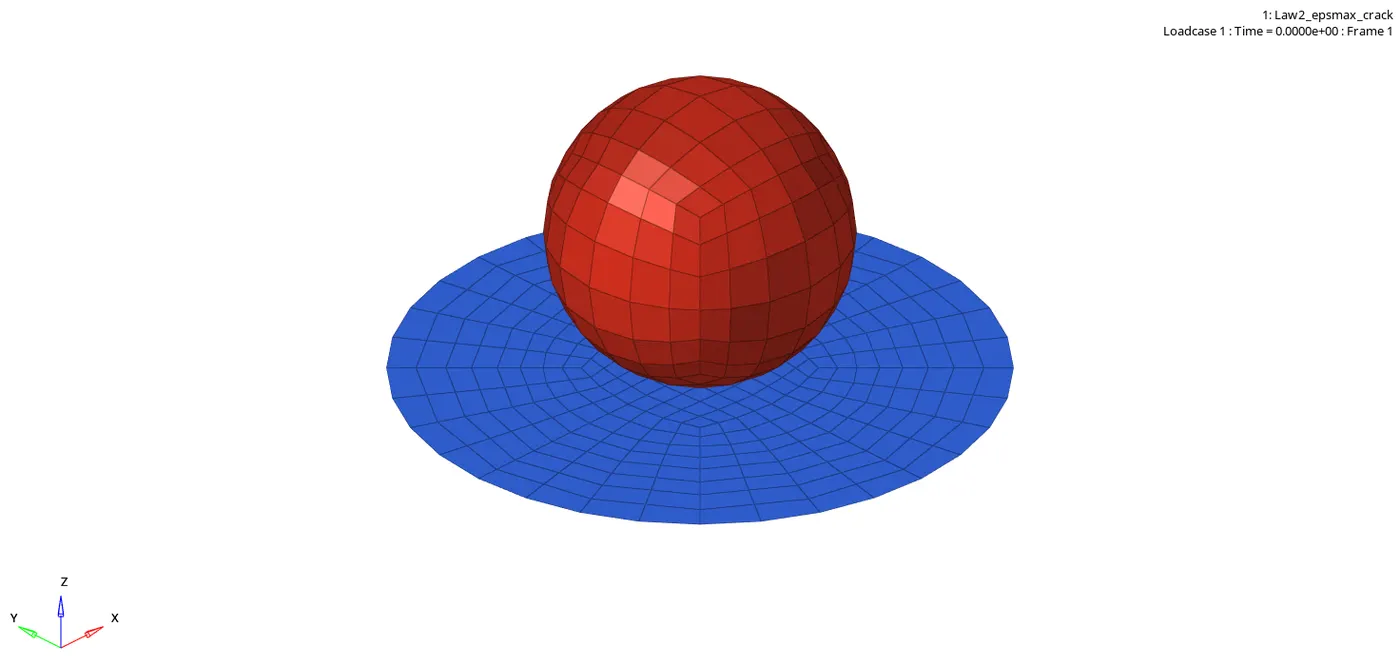
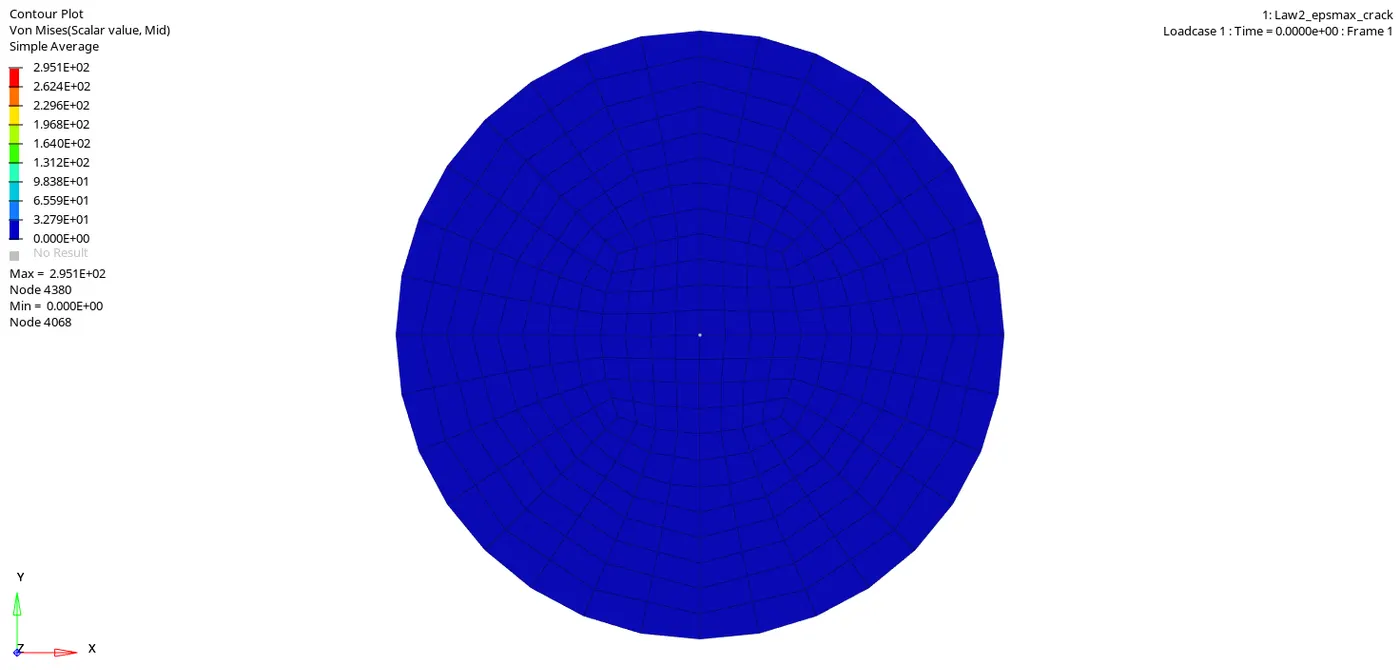
- Using the contour tool, the Von Mises stress induced in the plate can be displayed.
- In another window, Hypergraph can be opened and energy vs time graph can be plotted.
- The procedure to plot the graph is followed as per the previous case.
- Below image shows the Internal energy, Total energy, Kinetic energy and Hourglass energy vs time graph.
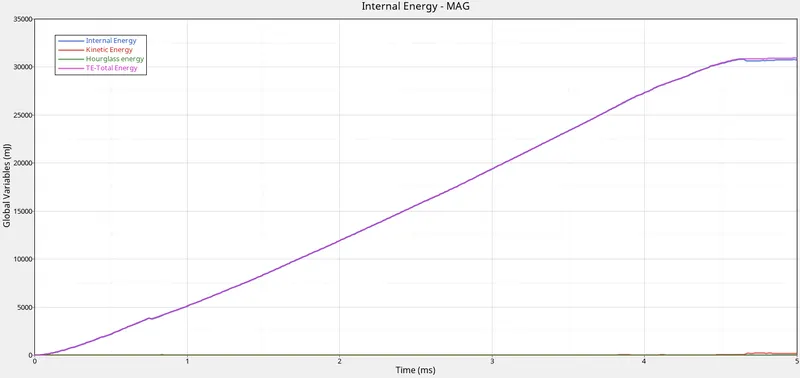
|
Maximum Internal energy |
3.081247e+04 mJ |
|
Maximum Kinetic energy |
2.102860e+02 mJ |
|
Maximum Hourglass energy |
0.000000e+00 mJ |
|
Maximum Total energy |
3.095338e+04 mJ |
- In the graph Internal energy and total energy is almost same and kinetic energy is almost zero and rises little bit at the end of the simulation i.e after 4.5ms.
- Kinetic energy is almost zero as the plate is stationary and at the end of simulation some elements are disintegrated from the plate. Hence there is small variation in the graph at the end of the simulation.
- As the ball hits the plate all the kinetic energy of the ball is transfered into the plate and the this energy deforms the plate. Hence the internal energy and the total energy is almost same and has some variation due to variation af kinetic energy.
- As Ishell is QEPH i.e 24 in the given Radioss file the Energy error is 4.1% and the Hourglass energy is zero
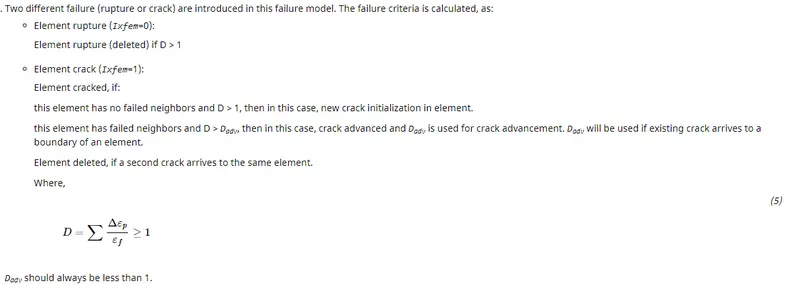
- Due to the XFEM formulation (Ixfem=1) the some elements disintegrate from the plate after 4.5ms.
- XFEM formulation is shown in the below image.
Case 3: Delete /FAIL/JOHNSON CARD and run the model as Law2_epsmax_nofail.
- Failure models define material failure by relating the plastic strain at failure to the stress state in the material.
- By deleting the Failure model in the simulation the elements are deleted as per the Maximum plastic strain.
- To delete the FAIL/JOHNSON card Model View>delete the Failure.
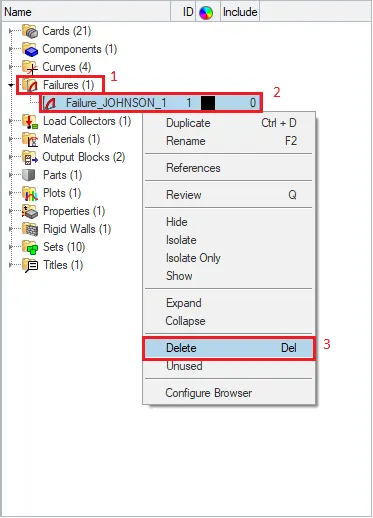
- After deleting the failure card, run the program.
- After running the program, open in Hyperview and play the simulation.
- Below gif shows the ball hitting the plate simulation.
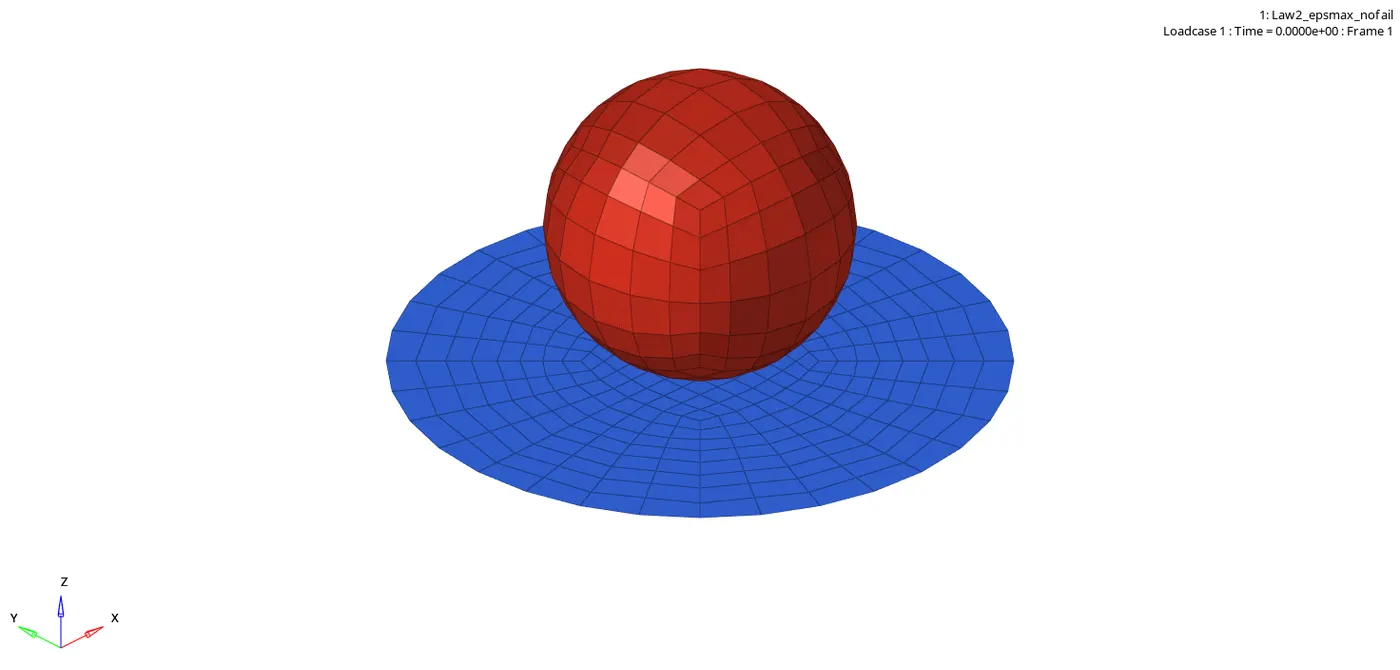
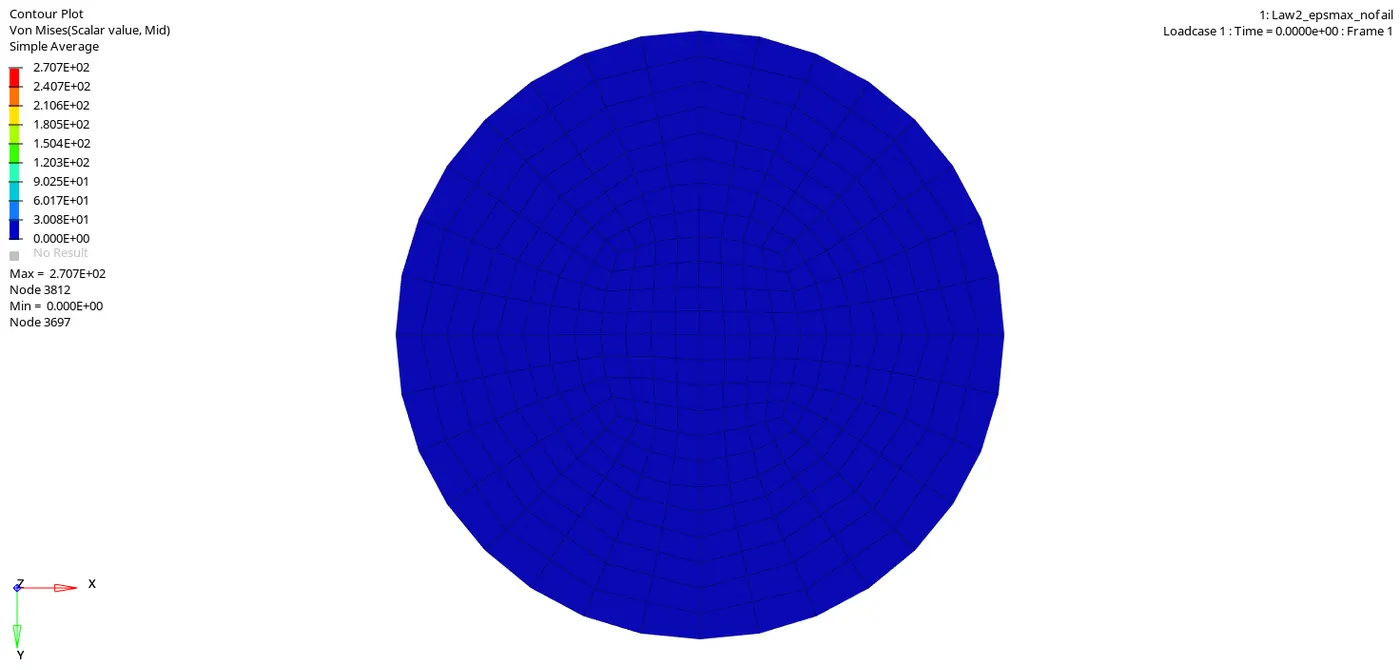
- Using the contour tool, Von Mises stress induced in the plate can be displayed.
- In another window, Hypergraph is opened and the Energy vs Time graph is plotted.
- The procedure to plot the graph is followed as per the previous case.
- Below image shows the Internal energy, Total energy, Kinetic energy and Hourglass energy vs time graph.
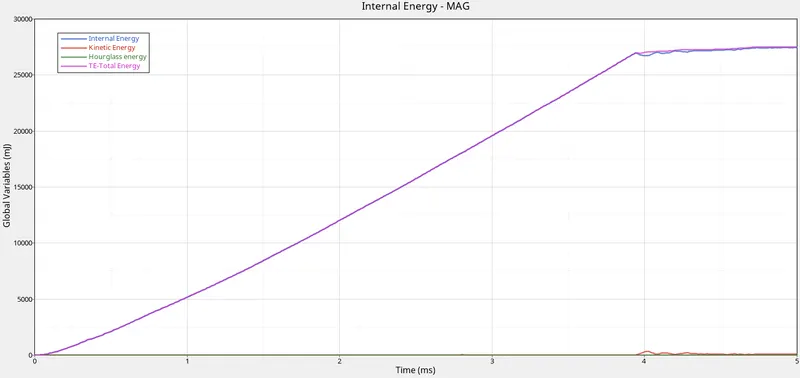
- In the graph Internal energy and total energy is almost same and kinetic energy is almost zero and rises little bit at the end of the simulation i.e after 4ms.
- Kinetic energy is almost zero as the plate is stationary and at the end of simulation some elements are disintegrated from the plate. Hence there is small variation in the graph at the end of the simulation.
- As the ball hits the plate all the kinetic energy of the ball is transfered into the plate and the this energy deforms the plate. Hence the internal energy and the total energy is almost same and has some variation due to variation af kinetic energy.
- As Ishell is QEPH i.e 24 in the given Radioss file the Energy error is 4.1% and the Hourglass energy is zero.
- As the failure card is deleted as per the Maximum plastic strain there is crack propogation and disintegration of elements from the plate
|
Maximum Internal Energy |
2.744307e+04 mJ |
|
Maximum Kinetic Energy |
3.320729e+02 mJ |
|
Maximum Hourglass Energy |
0.000000e+00 mJ |
|
Maximum Total Energy |
2.752837e+04 mJ |
Case 4: Delete the value of the EPS_p_max and run the model with name Law2.
- In this case eps_p_max value is deleted i.e to set the value to defaut value.
- Here the default value of the EPS_p_max is 1e+30.
- To change the value of the EPS_p_max, Model view>Material>Aluminium>In the tab below change the value of EPS_p_max to 1e+30 or delete the value it will automatically set it to default value.
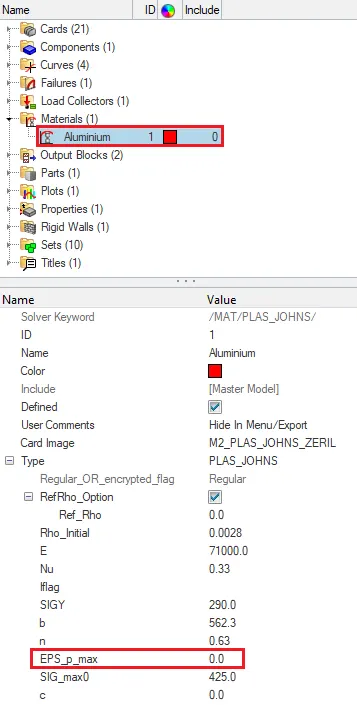
- After changing the value run the file and check the results.
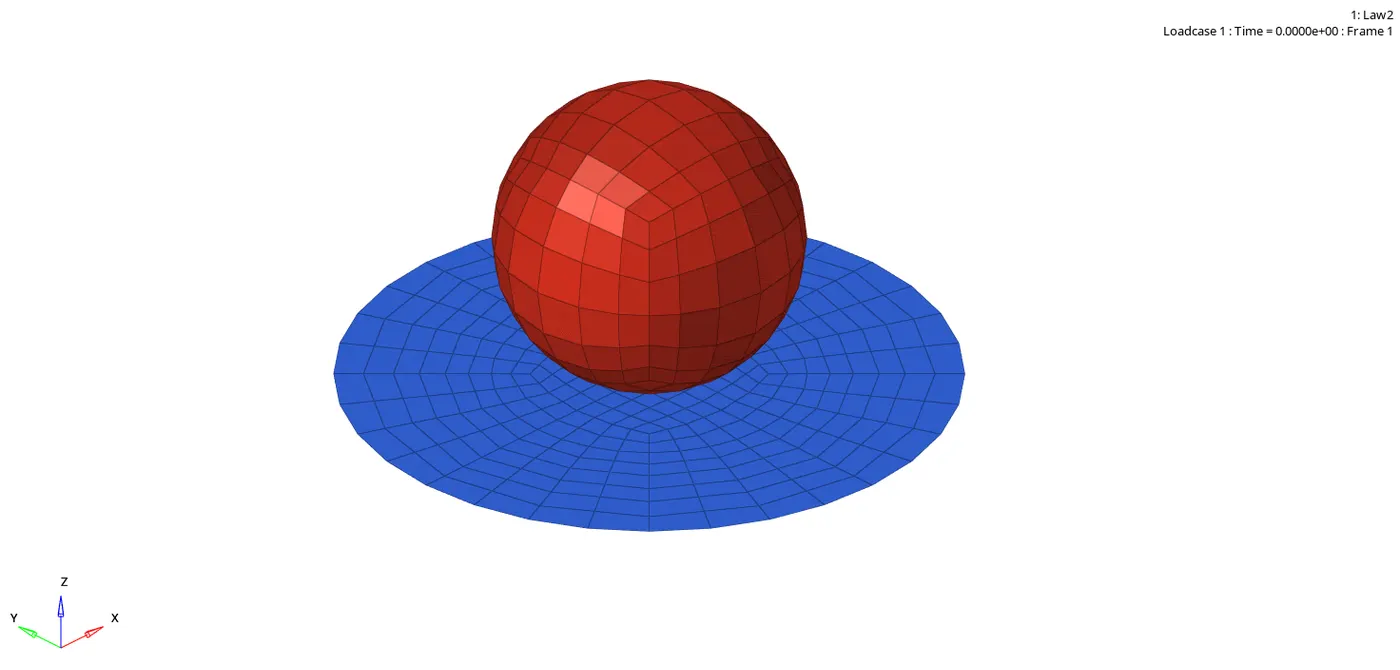
- The gif below shows the simulation of ball hitting the plate with EPS_p_max values as zero.
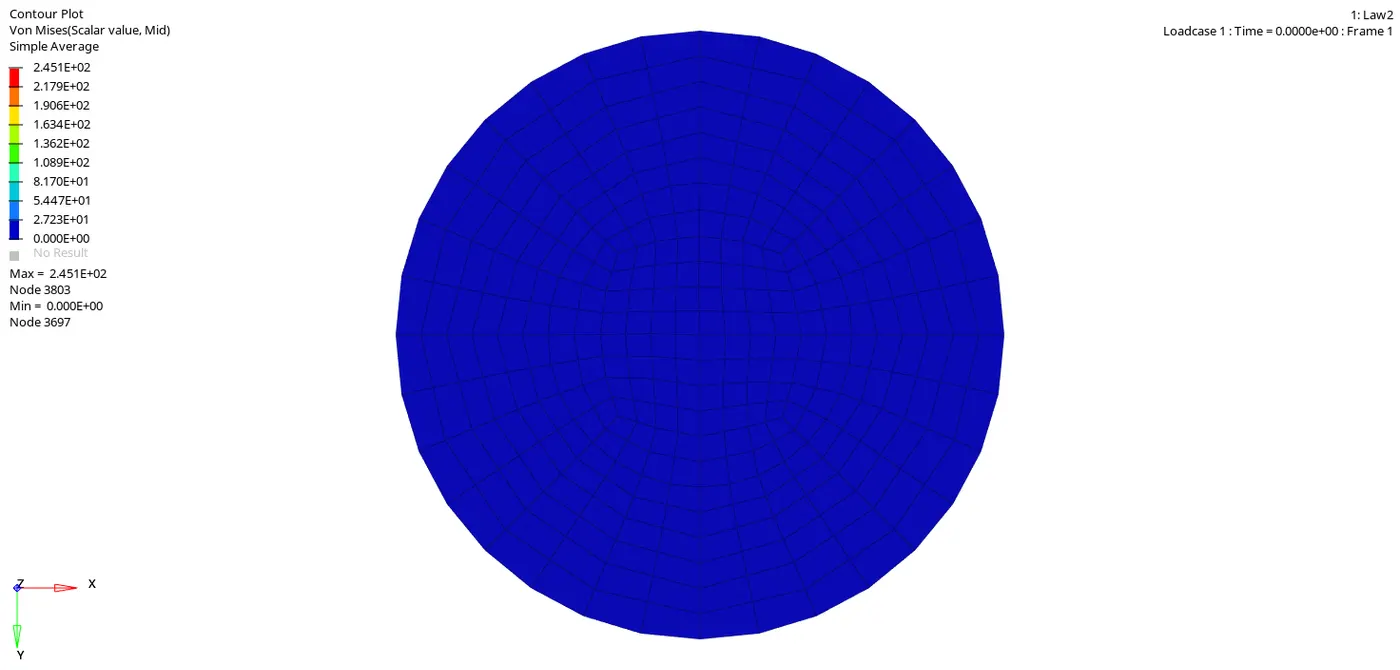
- Below gif shows the Von Mises stress induced in the plate.
- After getting the results plot energies vs time graph in Hypergraph.
- Image below represents the graph of energies vs time.
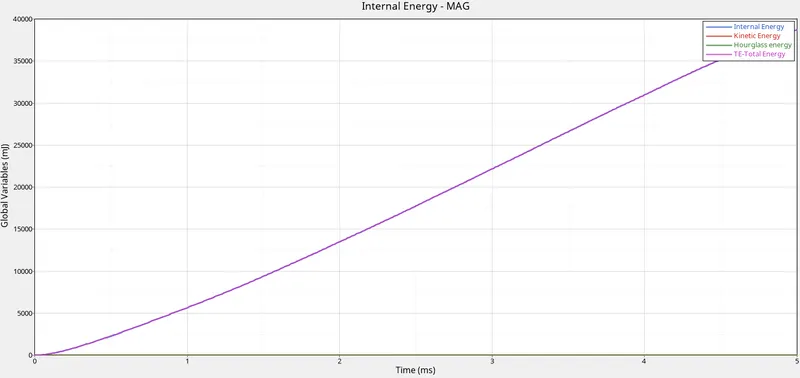
- In that graph the kinetic energy of the ball is transfered into the plate as deformation.
- Hence Total energy is almost same as the internal energy and there are no significant kinetic energy in the plate.
- Also due to QEPH property the Hourglass energy is zero.
- Faiure of the elements are due to the FAIL/JOHNS card as EPS_p_max is zero
|
Maximum Internal energy |
3.872482e+04 mJ |
|
Maximum Kinetic energy |
1.523841e+01 mJ |
|
Maximum Hourglass energy |
0.000000e+00 mJ |
|
Maximum Total energy |
3.872877e+04 mJ |
Case 5: Convert this material model to LAW1 elastic with same density, E, nu and run. Check the results.
- In this case, the material model is converted from LAW2 to LAW1 in the material card and LAW1 is an elastic material.
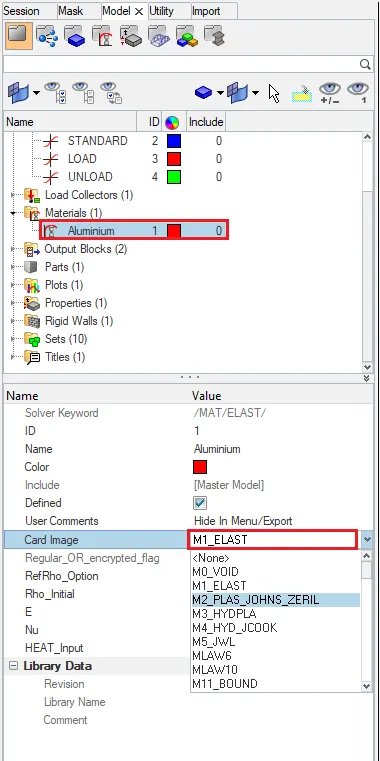
- To change from LAW2 to LAW1, model view > materials > aluminium > On clicking, a tab will open below > In that tab, change the card image from M2_PLAS_JOHNS_ZERIL to M1ELAST.
- After changing the material card, we can run it and check for results.
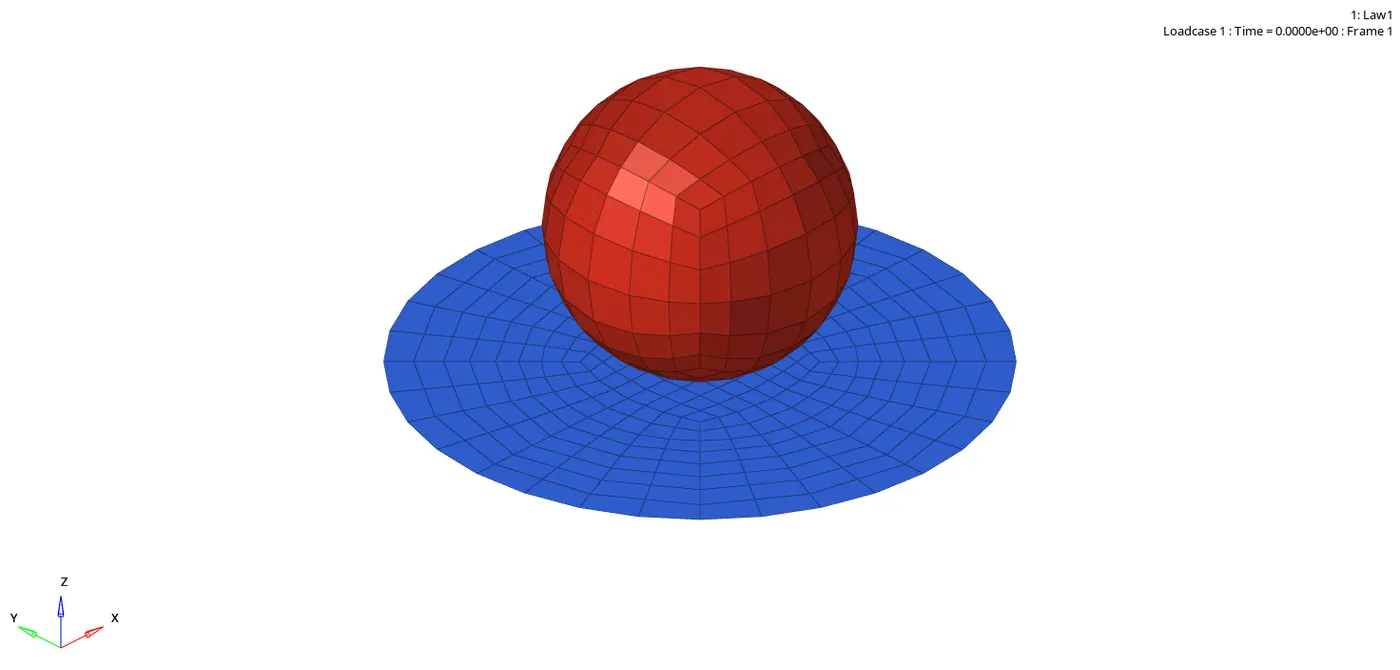
- Below gif shows the simulation of ball hitting the plate with M1_ELAST material card.
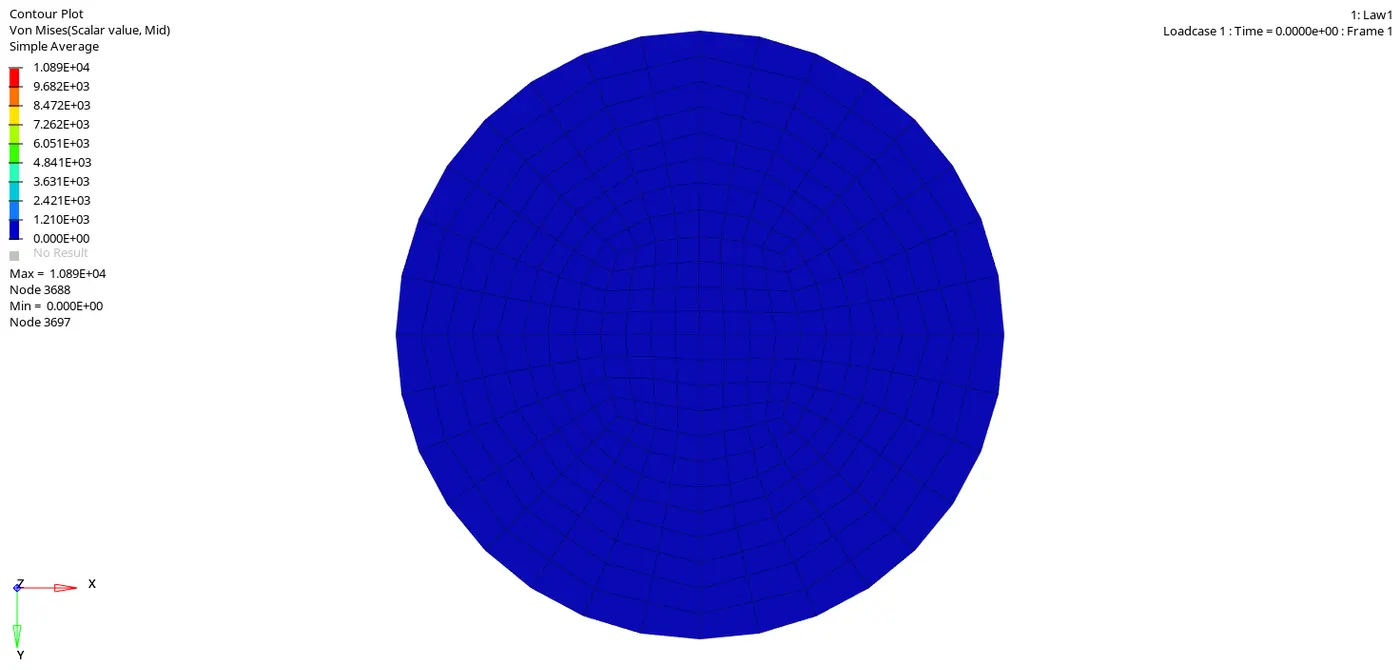
- Below gif indicates the Von Mises stress induced on the plate.
- In the above animation, there is no element failure as there is no failure card and failure criteria.
- Also the the maximum Von Mises stress induced is 1.089E+04 MPa.
- Below image represents the graph of energies vs time.
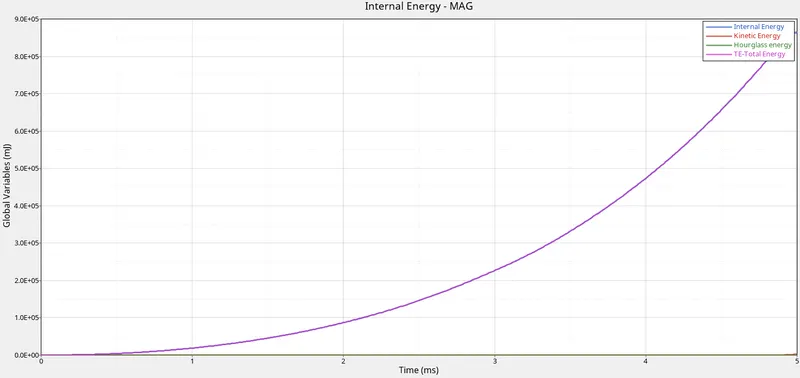
- In the graph the internal energy of the plate is increasing expenentially as the material is elastic and has no plastic strain.
- All the energy possessed by ball is used to deform the plate.
- Also the Ishell is QEPH, so the hourglass energy is zero.
|
Maximum Internal energy |
8.625334e+05 mJ |
|
Maximum Kinetic energy |
3.245742e+03 mJ |
|
Maximum Hourglass energy |
0.000000e+00 mJ |
|
Maximum Total energy |
8.656458e+05 mJ |
Case 6. Convert the card to LAW36 elastic plastic material based on the given details in the below image.
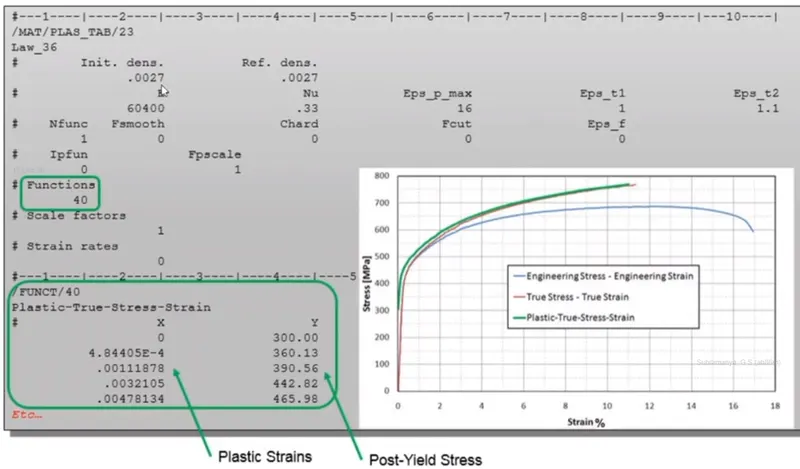
- Import the file and change the material to LAW36.
- To change the material card Model view>Material>Select Aluminium>A tab will open below in that tab change the material to M36_PLAS_TAB.
- After changin the material card add the values of rho, nu, E, EPS_p_max, EPS_t1, EPS_t2.
- A curve is to be created indrder to create Plastic strain for post yield stress.
- To create a curve Create a new curve in model view by right clicking on the Curve>create.
- A new tab will open, in that tab New>Name the curve>Proceed>A new curve will be present in the curve list>Add the values of the curve i.e co-ordinates of the points>Update.
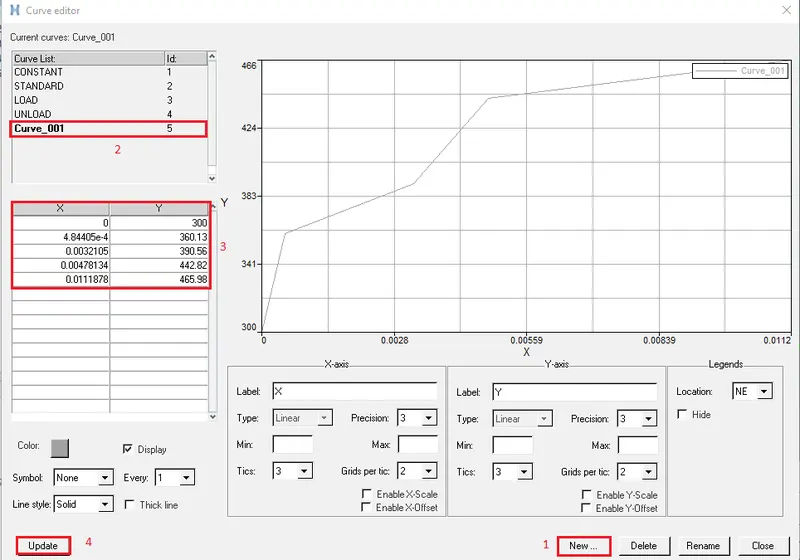
- After creating the curve attach this curve to the material card.
- To attach the curve Model View>Material>Aluminium>In the tab below change the value of Nfunc to 1>fct_ID>select the curve>Curve_001.
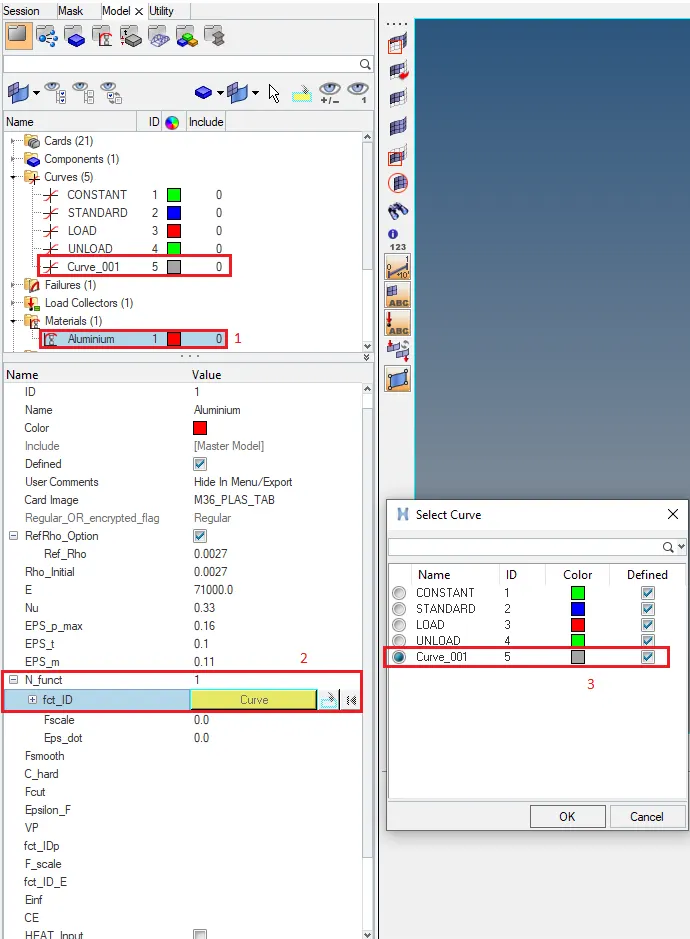
- After attaching the curve to the material card run the file.
- Open the file in Hyperview and check for the animation.
- Below animation shows the simulation of the ball hitting the plate.
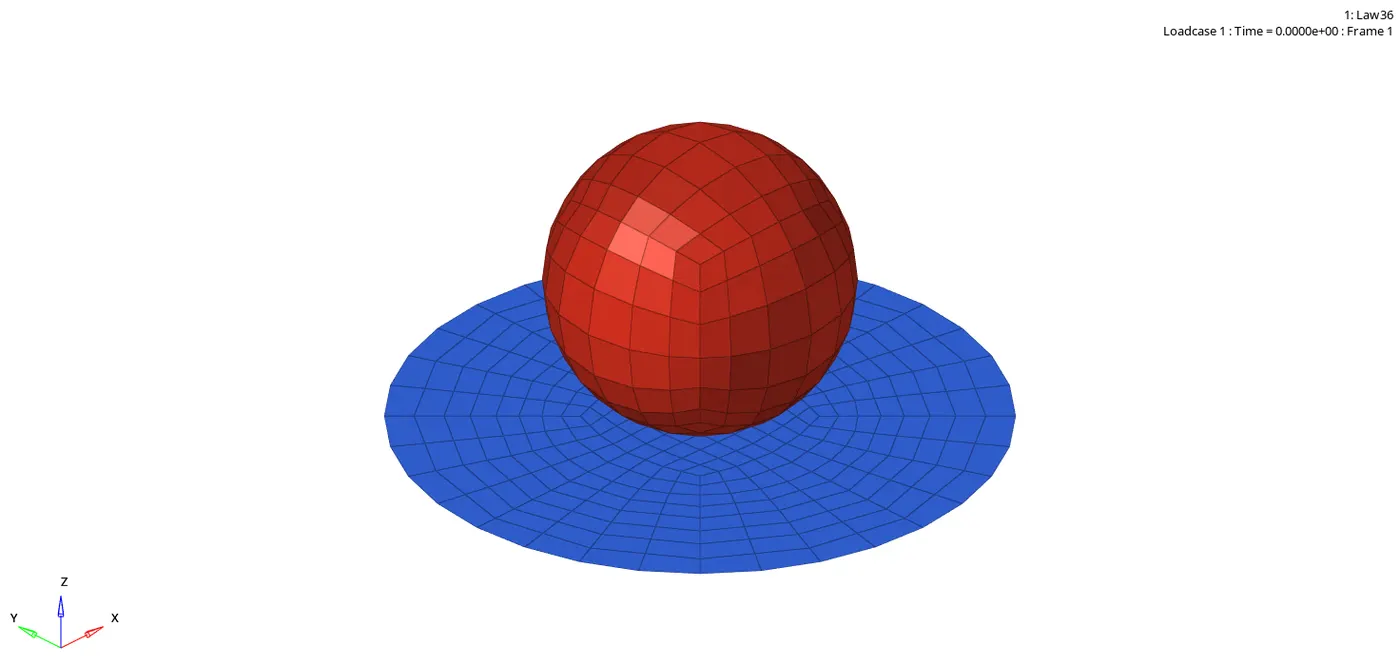
- The below gif shows the Von Mises stress induced in the plate.
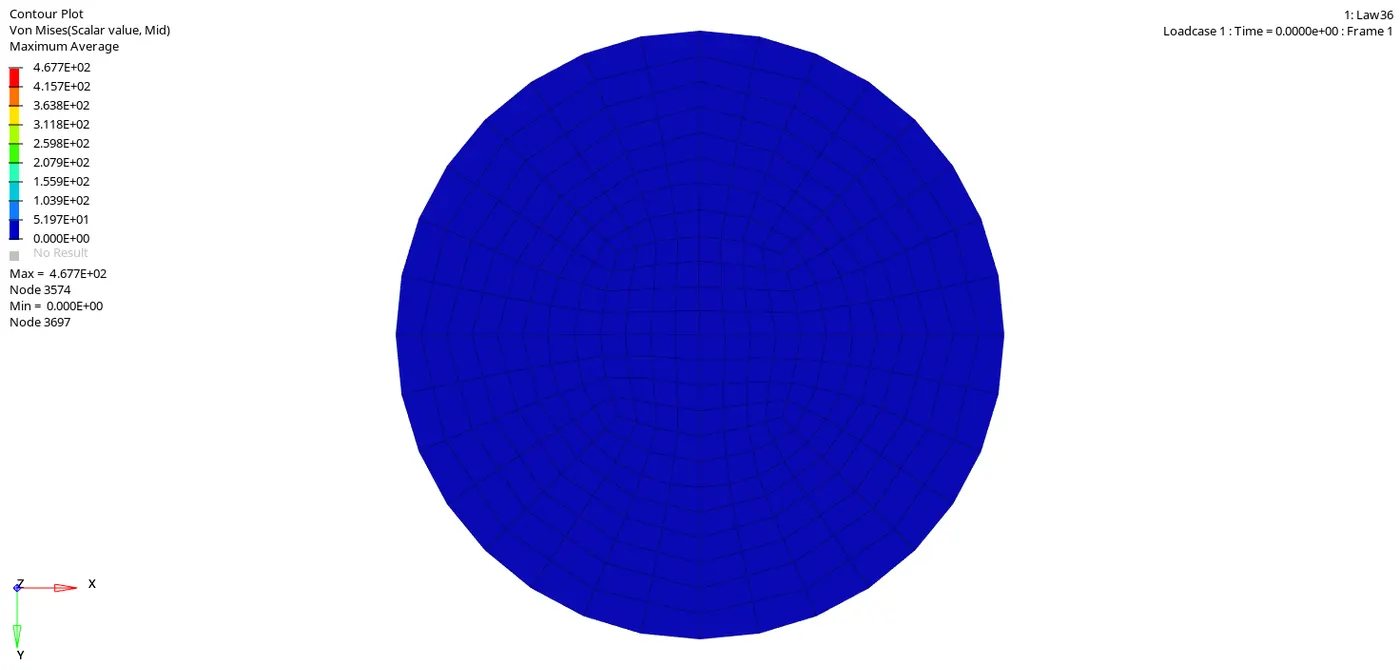
- Using the Hypergraph, the energy vs time graph can be represented.
- Below image shows the energy vs time graph of the simulation.
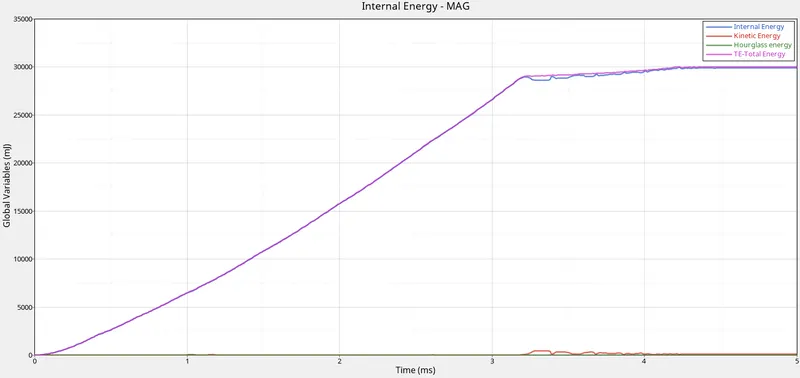
- As a curve is defined for plastic strain, the element fails after 3 ms in the simulation.
- Also the Total energy is almost the same as Internal energy and has slight variation after 3ms.
- There is very less Kinetic energy due to the disintegrated elements.
|
Maximum Internal energy |
2.996825e+04 mJ |
|
Maximum Kinetic energy |
4.750140e+02 mJ |
|
Maximum Hourglass energy |
0.000000e+00 mJ |
|
Maximum Total energy |
3.004505e+04 mJ |
CASE 7: OPEN LAW270000.RAD:
CHANGE THE SHELL PROPERTIES TO THE RECOMMENDED SHELL PROPOERTIES.
NOTICE THE MATERIAL CARD. JOHNSONS COOK PARAMETERS BUT DIFFERENT VALUES FOR EPS BASED FAILURE.
RUN THE MODEL WITH NAME LAW27.
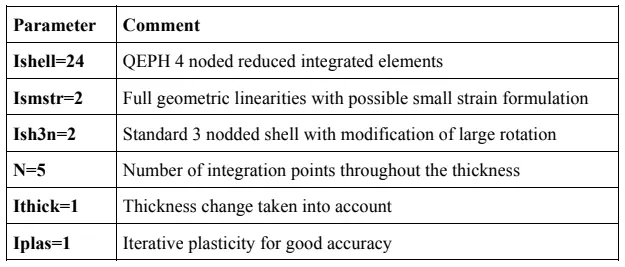
- Import the solver deck Law27_0000.rad and change the shell properties to the recommended shell properties.
- The recommended shell properties are shown in the below image.
- The below image shows the material card for the given rad starter file.
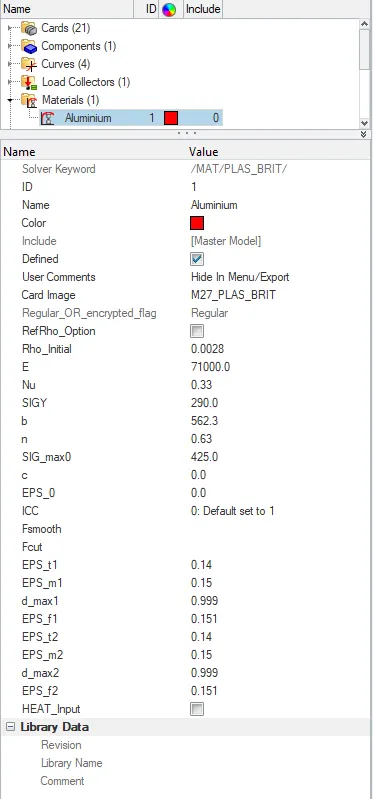
- In the material card, the failure happens due to the brittle failure criteria.
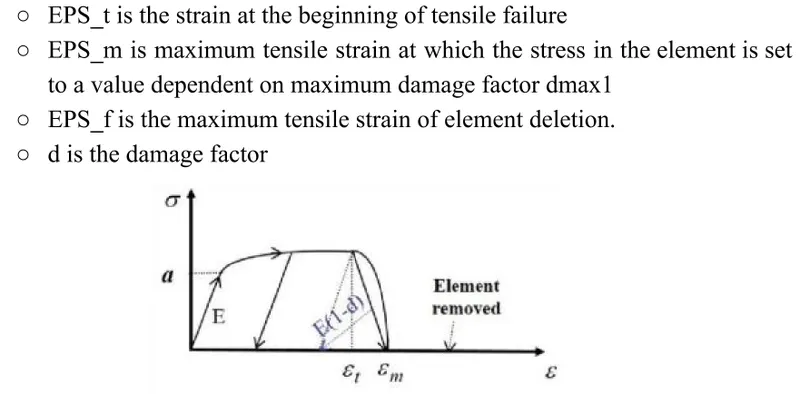
- EPS_t1, EPS_m1, d_max1, EPS_f1, EPS_t2, EPS_m2, d_max2 and EPS_f2 are the brittle failure criteria parameters.
- Image below shows the details of the brittle failure parameters.
- After setting the shell properties, run the rad file and check for results.
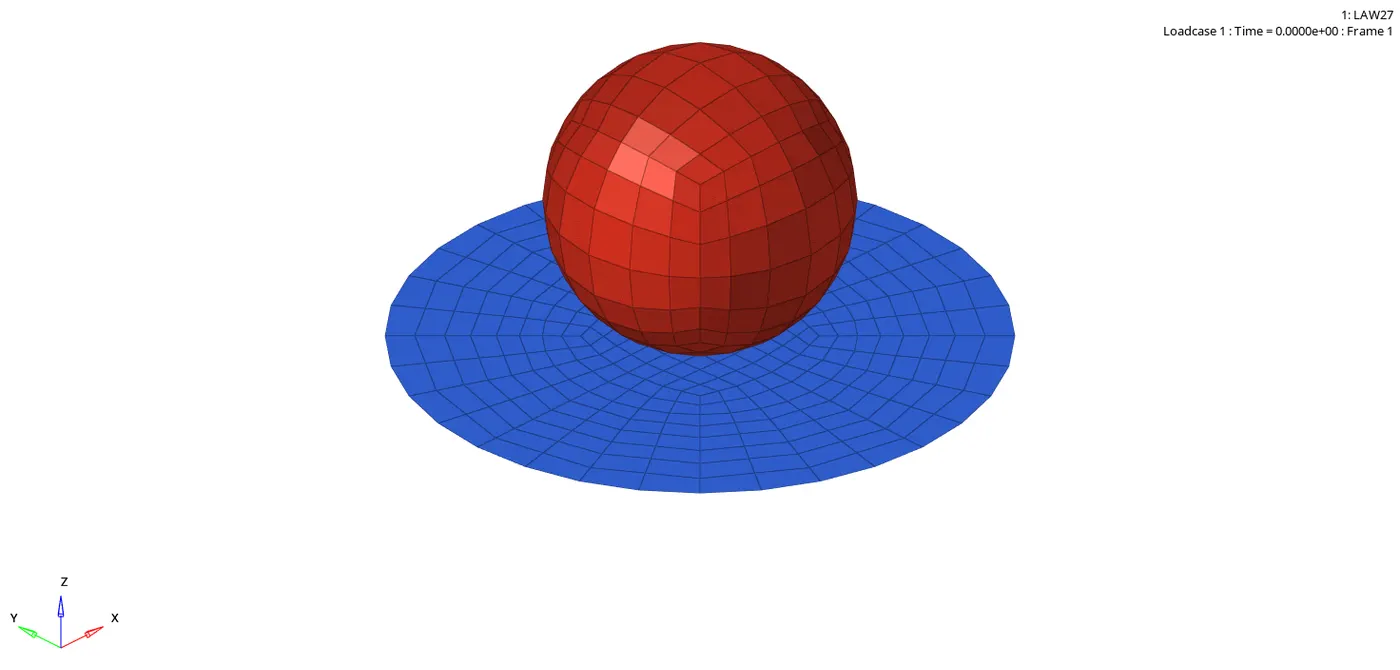
- Animation below shows the simulation of this case.
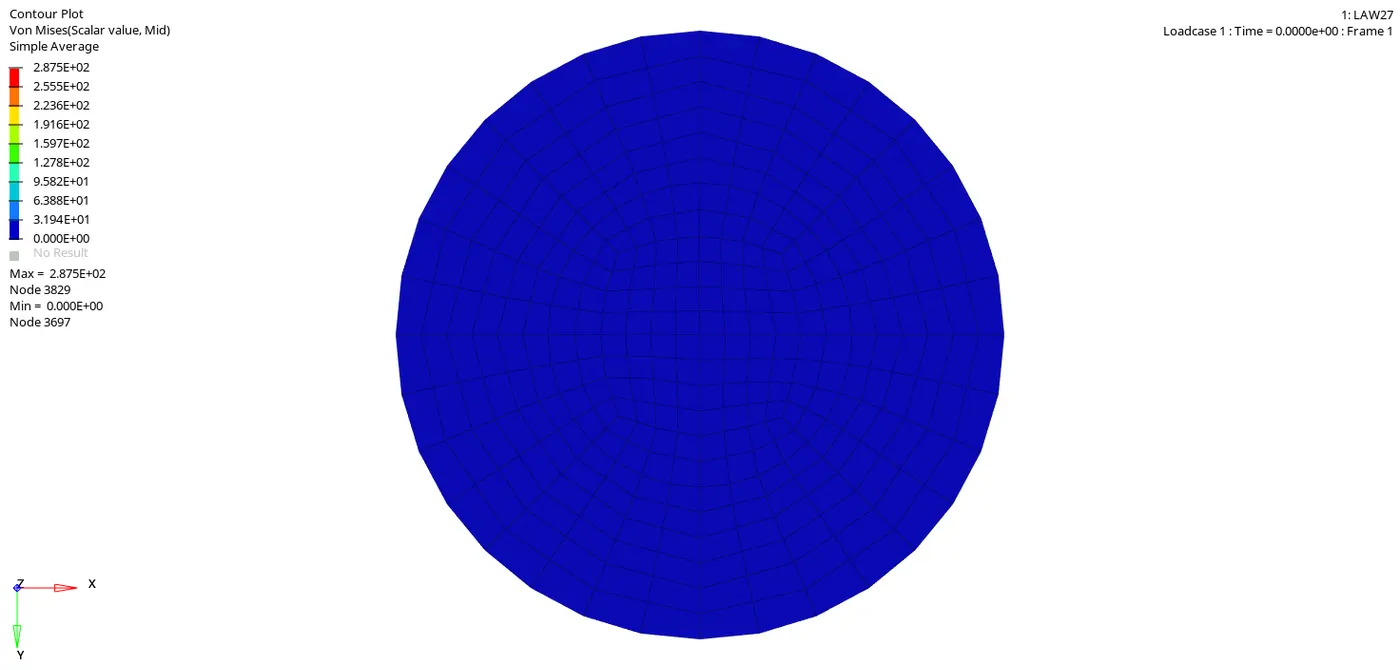
- Using the contour, we can also see the Von Mises stress induced in the plate.
- Using the Hypergraph, the energy vs time graph can be plotted.
- Below image represents the graph of energy vs time.
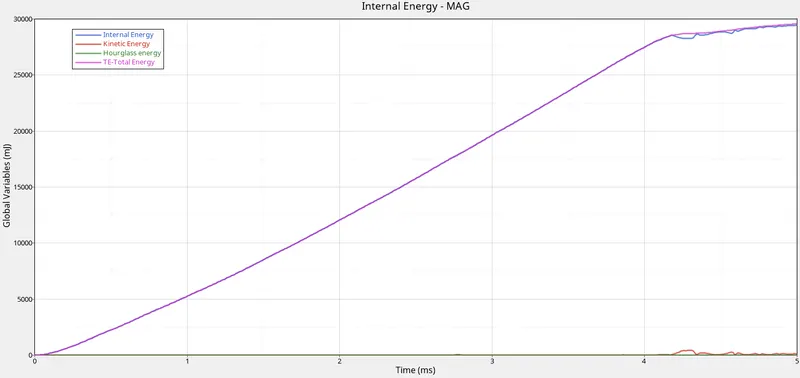
- Energy possessed by the ball is transfered to the plate as deformation.
- Hence total energy is same as internal energy.
- At the end of the simulation after 4ms, some elements disintegrate from the plate.
- These small pieces of the plate have some velocity and hence some Kinetic energy is produced at the end of the simulation.
- Ishell is set as QEPH, hence the hourglass is zero.
|
Maximum Internal energy |
2.947673e+04 mJ |
|
Maximum Kinetic energy |
4.258883e+02 mJ |
|
Maximum Hourglass energy |
0.000000e+00 mJ |
|
Maximum Total energy |
2.958129e+04 mJ |
COMPARISON OF ALL 7 CASES:
| CASES | MATERIAL LAW | ENERGY ERROR | MAXIMUM INTERNAL ENERGY | MAXIMUM KINETIC ENERGY | MAXIMUM TOTAL ENERGY | FAILURE MODE |
|
CASE 1 |
LAW2 | 0.8% | 2.732245e+04 mJ | 1.792562e+02 mJ | 2.737593e+04 mJ | EPS based failure |
|
CASE 2 |
LAW2 | 4.1% | 3.081247e+04 mJ | 2.102860e+02 mJ | 3.095338e+04 mJ | Johnson-cook failure |
|
CASE 3 |
LAW2 | 0.8% | 2.744307e+04 mJ | 3.320729e+02 mJ | 2.752837e+04 mJ | EPS based failure without failure card |
|
CASE 4 |
LAW2 | 1.1% | 3.872482e+04 mJ | 1.523841e+01 mJ | 3.872877e+04 mJ | EPS based failure |
|
CASE 5 |
LAW1 | 1.3% | 8.625334e+05 mJ | 3.245742e+03 mJ | 8.656458e+05 mJ | No failure mode |
|
CASE 6 |
LAW36 | 0.1% | 2.996825e+04 mJ | 4.750140e+02 mJ | 3.004505e+04 mj | Brittle failure |
|
CASE 7 |
LAW27 | 0.8% | 2.947673e+04 mJ | 4.258883e+02 mJ | 2.958129e+04 mJ | EPS based failure |
CONCLUSION:
Simulation of all the 7 cases are ran using the Hypermesh and the results are viewed in Hyperview and graphs are plotted in Hypergraph.
Also all the cases are compared with each other and came up with the conclusion that
- In case 2, the energy error is near to 5%, which is near to the ideal value.
- In case 7, the values from the actual testing can be used for co-ordinates of the graph, so that the accuracy of the result is increased.
- In case 5, LAW1 material card is used, hence the components are subjected to load within the elastic limit ,so it doesnt fail and at the same time, it saves time and energy.
- EPS based failures are efficient in cases where some amount of plastic strain is allowed.
BASED ON ALL THE RESULTS, WHICH CASE WOULD REPRESENT THE ON-FIELD SCENERIO?
LAW36:
- In LAW36, the energy error is between -1.4% to 0.7% which is acceptable since both the values are near to zero.
- Also the values we used are the actual values from labs based on real life experiments.
- The plastic region is from the lab values and the elastic region can be occupied using the young's modulus and Poisson's ratio.
- These reasons make LAW36 more similiar to real life compared to the others.