Assignment 4
Aim
To simulate an CI engine simulation and comapre the parameters to an SI Engine.
Brake Mean Effective Pressure (BMEP)
The comparative measure of power capabilities of engines which operates with same engine displacement and speed and forms a basis for the index performance.
BMEP = `(60000* BP)/(LAN` Pa
where
BP = Brake Power
L = Stroke length
A = Cross Sectional area of Cylinder
N = Engine rpm
Brake Specific Fuel Consumption (BSFC)
The specific fuel consumption(SFC) is defined as the total fuel consumption per h per kW developed. When BP is used to calculate SFC it is termed as Brake Specific Fuel Consumption.
BSFC = `(60*omega_f)/ (BP`60⋅ωfBP"> kg/bkWh
where
`omega_f` = fuel supplied kg/min
BP = Brake Power
Brake Power
The actual work output of an engine at the crankshaft is called as Brake Power.
BP = `(2 pi N T)/60000` kW
where
N = Engine rpm
T = Torque
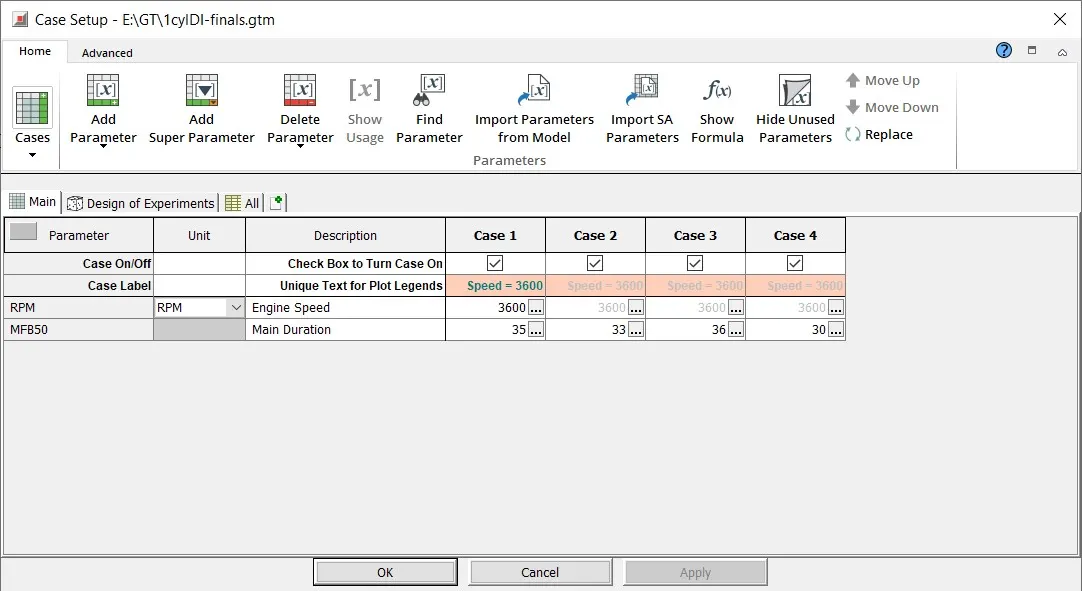
Case Setup
Engine Peformance Charatersitics of CI
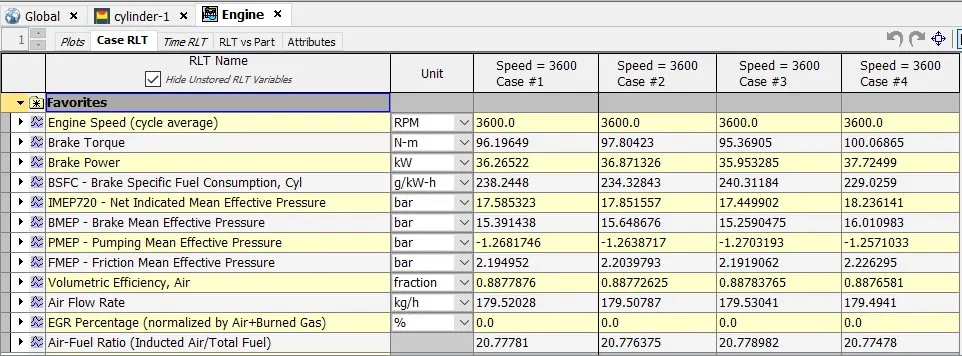
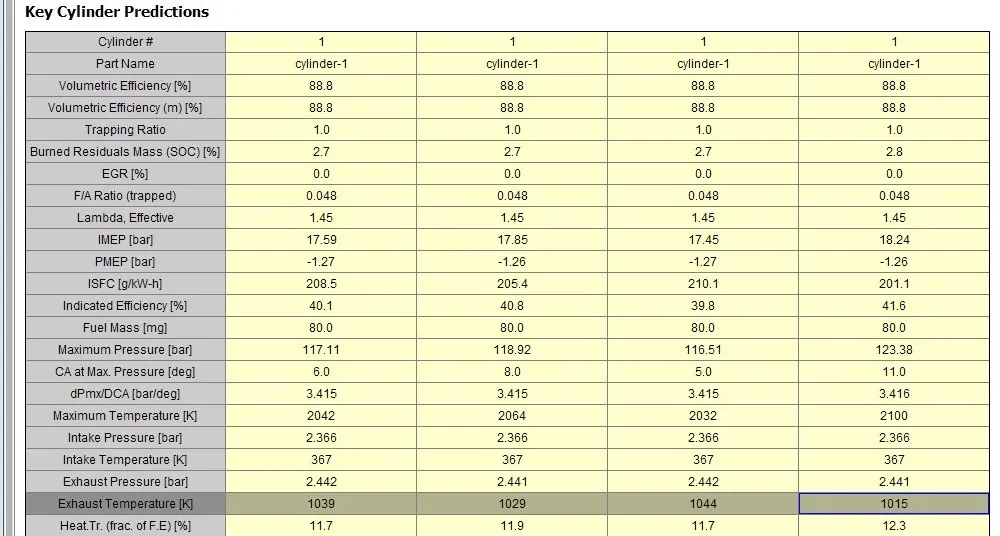
The case 1 is the default conditions.
BSFC = 238.244 g/kW-h
Exhaust Temperature = 1038 K
Air/Fuel Ratio = 20.778
BMEP = 15.3 bar
Brake Power = 36.26 kW
Engine Peformance Charatersitics of SI
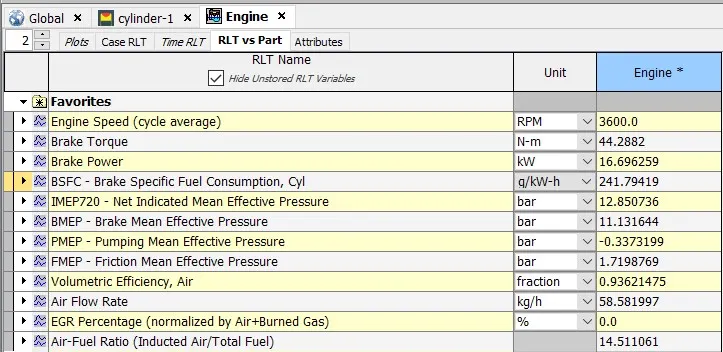
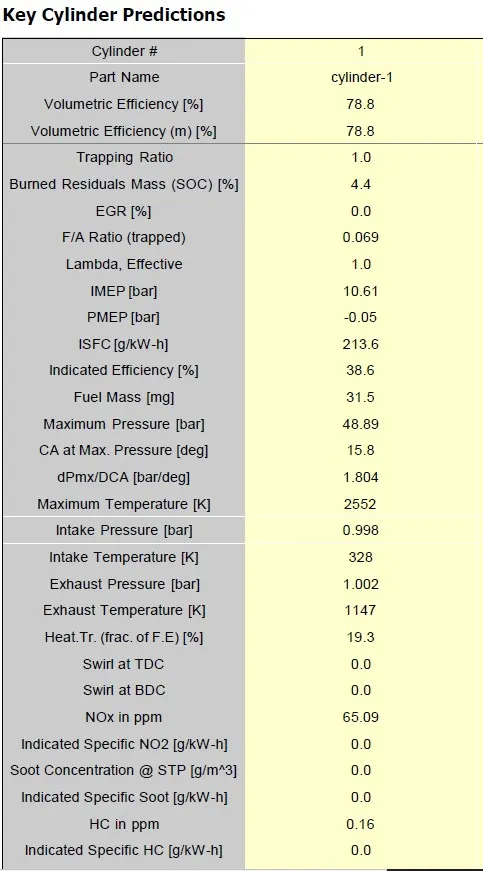
BSFC = 241.794 g/kW-h
Exhaust Temperature = 1147 K
Air/Fuel Ratio = 14.511
BMEP = 11.13 bar
Brake Power = 16.69 kW
Comparison of SI and CI
- As we can see that for the same engine rpm the brake power of the CI engine is higher than the SI engine.
- Also the BSFC of the SI is higher than the CI engine which is about 1.47% more.
- There is also increase in exhaust temperature in the SI engine when compared to the CI engine.
MFB 50 Changes
Case 2
BSFC = 234.328 g/kW-h
Exhaust Temperature = 1029 K
Air/Fuel Ratio = 20.78
BMEP = 15.64 bar
Brake Power = 36.9 kW
Case 3
BSFC = 240.133 g/kW-h
Exhaust Temperature = 1043K
Air/Fuel Ratio = 20.78
BMEP = 15.25 bar
Brake Power = 35.95 kW
Case 4
BSFC = 229.0525 g/kW-h
Exhaust Temperature = 1015 K
Air/Fuel Ratio = 20.78
BMEP = 16.01 bar
Brake Power = 37.72 kW
- When the MFB 50 is altered which is the main duration of the crank angle in the combustion process.In case 2 the MFB 50 was 33 as you can see that the BP and BSFC has incresed from the base setup but when compared to case 3 the BP and BSFC has decreased.
- Case 4 seems to be the Ideal setup for the simulation in terms of fuel consumption and production of brake power and brake torque.
- This indicating that the lower the MFB 50 higher tends to be the Brake Power and Brake Torque.
Result
- From this we know that when comparig to the SI and CI engine, CI engine has more power and torque for the same engine speed.
- Interms of MFB 50 lower the value higher is the BP, Brake Torque and lower the BSFC.
Engine Performance of this Simulation can be viewed below
https://drive.google.com/file/d/1CBGG907P93nTEnCvMfkLj0kjx6m7qH3-/view?usp=sharing