Assignment 3-2D Element Formulation Challenge
AIM:
- To run and compare the graphs for the different energies before and after applying the property conditions .
- Run the stimulation at the from t = 25 and tstop = 55
Procedure
Import the .0000rad file using the import option from the database tool
Change the value of the Tstop value = 55
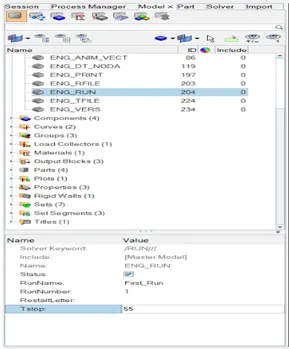
Fig showing the tstop value
Change the value of the Tstart value = 25 (where the stimulation starts )
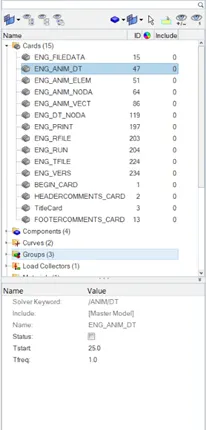
Fig showing the Tstart value in the property table
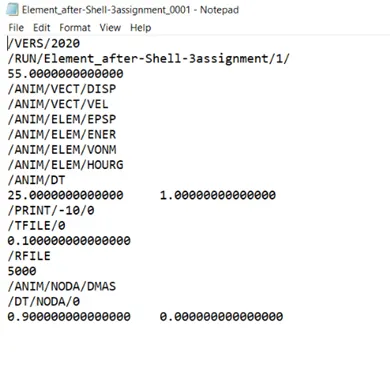
Case 1
Run the stimulation by the radios
(analysis>radios>save as>select the path>select the .0000rad file>radios>ok)

Check the 0001.out file in note pad
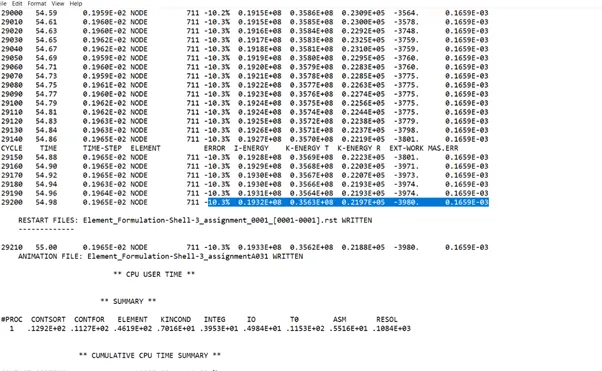
check the energy errors and the mass error of the file .and check whether the error values are with in the limits
plot the graphs for the energy errors with respective to the time
(change the mode to hypergraph 2d>select the file from the main file>assignment 3 >select the t01 file >global values>select the energies KE , IE, HOUR GLASS, TOTAL ENERGY CONTACT ENERGY>MAG>apply)
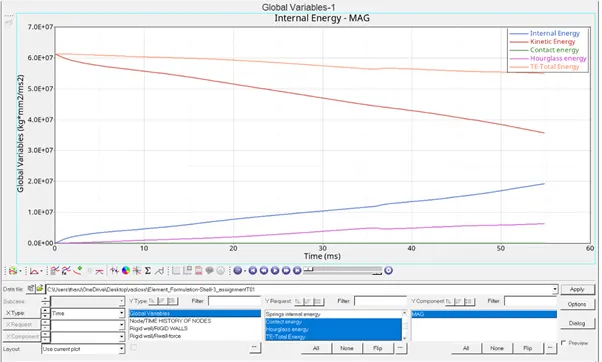
fig showing the energy graphs
Image of the graphs plotted
Plot the values for the rigid walls for the total energy
(rigid walls>4 rigid walls>total energy>apply)
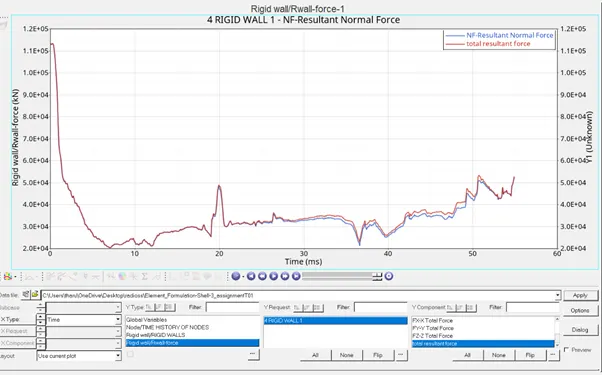
Image of the rigid walls for the total energy
Animation file
Animation file shows the stimaultion getting occurred with in the elements and finds the maximum and the minimum stress points . it branchs the whole element failure with different colors using the vonmosis stress eqn
(change modeto hyperview>select the file .h3d>apply.ok)
Find the element rupture at different times
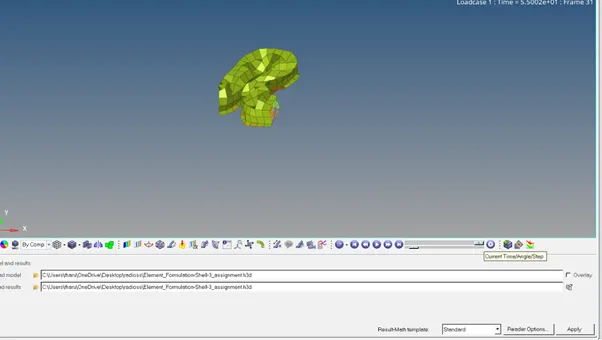
above image shows the element rupture on loads
Animation file image
------------------------------------------------------------------------------------------------------------------
Case 2
Here , all the property values are assigned which could overcome the factors the element characteristic length , hourglass etc.,
Ishell= 24(QPEH)
Here , this is a fully intergrated mesh with low cost here the only single gauus point at the center is located at the center which is manipulated by the nodal points when the shock wave is allowed here the hourglass is compatibly calculated by adding the stiffness from element level
I(smstr=2)
here , in this case if the time step is not achieved while analysis the larger elements are converted into small elements to achieve the perfect time step functions.used to note the small and the large strain values
Ithick=1
As the sound wave is allowed through out the elements when the force is applied is more than it effects the E value which also effects the thickness value . in this case the thickness change is taken into account and the strain is manipulated
I(plas)=1
It is used when the elements undergoes the plastic deformation or above to it the strain values are automatically calculated based on the thickness change
N=5
It is the number of the integration points more the number of integration points more accurate would be the stimulation
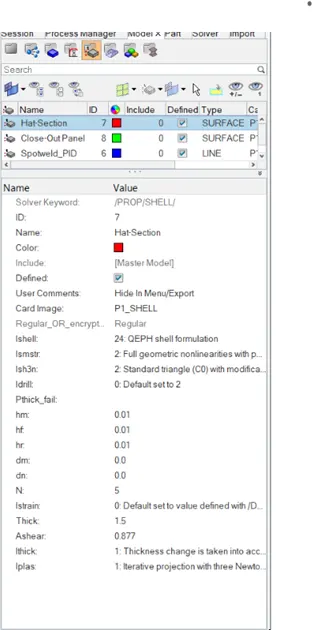
Change the Tstart and Tstop value for the imported file I property card
(analysis>radios>save as>select the path>select the .0000rad file>radios>ok)
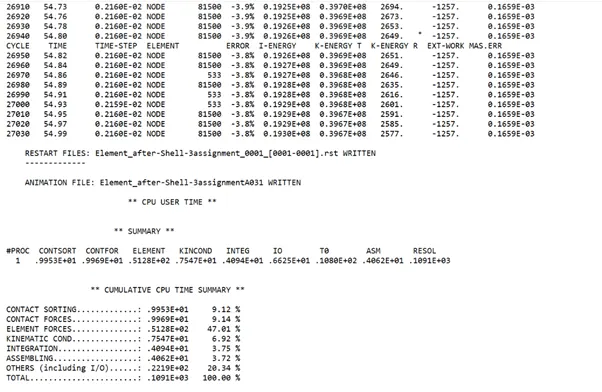
check the energy errors and the mass error of the file .and check whether the error values are with in the limits .
here , it is absorbed that the energy error is less 5 so it is acceptable and the mass errors are found const
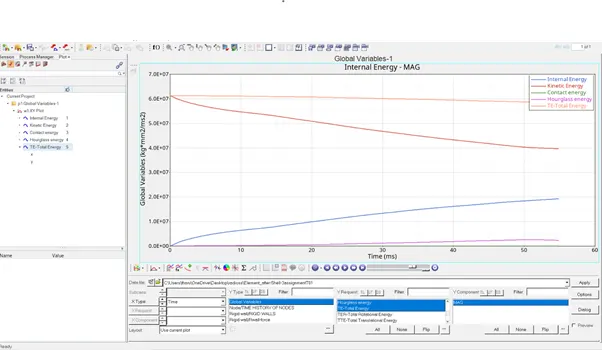
plot the graphs for the energy errors with respective to the time
(change the mode to hypergraph 2d>select the file from the main file>assignment 3 >select the t01 file >global values>select the energies KE , IE, HOUR GLASS, TOTAL ENERGY CONTACT ENERGY>MAG>apply)
Image of the graphs plotted
Plot the values for the rigid walls for the total energy (after)
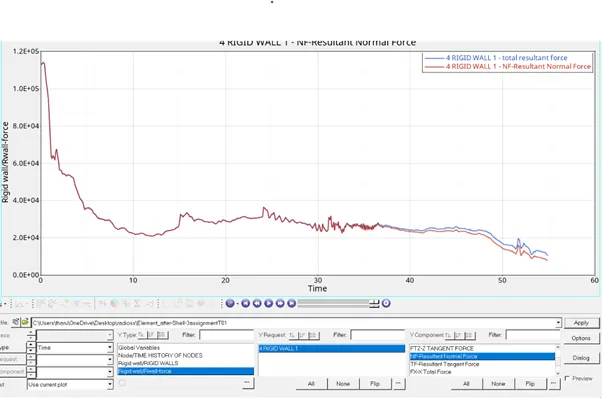
Image of the rigid walls for the total energy (after)
Animation file
Animation file shows the stimaultion getting occurred with in the elements and finds the maximum and the minimum stress points . it branchs the whole element failure with different colors using the vonmosis stress eqn
(change mode to hyperview>select the file .h3d>apply.ok)
Find the element rupture at different ttimes
Animation file image (after)
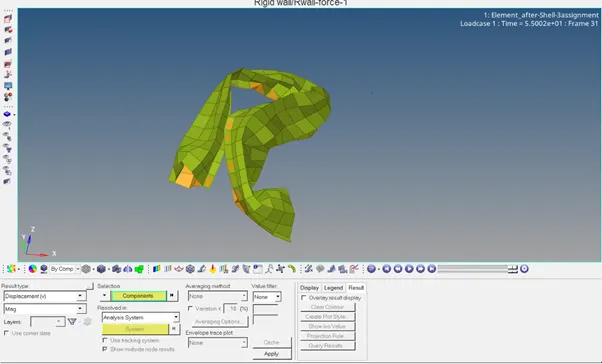
shell elements at t max value
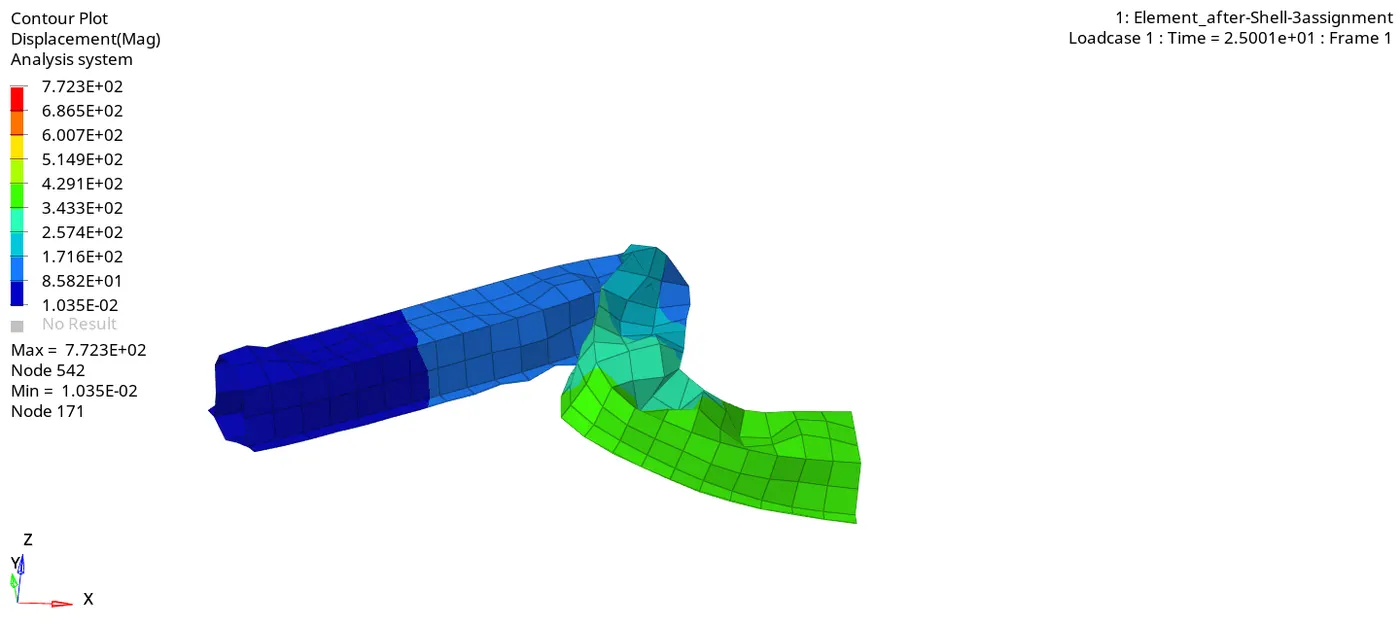
above gif shows the element distortion on load application
Observations by comparing the before and after
1.check the animation file of rupture which the hourglass effect before applying the properties . where as when the properties are applied the element distortion took in an even manner .
2 check in the energy errors when the properties are applied the energy error came down to -3.8 from which is accebtable
outcomes
1.learnt how to assign the property values like ishell. i plas . i thick
2.learnt how to plot the graphs in the hypergaph 2d
3.also learnt how to view the animated file in the hyperview