Assignment 3-2D Element Formulation Challenge
Aim: To run simulation on the model with and without the shell element properties and comparing the results between them.
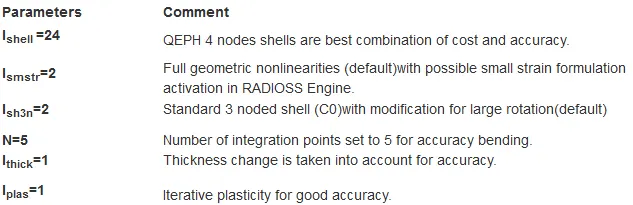
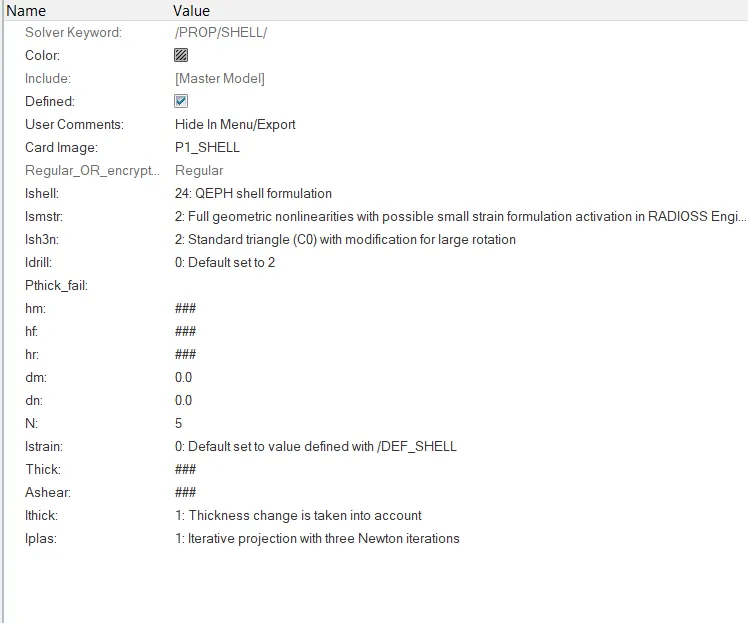
Given shell element properties:
Procedure:
1. Run simulation without the element property:
- Import the crash file using the solver desk.
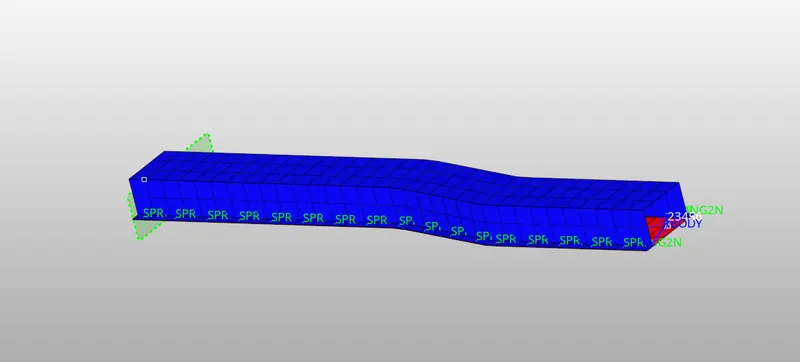
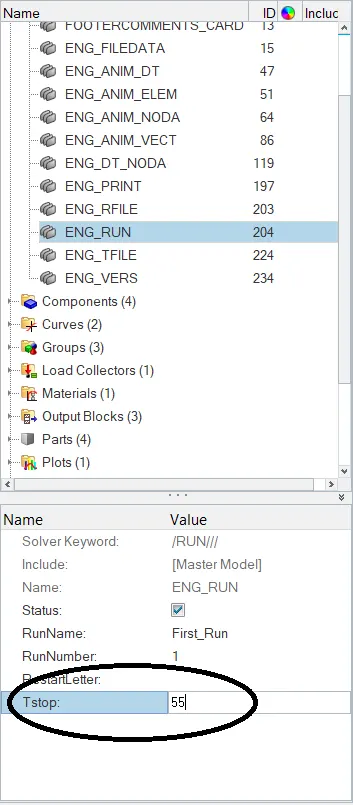
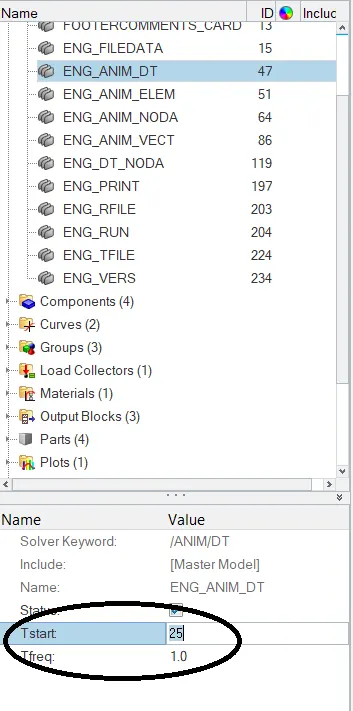
- Changing the run time to 55ms and animation start time to 25ms.
- To run the simulation, go to analysis >> choose the path to save the file >> in options enter "-nt 4" >> radioss.

- After the end of simulation, the energy error and mass error results need to be verified.
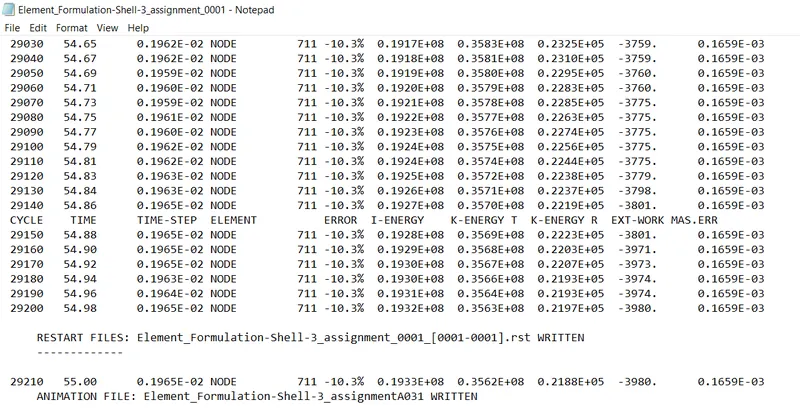
- The energy error is -10.3% which is the acceptable range and mass error is 0.1659E-03.
- Now plot the graphs between internal energy, kinetic energy, hourglass energy and total energy vs time.
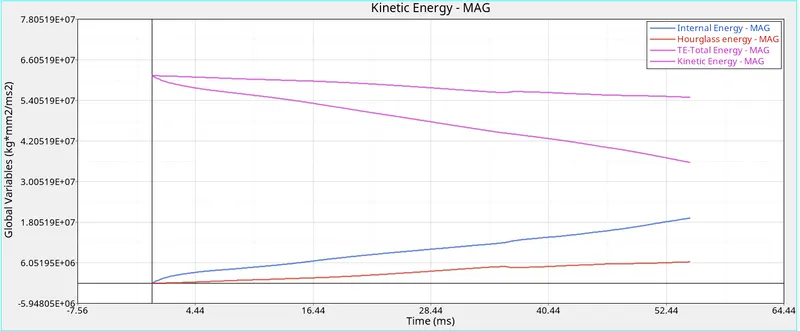
| Global variables | Maximum | Minimum |
| Internal Energy | 1.95 X 10^7 | 0 |
| Kinetic Energy | 6.1 X 10^7 | 3.6 X 10^7 |
| Hourglass Energy | 0.6 X 10^7 | 0 |
| Total Energy | 6.1 X 10^7 | 5.5 X 10^7 |
- Plot the graphs between rigid wall forces vs time.
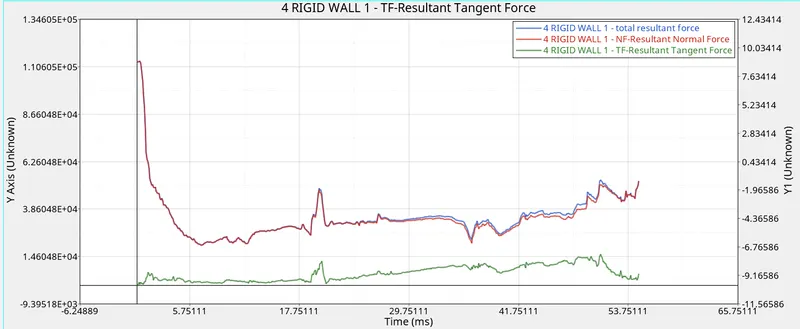
- From the graph, resultant force and normal force are almost similar and decreases with time.
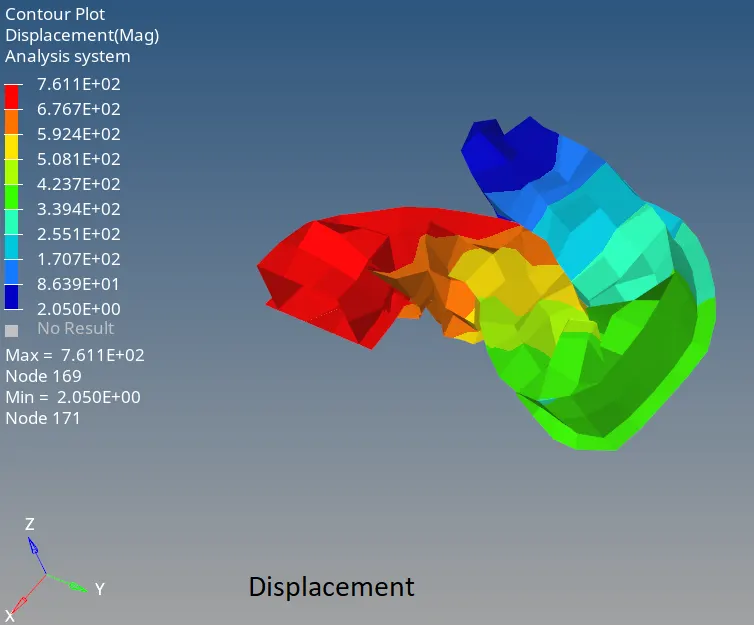
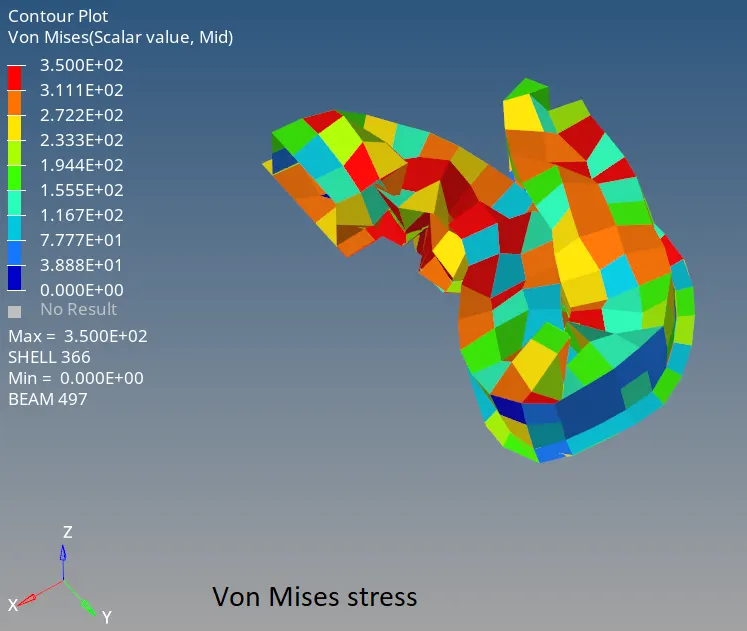
- Displacement and von mises stress are displayed below.
2. Run simulation by changing the shell element properties:
- Import the same .rad file and changed the properties as recommended and saved as a seperate file.
- Now run the simulation.
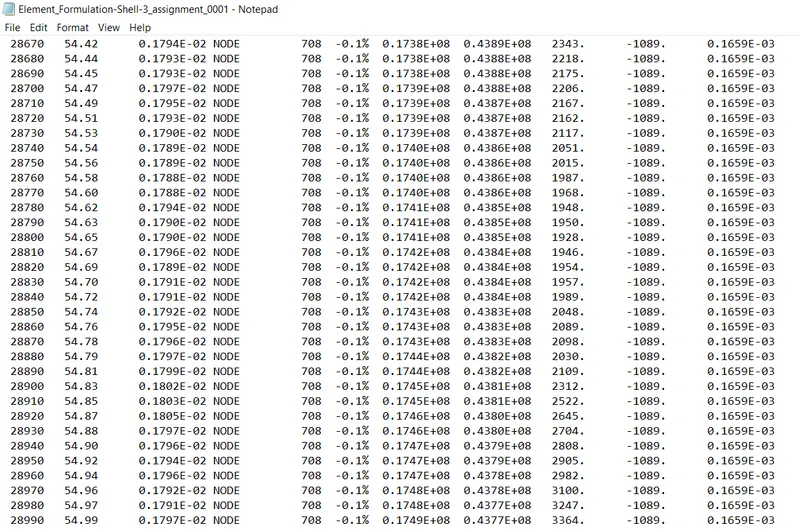
- From the above data, energy error is -0.1% which is better compared to the previous case and mass error is same i.e 0.1659E-03.
- Now plot the graphs between internal energy, kinetic energy, hourglass energy and total energy vs time.
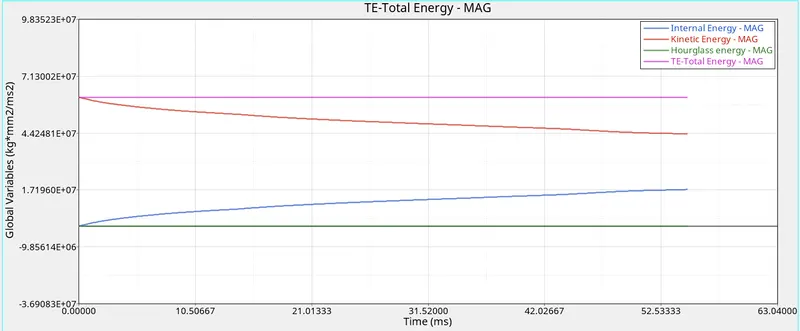
| Global variables | Maximum | Minimum |
| Internal Energy | 2 x 10^7 | 0 |
| Kinetic Energy | 6.1 X 10^7 | 4.1 x 10^7 |
| Hourglass Energy | 0 | 0 |
| Total Energy | 6.1 X 10^7 | 6.1 X 10^7 |
- Now plot the graphs between rigid wall forces vs time.
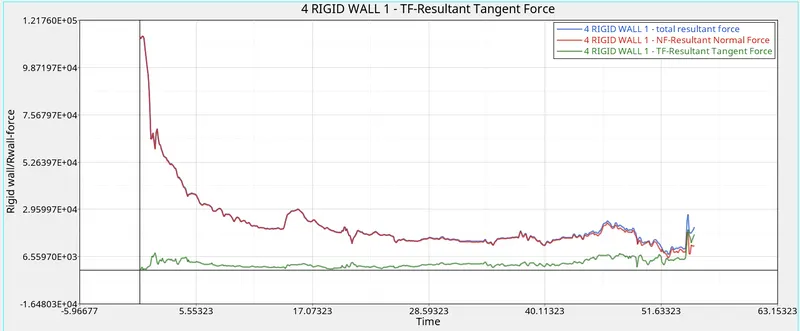
- The resultant force and normal force are almost similar and decreases with time.
- The dispacement and von mises stress are displayed below for improved shell element properties.
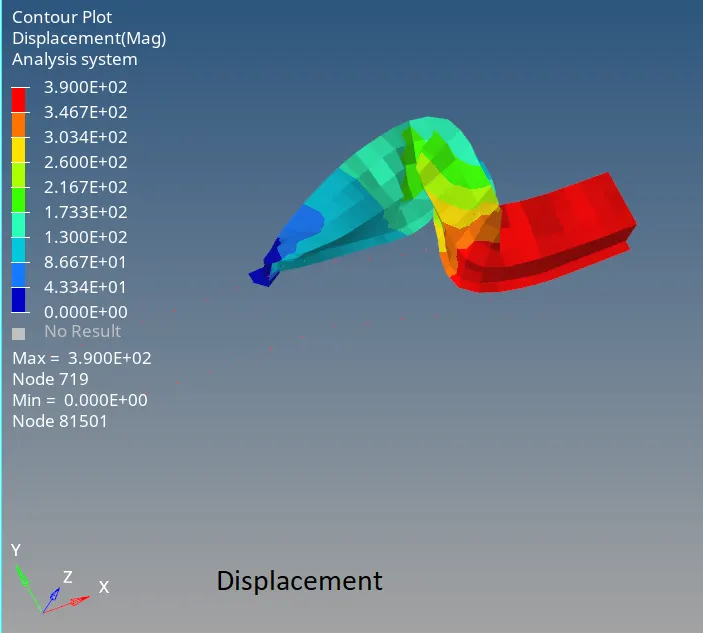
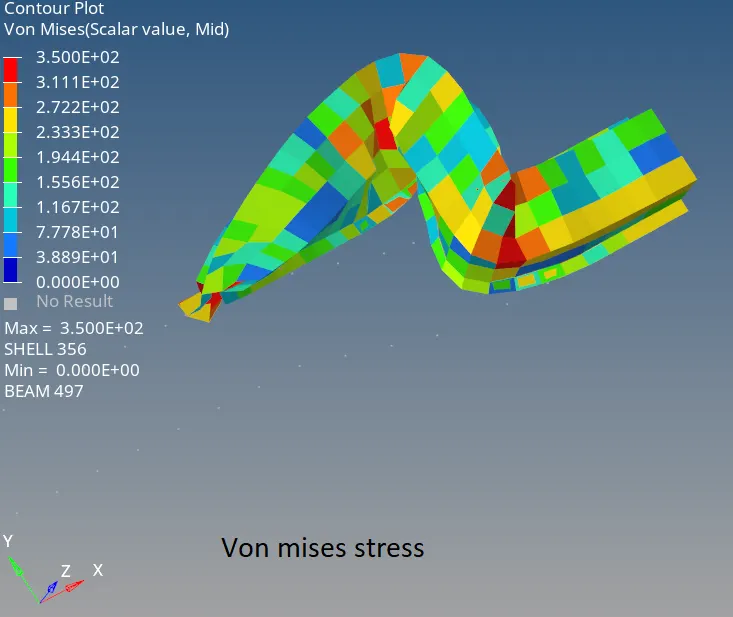
- Comparing the results from both the simulations.
|
Variables |
Base Simulation |
Improved shell element Simulation |
||
|
Max |
Min |
Max |
Min |
|
|
Internal Energy |
1.9 x 10^7 |
0 |
2.7 x 10^7 |
0 |
|
Kinetic Energy |
6.1 x 10^7 |
3.6 x 10^7 |
6.1 x 10^7 |
4.1 x 10^7 |
|
Hourglass Energy |
0.6 x 10^7 |
0 |
0 |
0 |
|
Total Energy |
6.1 x 10^7 |
5.5 x 10^7 |
6.1 x 10^7 |
6.1 x 10^7 |
Conclusion:
- Energy error has been decreased from -10.3% to -0.1% when improved shell element properties are given.
- During base simulation hourglass energy increases with time when compared to improved shell element property simulation is zero.
- Total energy decreases with time in base simulation where as remains constant in improved shell element property simulation.