Analysis and Comparison of 2D Shell Elements in a Crash Tube with and without recommended Shell formulation property in Radioss.
OBJECTIVE
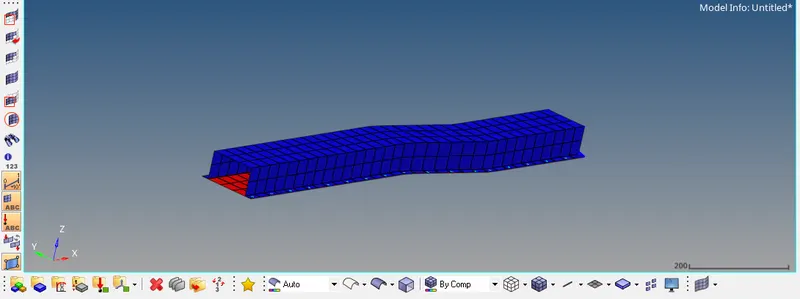
Analysis and Comparison of 2D Shell Elements in a Crash Tube with and without recommended Shell formulation property in Radioss.
PROCEDURE
Base simulation
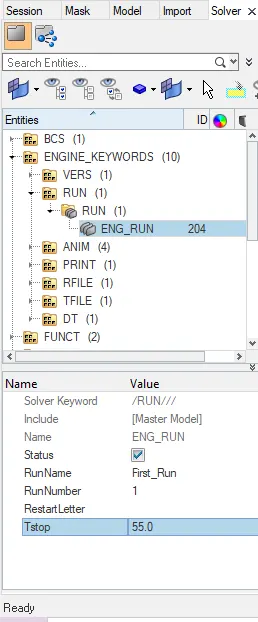
1.Use the crash beam file from the attached file and change the run time to 55 ms which is available in Solver Deck under Engine Keywords Tab.
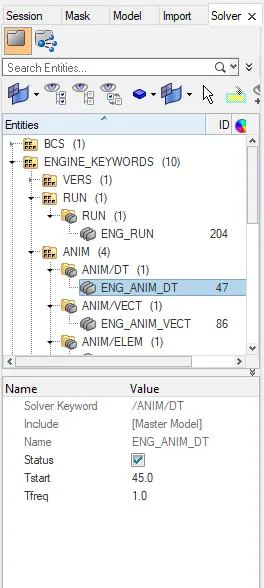
2. Change the number of animation steps during simulation to 45 which is between the required minimum of 25 and a maximum of 60. It is available in Solver Deck under Anim Tab.
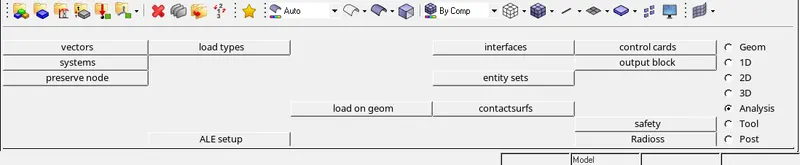
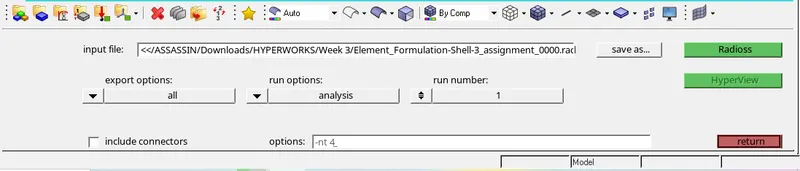
3. Run the base simulation without any modification to element properties. Select option for Export Option, Analysis for run options, and run number Should be 1.
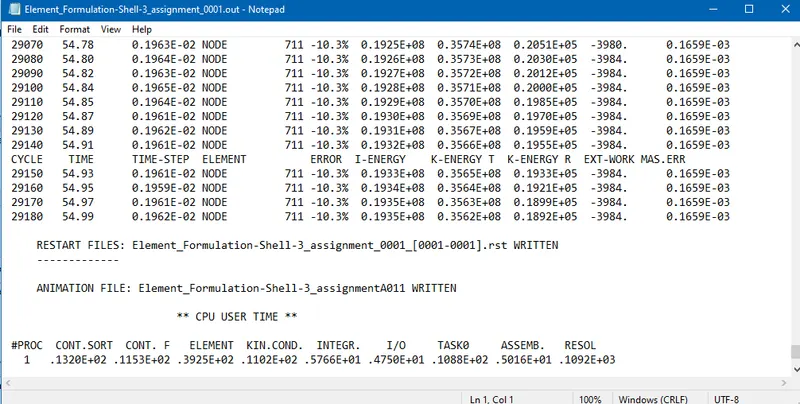
4. At the end of the simulation, do the energy error and mass error checks and determine whether the results would be acceptable. Since the Energy error% is around 10.3% and the Mass error at 0.1659E-03 we will go ahead and check the results.
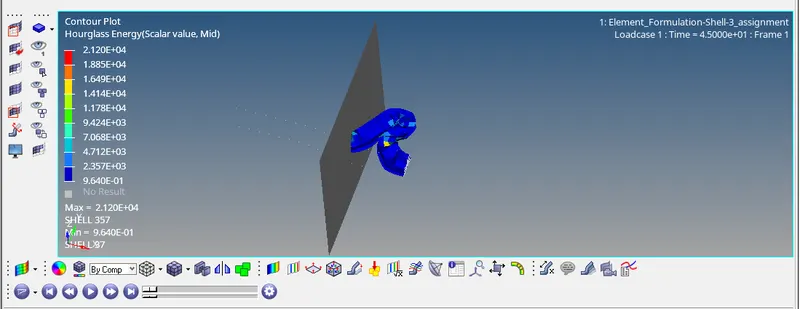
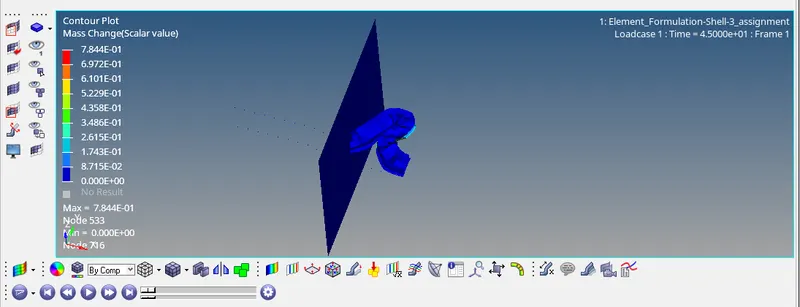
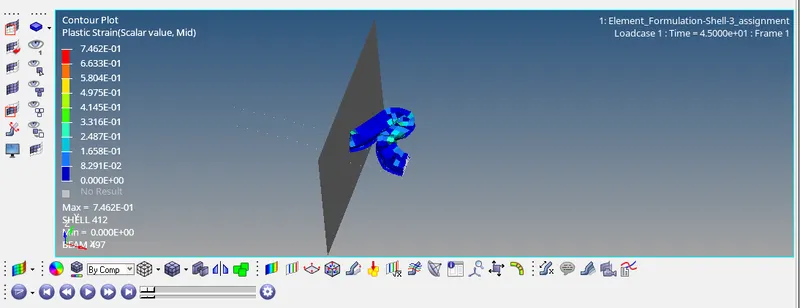
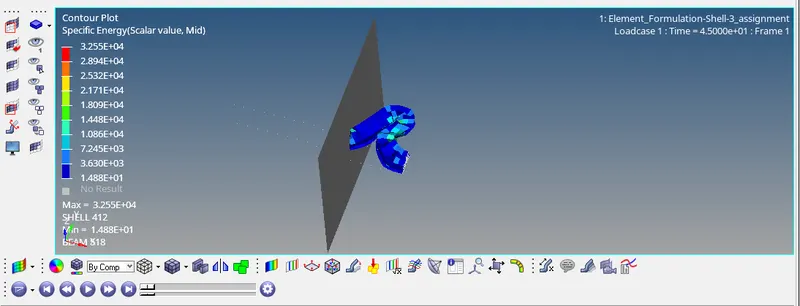
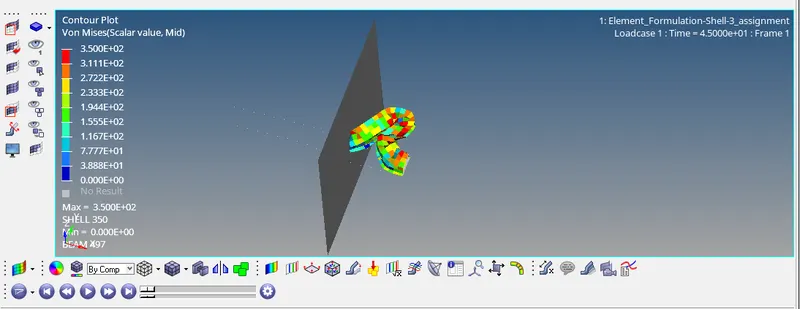
5. Now, Open Hyperview and import the .h3d file to review the results. Following are the results for hourglass, Mass change, Plastic Strain, Specific Energy, and Von Mises.
HourGlass
Mass Change
Plastic Strain
Specific Energy
Von Mises
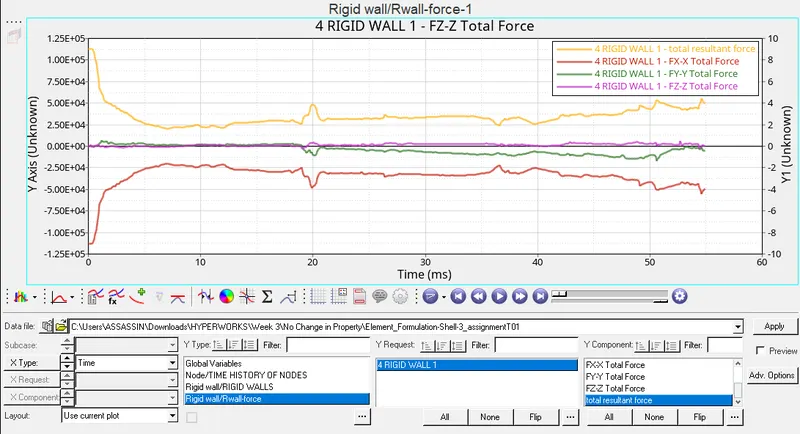
6. Open 2D Hyperview and plot 2D graphs for plots for resultant rigid wall forces, internal energy, hourglass energy, contact energy, the total energy of the simulation.
Rigid Wall Forces
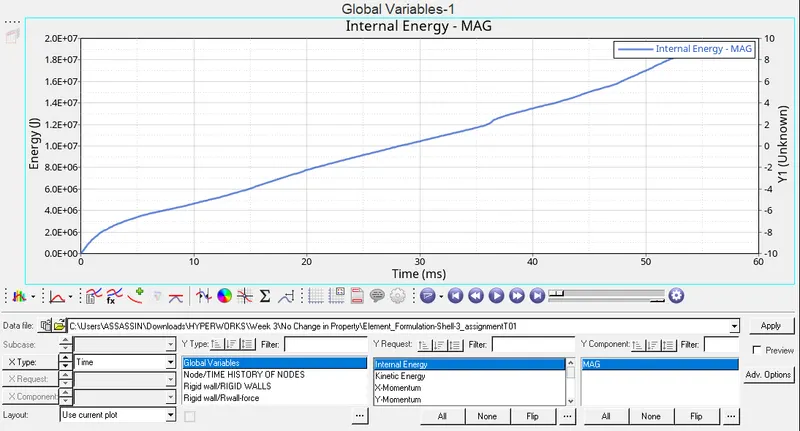
Internal Energy
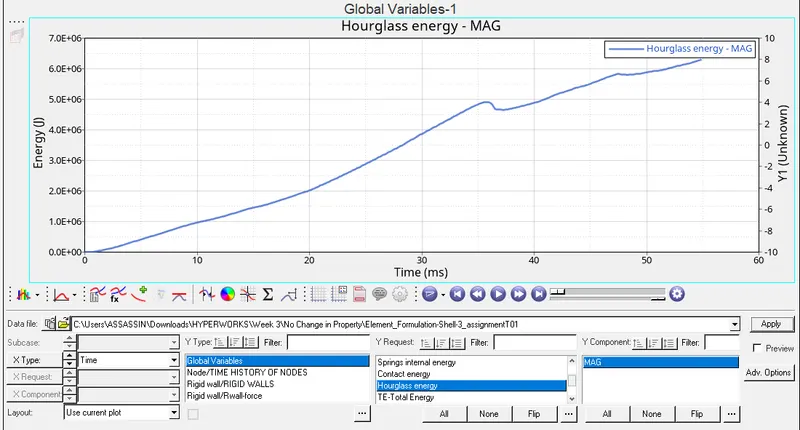
HourGlass Energy
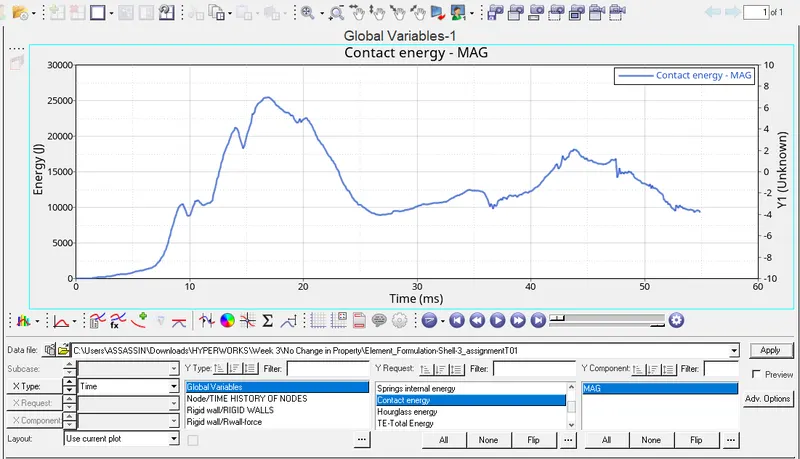
Contact Energy
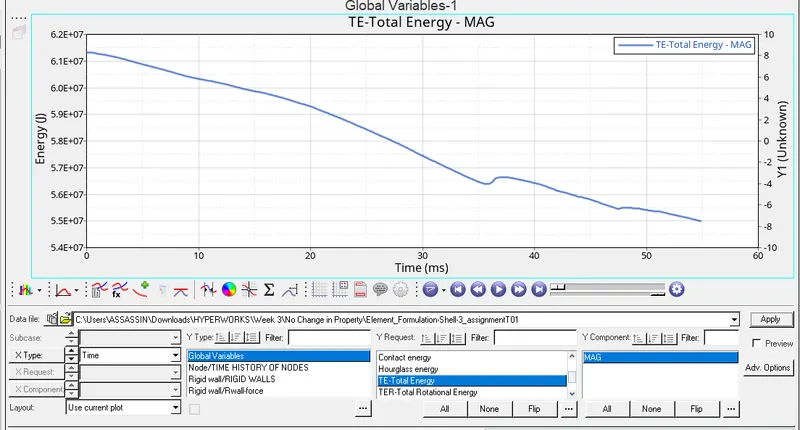
Total Energy
Simulation With Recommended Property Changes
7. We will discuss the results at a later stage. Now we will run the crash Simulation after changing the properties. But we can observe Hourglass energy which we will eliminate with the property changes in the follow-up simulation.
HourGlass Energy
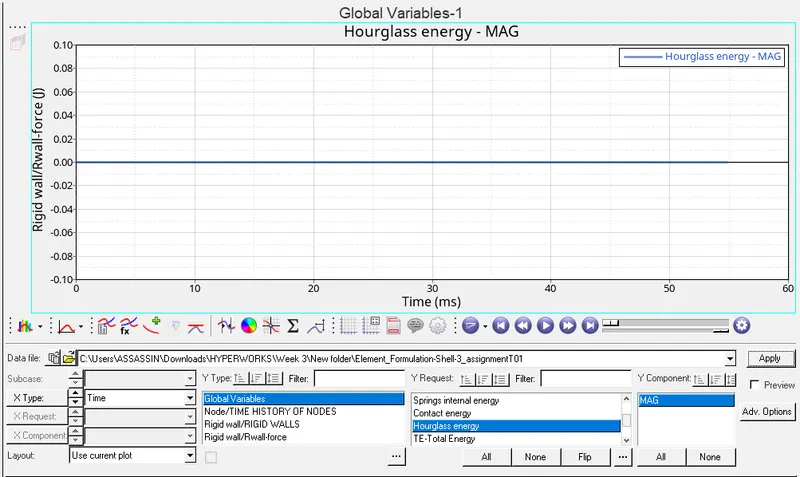
Hourglass Energy a non-physical zero-energy mode that leads to excessive element distortions. The more structured and less distorted your elements are, the better the results. In actual physical scenarios or in Experiments, this does not happen. But in FEA this happens.
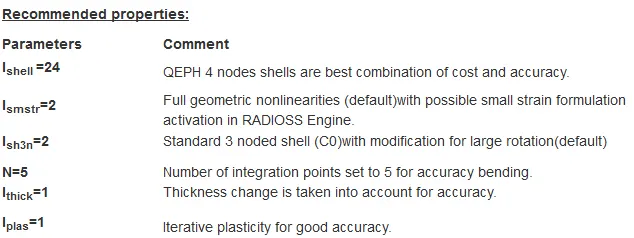
The recommended Properties can be edited under the Prop Tab available in the Model deck. We will change only those properties shown above and for only 2D shell Elements. Kindly dont edit the 1D Shell Element properties which involves Weldments.
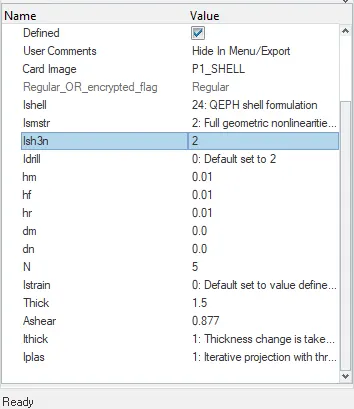
8. At the end of the simulation, do the energy error and mass error checks and determine whether the results would be acceptable. Since the Energy error% is around 0.1% and the Mass error at 0.1659E-03 we will go ahead and check the results.
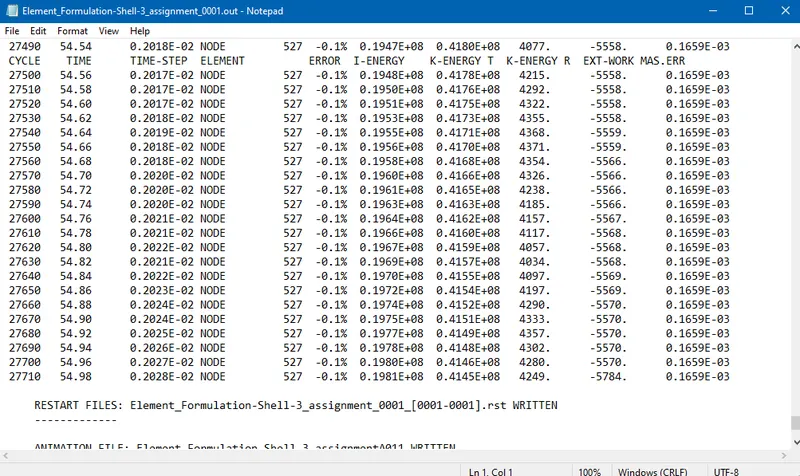
9. Now, Open Hyperview and import the .h3d file to review the results. Following are the results for hourglass, Mass change, Plastic Strain, Specific Energy, and Von Mises.
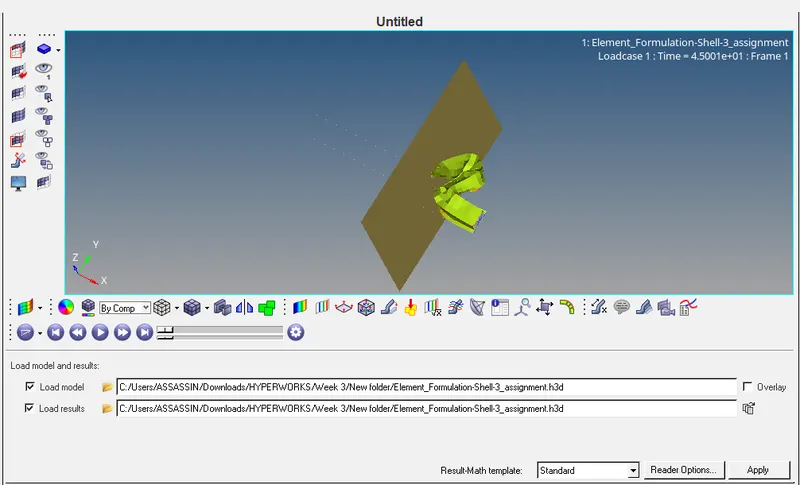
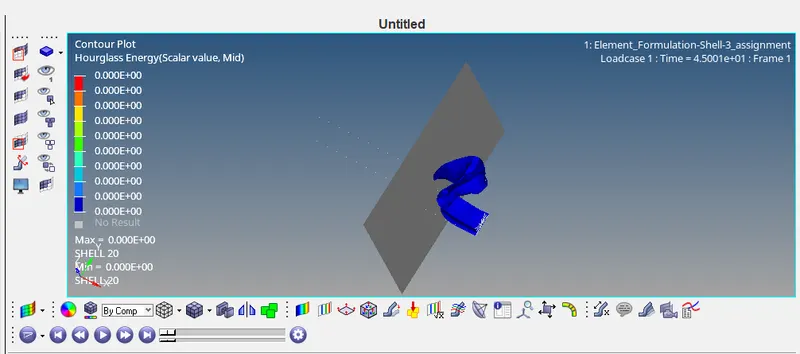
HourGlass
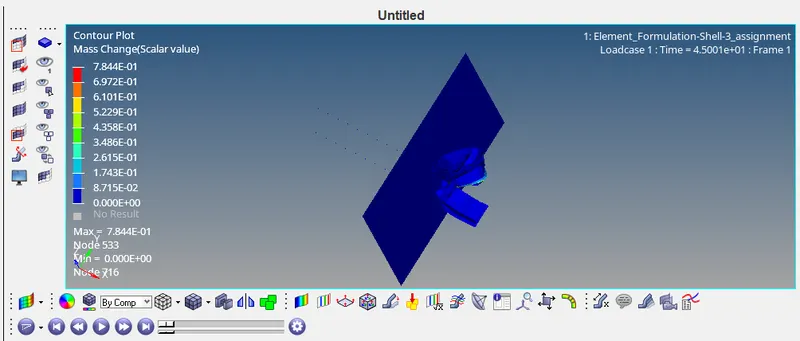
Mass Change
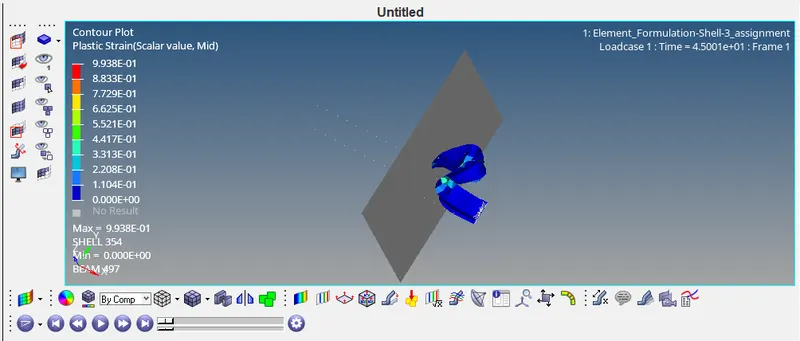
Plastic Strain
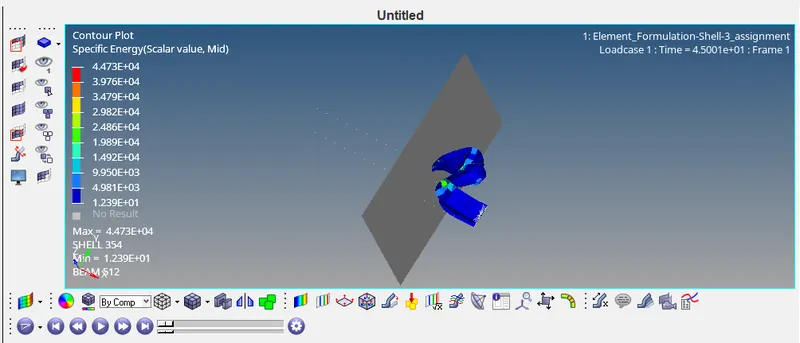
Specific Energy
Von Mises
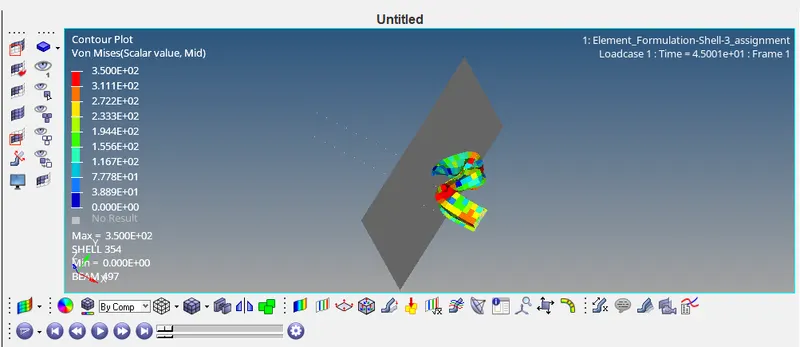
10. Open 2D Hyperview and plot 2D graphs for plots for resultant rigid wall forces, internal energy, hourglass energy, contact energy, the total energy of the simulation.
2D Hyperview Plots
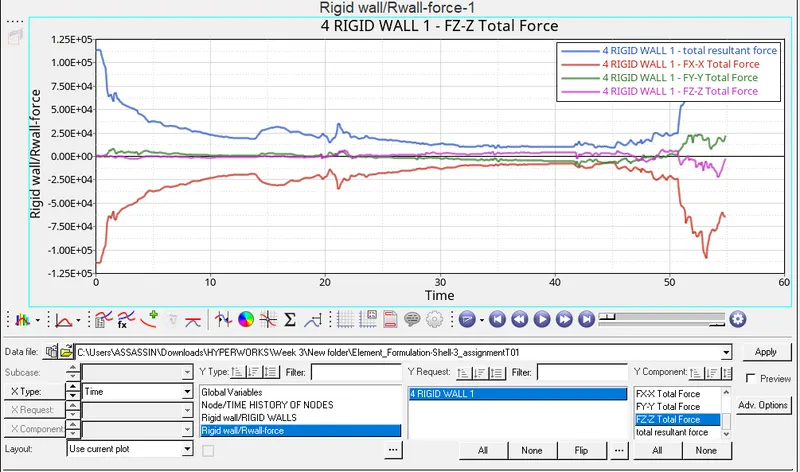
Rigid Wall Forces
Internal Energy
HourGlass Energy
Contact Energy
Total Energy
RESULT
1. No Changes in the Resultant Rigid wall forces as the same run is taking place with no boundary changes and no change in 1D element Properties.
2. Changes involving the properties of 2D Shell element has lead to the accurate stiffness of the shell elements and thus resulting in removing the hourglass effect from the base simulation giving more accurate and better results. No Hourglass Energy Observed at later simualtion comapred to the initial base simualtion.
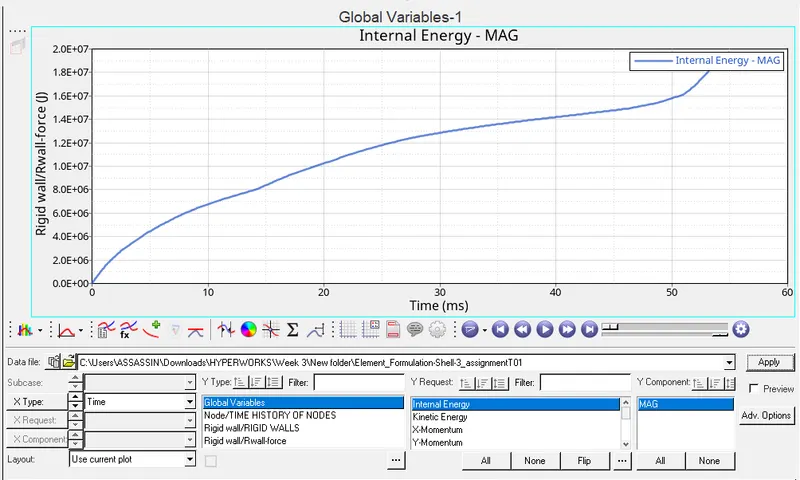
3. It can be observed that there is a slight increase in the internal energy in the second graph at intial stage for example at time = 20ms energy is approx 8E6 in graph 1 and 1e7 in graph 2 but but going towards the end of simulation the internal energy of the systems is same at 2.0 E07.
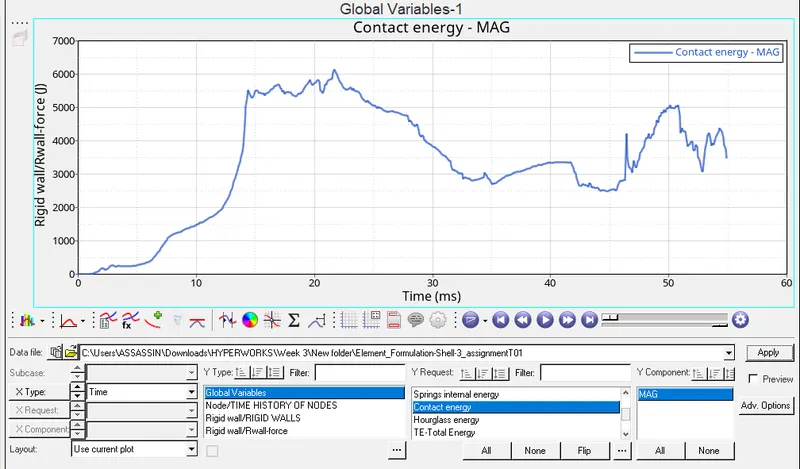
4. Even though the disipation pattern is somewhat similar for the Contact forces in both the simualtion, Contact Energy is found with greater magnitude in the inital run as compared to the later simulation which saw the elimination of the Hourglass Energy.
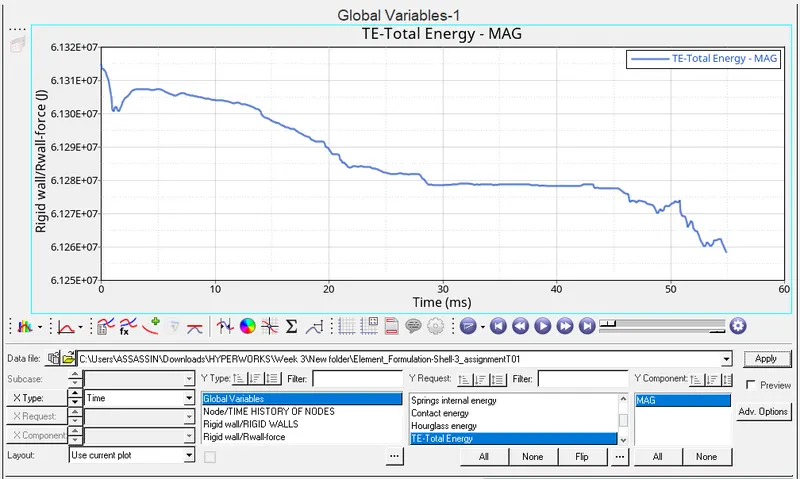
5. Comparing both the graphs for Total Energy, it can be observed that at the end of the simulation the total energy of the later simualtion is greater in comparison the initial run, due to changes made in the 2D element properties to control the hourglass energy which was available in the initial run.