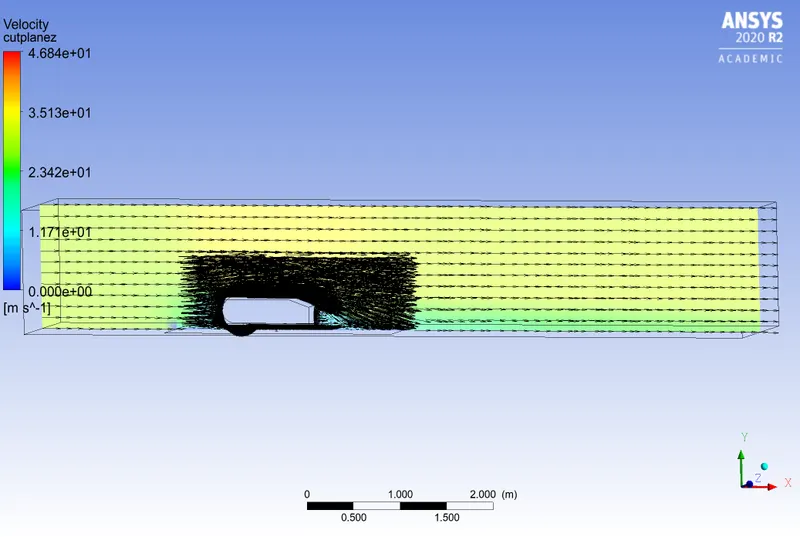
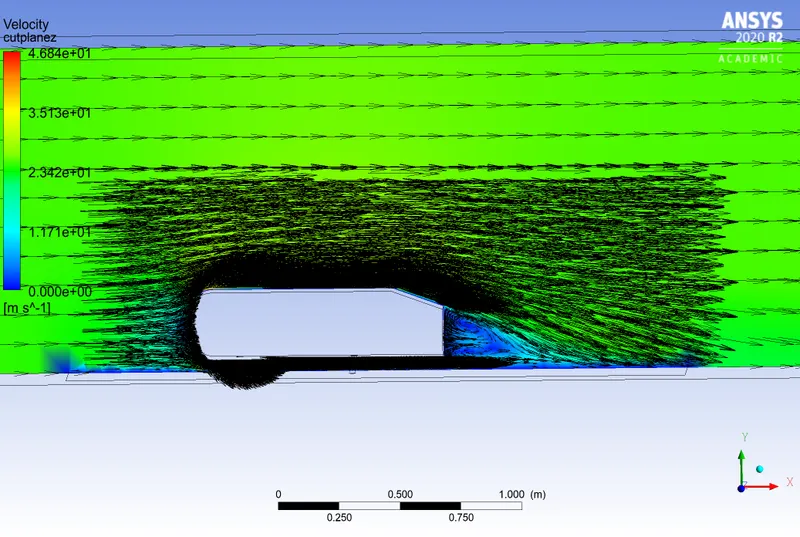
Ahmed Body Challenge
Aim:
1. Describe Ahmed's body and its importance.
2. Explain the reason for the negative pressure in the wake region.
3. Explain the significance of the point of separation.
Ahmed body:
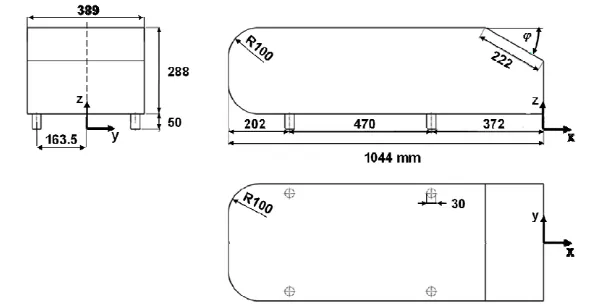
1.Ahmed body was created by S.R Ahmed in his research some salient feature of time averaged ground vechicle wake in 1984, then it became benchmark for aerodynamics
2.The airflow around the Ahmed body captures the essential flow features around an automobile and was first defined and characterized in the experimental work of Ahmed
3.Model experiments suitable for providing validation data make use of model bodies with geometries characterized by variable parameters, such as the slant angle at the back. One such body is the Ahmed body.
4. Ahmed body helps in understanding of physics of car like drag and lift forces and their coefficents.and This model is also used to describe the turbulent flow field around a car-like geometry. Once the numerical model in validated, it is used to design new models of the car
5.ANSYS is a general purpose FEA and CFD simulation software. It gives numerical prediction of the behavior of a system. These numerical predictions need to be validated by experimental data.
6. Despite the considerable deviation of its geometry from usual vehicles, the body represents the basic aerodynamic properties of a vehicle, especially in the rear part.
7.The slant angle ϕ has a strong influence on the aerodynamic drag and lift at the back. Both the drag and lift coefficients change abruptly at the angle ϕ=30°. Therefore, this angle is called the critical slant angle.
8.slantangles lessthan ϕ=12° flow remains attached over slant having less drag and slantangles bwtween ϕ=12° and 30° flow becomes 3 dimensional and angle ϕ=30° drag increases significantly as low pressure cores acts on rear surface
9.Model describes use of turbulence models like K-epsilon and K-omega
Negative pressure in wake region:
1.The wake is the region of disturbed flow (often turbulent) downstream of a solid body moving through a fluid, caused by the flow of the fluid around the body
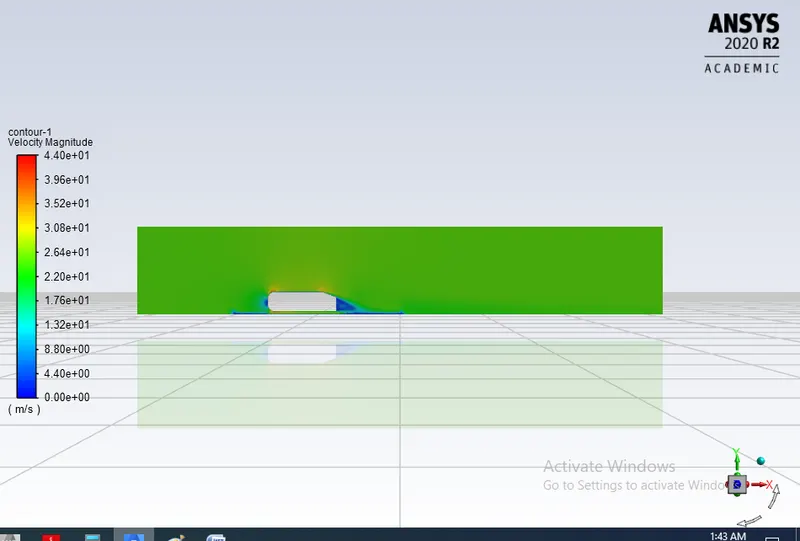
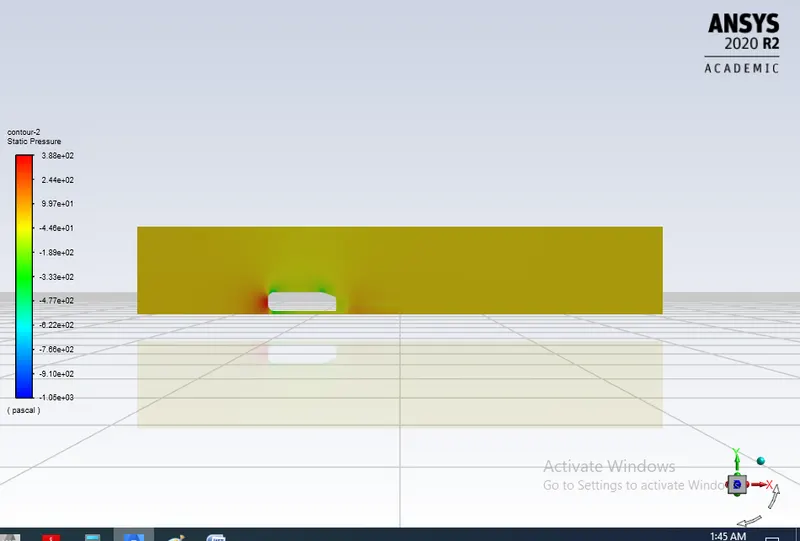
2.as enters inlet with 25m/s velocity it strikes front end of car with maximum pressure and flow get separted as above and below the car and reaching rear end and cornors of car takes neagtive pressure by creating voids.
3.wake region pressure is low Because of viscous losses, the stagnation pressure in the wake is lower than the stagnation pressure at the front of the cylinder/car. However, it has a higher pressure than the fluid that is moving outside of the wake
4.the region of a decelerated fluid that arises behind the body around which the fluid flows and extends for some distance. It is the boundary layer that has separated from the rear of the body so neagitive pressure generally takes place at rear end and cornors.
Significance of point of separation:
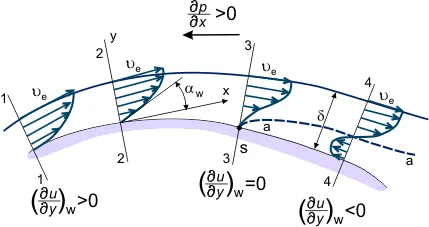
1. Flow separation is primarily caused by adverse pressure gradient imposed on the boundary layer by the outer potential flow. The streamwise momentum equation inside the boundary layer is approximately stated as
-
 .
.
2.At wall velocity reduces to zero first known as seperation point When the boundary layer separates, its remnants form a shear layer and the presence of a separated flow region between the shear layer and surface modifies the outside potential flow and pressure field. In the case of airfoils, the pressure field modification results in an increase in pressure drag and if severe enough will also result in stall and loss of lift, all of which are undesirable.
Importance of y+:
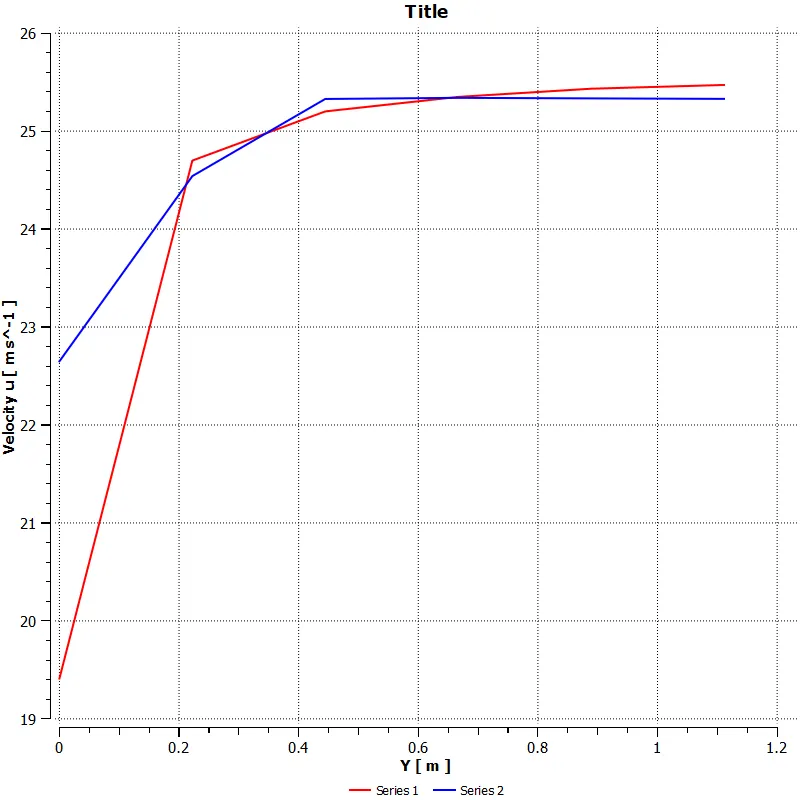
1.y+ is a non-dimensional distance. It is often used to describe how coarse or fine a mesh is for a particular flow pattern. 2.It is important in turbulence modeling to determine the proper size of the cells near domain walls. The turbulence model wall laws have restrictions on the y+ value at the wall
Wall functions :
1.Wall functions are empirical equations used to satisfy the physics of the flow in the near wall region
2. the first cell center needs to be placed in the log-law region to ensure the accuracy of the result
3.If the cell center lies in the viscous sublayer, the results from wall functions approach are very inaccurate.
Modelling approach:
Computational approach:
Three basic approaches used to solve turbulent flows are
1. Direct numerical simulation
2.Large eddy simulation
3.Reynolds averaged navier stokes equation
Reynolds averaged navier stokes equation is used widely in industries.
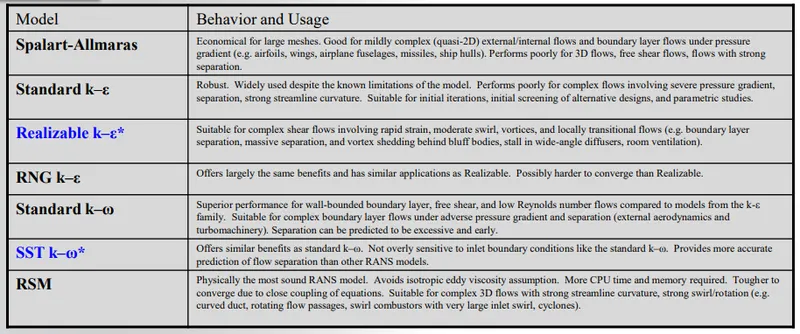
Turbulence model avilable in fluents:
One equation model: Spalart-Allmaras
Two equation model: Standard k–ε,RNG k–ε,Realizable k–ε*(RANS based
models) Standard k–ω,SST k–ω*
SST k-w and Realizable k-e are recommended choices for standard cases
RANS Turbulence model usage:
Turbulent boundary layers:
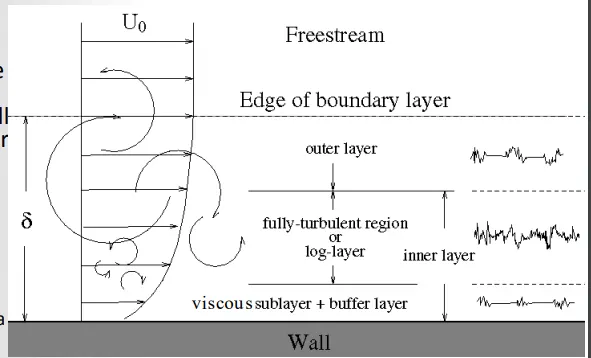
1.A turbulent boundary layerconsists of distinct regions
2. For CFD, the most important arethe viscous sublayer,immediately adjacent to the walland the log-layer, slightly furtheraway from the wall
3. Different turbulence modelsrequire different inputsdepending on whether thesimulation needs to resolve theviscous sublayer with the mesh
Boundary layer profiles:
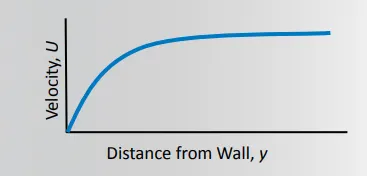
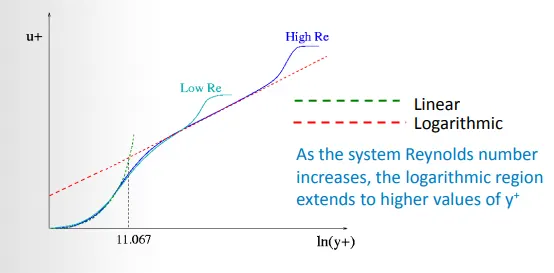
1. If we plot the same graph again, where:
2.Log scale axes are used
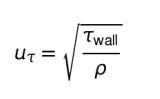
3.The velocity is made dimensionless, from U/Ut where
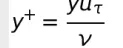
4.The wall distance is made dimensionless:
5.By scaling the variables near the wall the velocity profile data takes on apredictable form (transitioning from linear in the viscous sublayer tologarithmic behavior in the log-layer)
Wall Modeling Strategies
In the near-wall region, the solution gradients are very high,:
1. To locate the first cell in the log-layer, it should typically have a y+ value such that 30 < y
+ < 300
2. This is a very general guideline - for very high Re, y+ can be higher if still in log layer and for very low Re, the log-layer may not extend far enough away from the wall for the use of wall functions to be valid
3. Wall functions should never be used if y+ < 30
Resolving the Viscous Sublayer
1.First grid cell needs to be at about y+≈ 1 and a prism layer mesh with growth rate no higher than ≈ 1.2 should be used
2. mesh will be able to adequately resolve gradients in thesublayer This will add significantly to the mesh count
3. aerodynamic drag,turbomachinery blade performance, heat transfer this is the approach you will take and the recommended turbulencemodel for most cases is SST k-w
Calculating Wall Distance for a Given y+
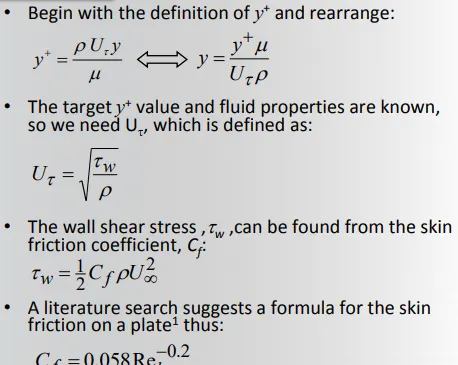
turbulence flow calculation in Fluent
1. Decide on a near-wall modeling strategy
2.The choices are A) Resolve the viscous sublayer or B) Use wall functions
3.Create the mesh with y+suitable for the selected approach
4.Choose turbulence model and near wall treatment (if necessary) in the Viscous Models
5.Realizable k-e or SST k-w are recommended choices for standard cases
6.SST k-w is preferred for cases where the viscous sublayer needs to be resolved
K-omega:
1.This model is essentially a low Reynolds number model.This model takes 'elliptic' near wall behavior meaning that it has an in herent nature of being able to"communicate with the wall and actually has Dirchlet boundary conditons.
2.Commonly encountered situations where the flow demand integrating through the viscous sub layer include:heat transfer,calculation of aerodynamicdrag,flows with adverse pressure gradients,etc.Integrating through the viscous sub layer would generally impose resolving the mesh to y+<1.The omega equation can be integrated through the viscous sublayer without the need for a two-layer approach.
3.Once the first layer thickness is calculated using the y+ formula,we can generate the mesh and setup the case for the first few iteratons or tirne steps.
4.Once we run the simulation for a few time steps or iteration,it is desirable to check the y+value using the post-processing
K-epsilon:
1.This model is essentially a high Reynolds number model,meaning the law of the wall must be employed and provide velocity "boundaryconditions"away from soid boundaries (whatistermed"wall-functons")
2.This model is usually used where flow does not demand to integrate the soluton viscous sublayer and wall-bounded effects are secondary.
3.For such cases,the first cell away from the wall shall be placed at a y+of30-30O.
procedure:
Geometry:
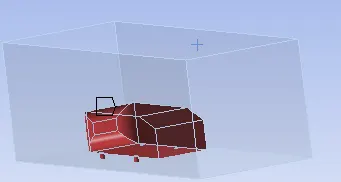
1.Ahmed body dropped to fluent and then created enclosure with required dimensions as shown
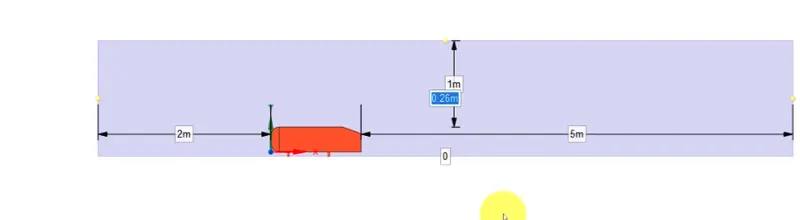
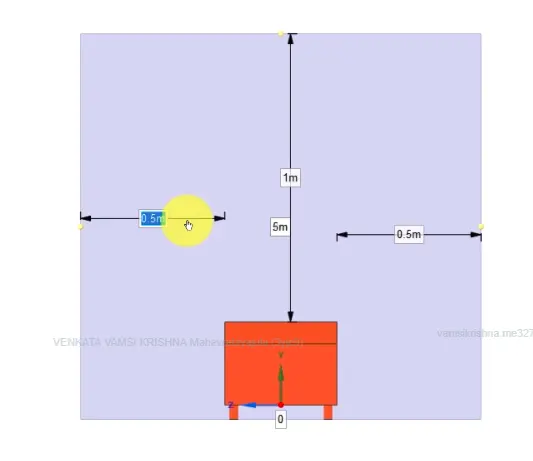
2.Enclosure is done inorder to simulate flow outside ahmed body
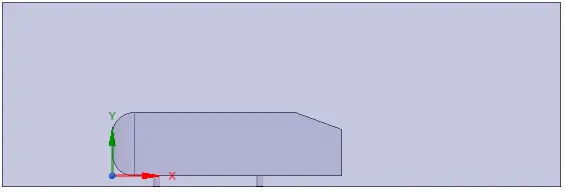
3. For refining mesh quality draw box/apply enclousre and type dimensions based on base line setup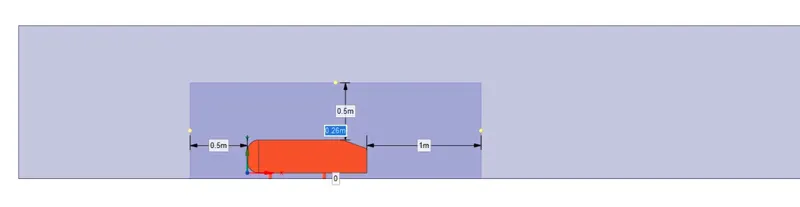
4. Check overlapping of meshes by using interference shows overlapping of meshing takes place
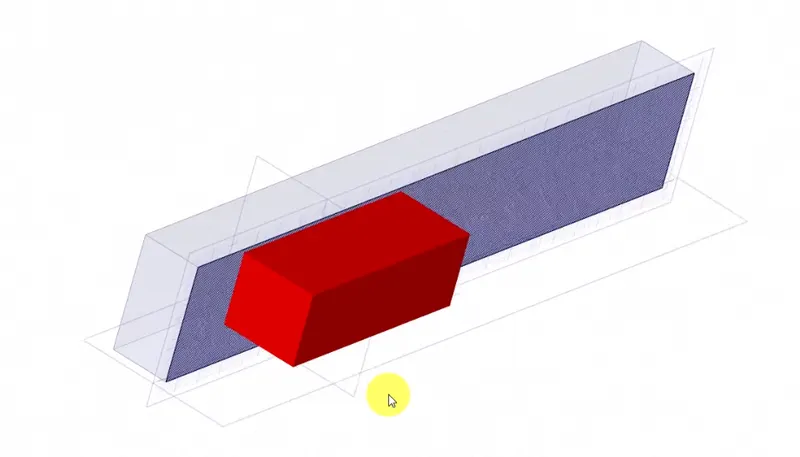
5.check interference click ok it shows non overlapping of mesh
Meshing:
Named selections:
1.Inlet
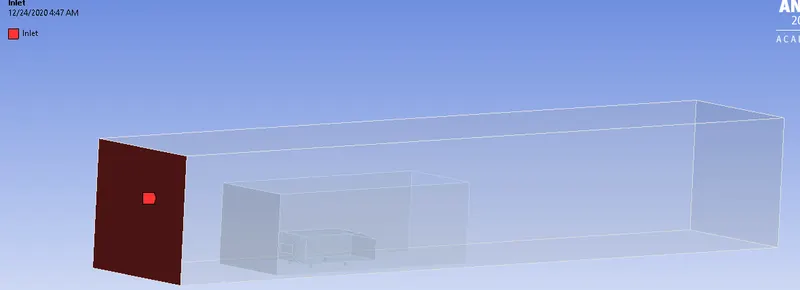
2.outlet
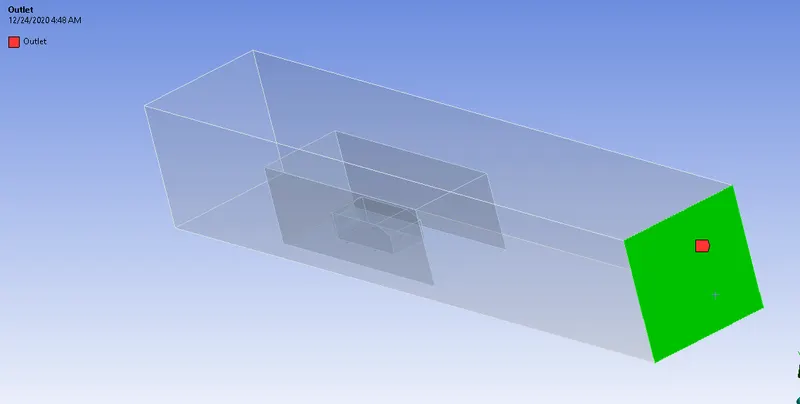
3.Symmetry.(4 Faces)
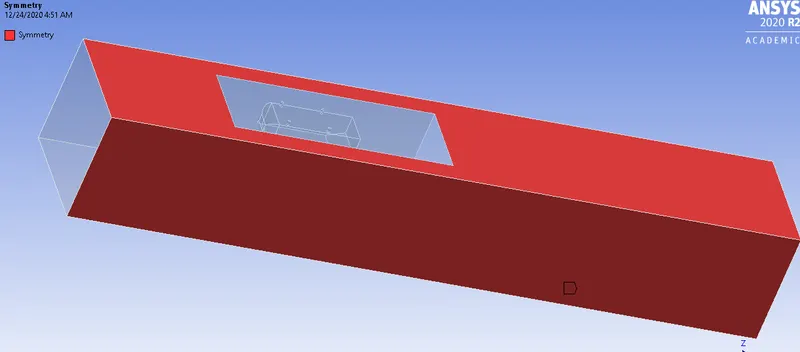
4.Car wall
5. click on mesh elemnt size=100mm and max size=100mm
6. Click on mesh - method- body sizing- select outer body- multizone then generate mesh shows hexa mesh

7. Click on mesh - sizing-element size=50mm- body sizing- select interior body- then generate mesh
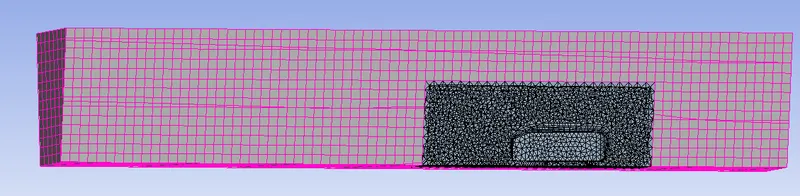
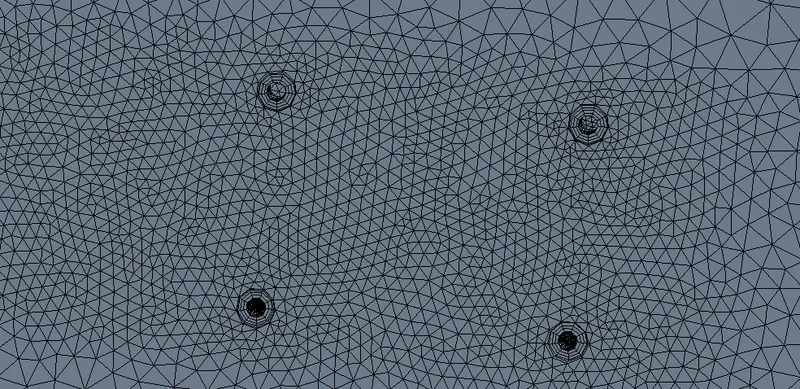
8. Click on mesh - sizing-element size=10mm- Face sizing- select carwall- then generate mesh
9. Click on mesh - sizing-element size=5mm- Face sizing- select carwall four faces at bottom- then generate mesh
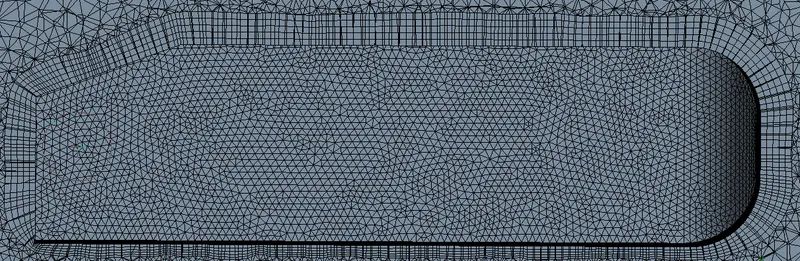
10.Inflation -select car change-Y+ value from(50,100,150) -no of layers=5-generate
Grid dependence test:
|
Element size |
Y values |
No of elements |
Total Thickness |
|
100 |
50 |
445944 |
103.68 |
|
100 |
100 |
496711 |
207.36 |
|
125 |
150 |
388360 |
311.04 |
Refining test:
1) y=50
2) y=100
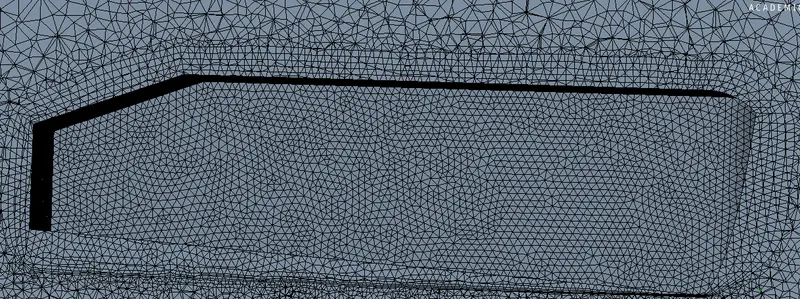
3) y=150
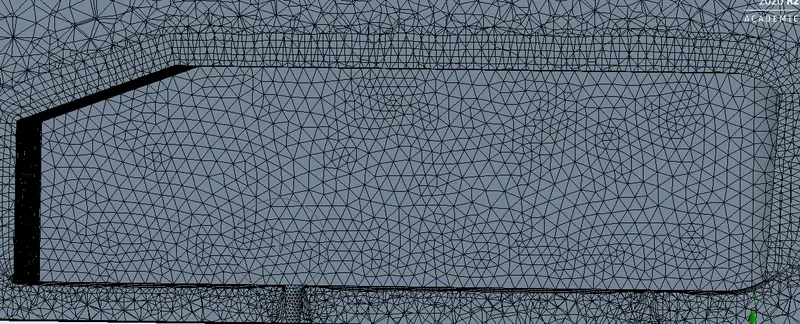
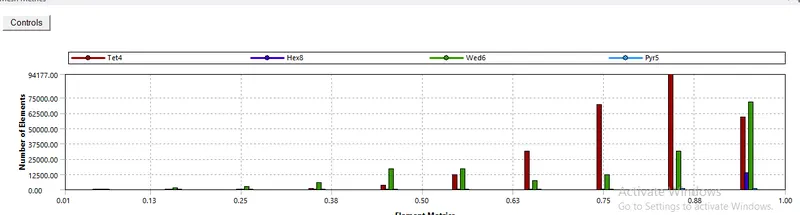
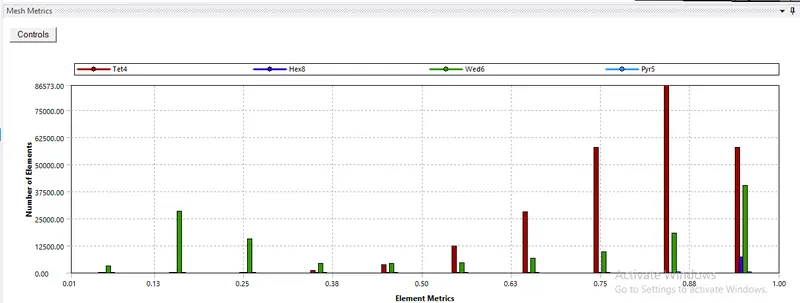
Quality check:
Y=50
y=100
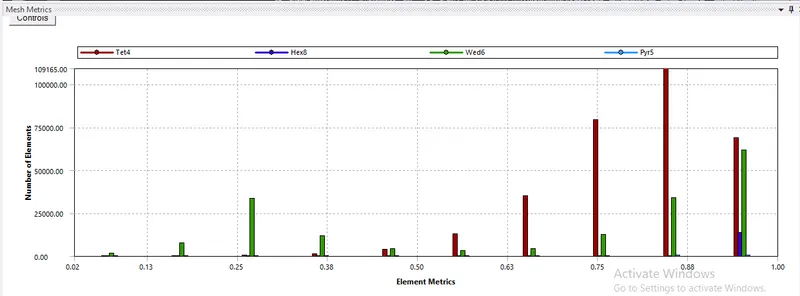
y=150
Setup:
1)General
Type: Pressure-based
Time: steady
Velocity formulation: Absolute
2D Space : Planar
2)Models:
Viscous: Turbulent k-epsilon standard
3)Materials(air)
4)Cell zone conditions: Fluid(air)
4)Boundary conditions: inlet velocity=25m/s
5) Create monitor plane normal to x-axis with co-ordinates (0,0,0) and (0,0,1)
6) Next from report definations use force report for caliculation of Lift,drag
7)Method : Use standard method
caliculation of cd and cl values for various Y+ values.
1.Y=50

2.Y=100
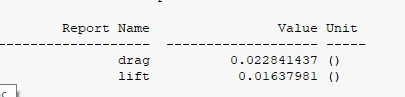
3.Y=150
Contours
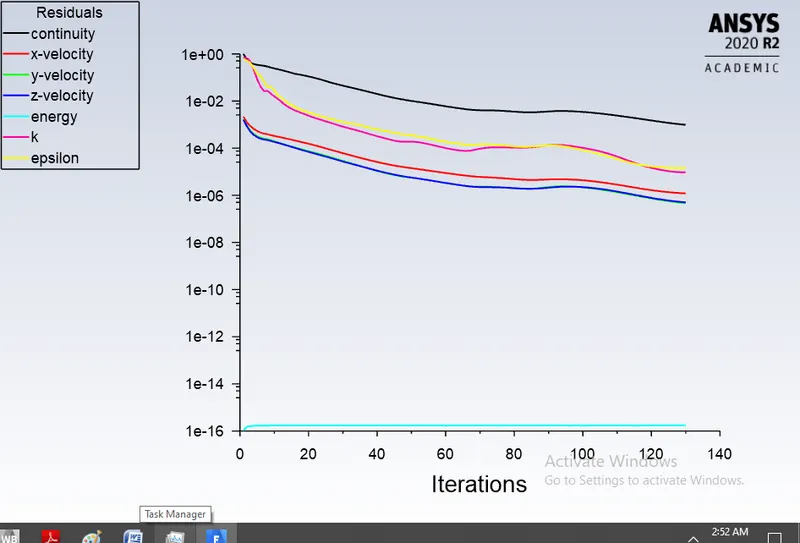
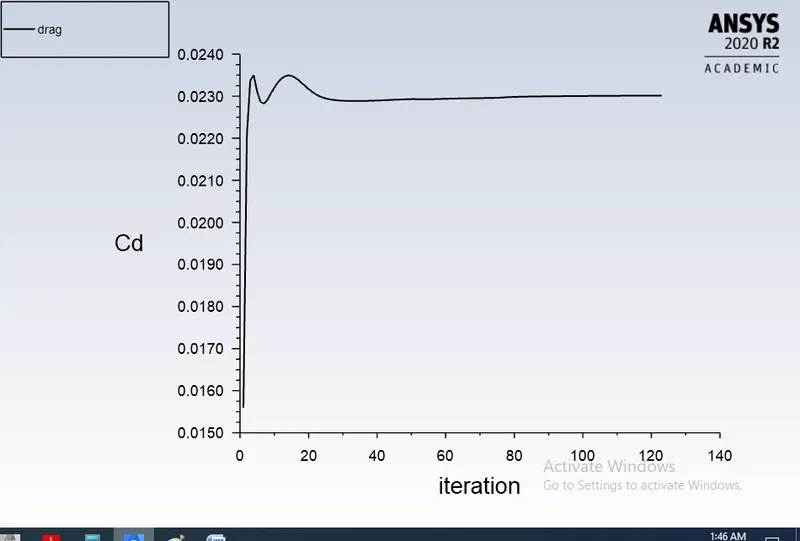
1.Y=50
Residuals
Cd (Coefficent of drag)
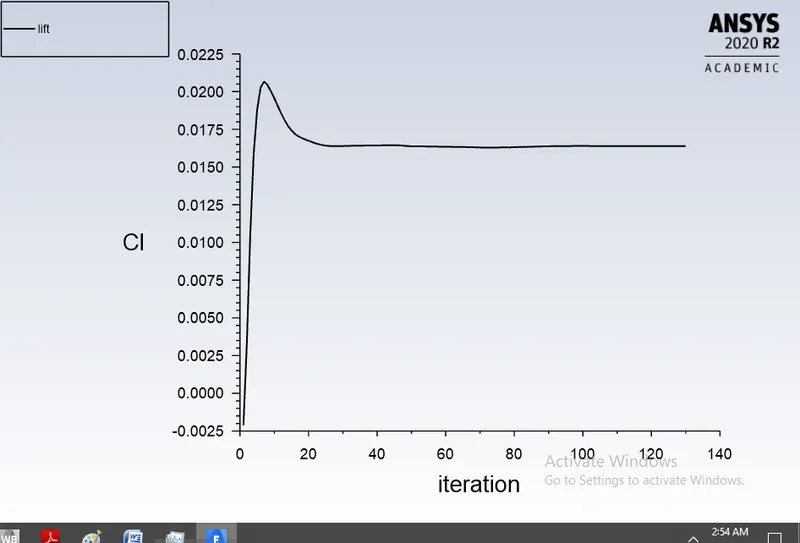
Cl (Coefficient of lift)
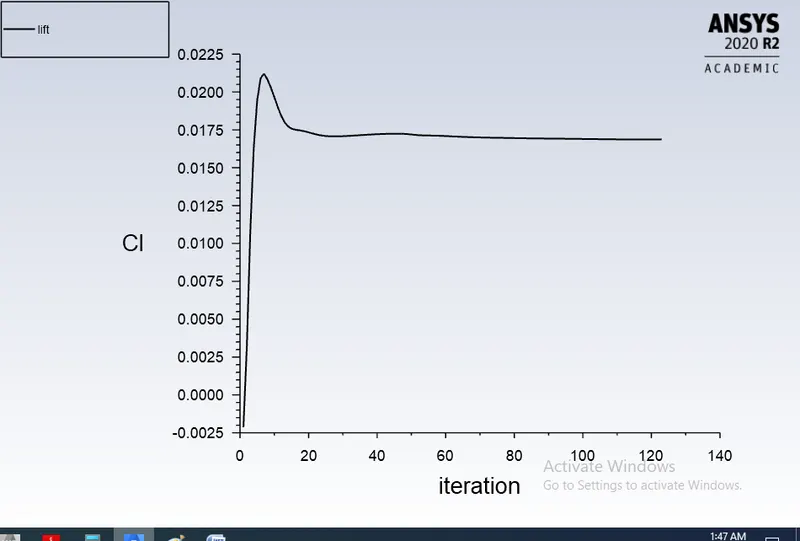
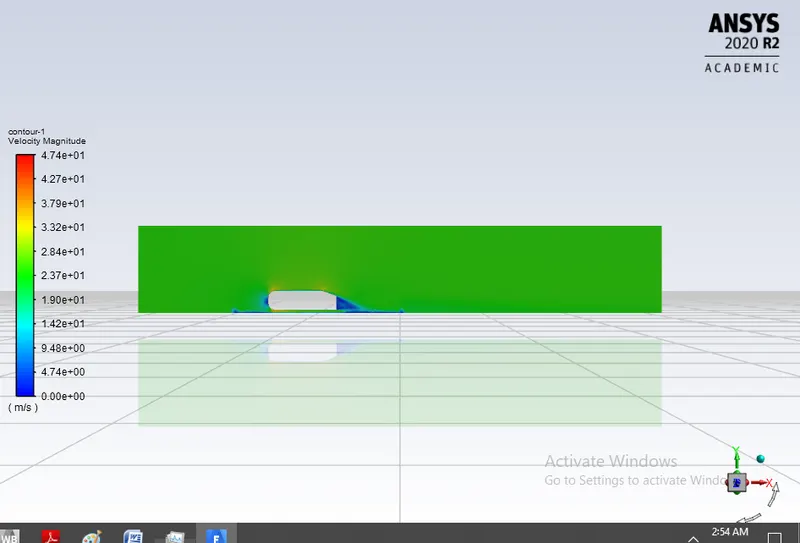
Velocity contour:
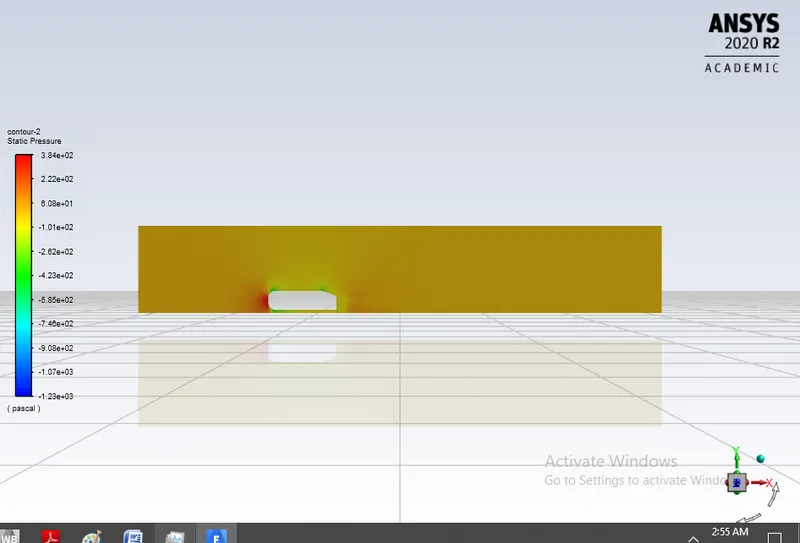
Pressure contour:
2.Y=100
Residuals
Cd (Coefficent of drag)
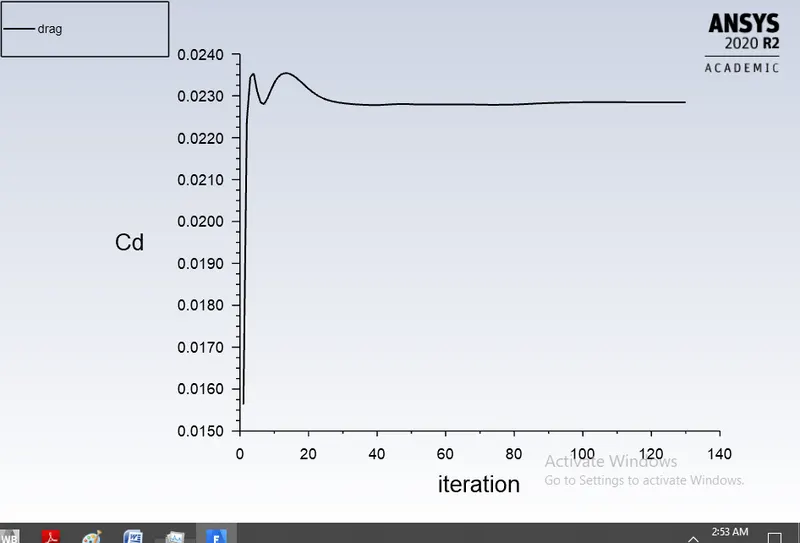
Cl (Coefficient of lift)
Velocity contour:
Pressure contour:
3.Y=150
Residuals
Cd (Coefficent of drag)
Cl (Coefficient of lift)
Velocity contour:
Pressure contour:
Post processing:
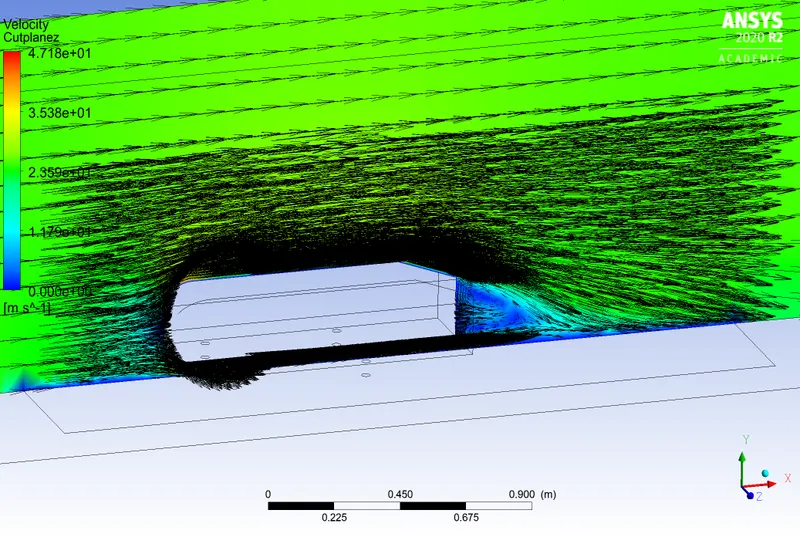
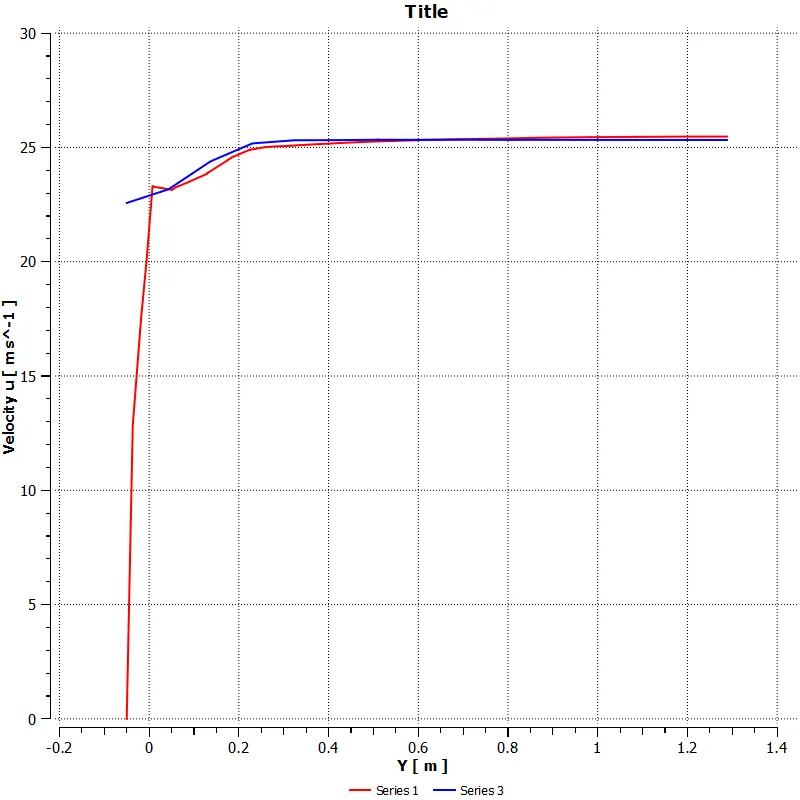
Y=50
Velocity wake region
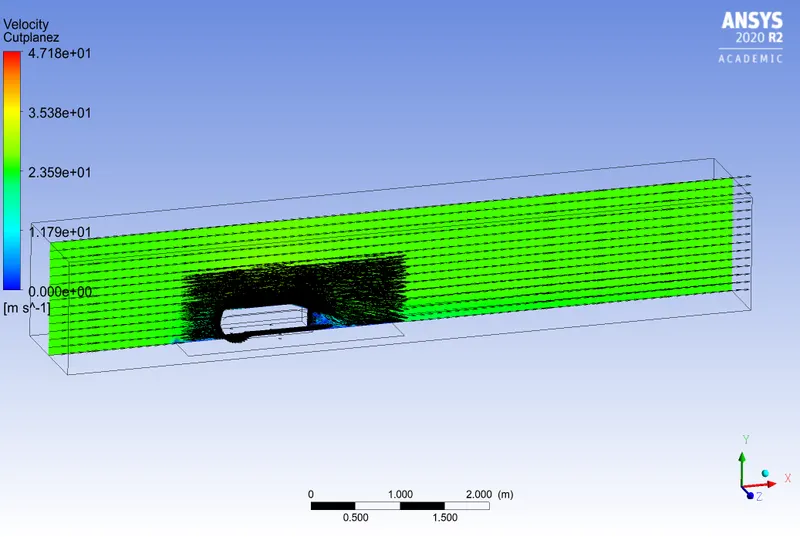
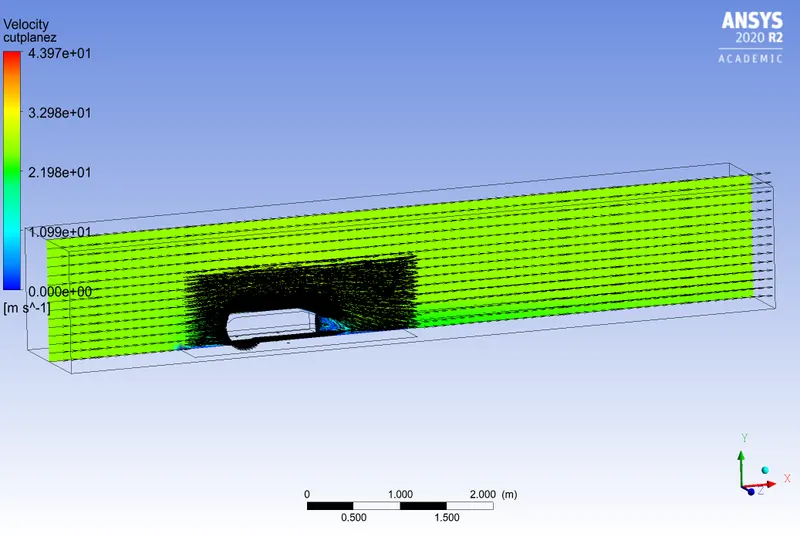
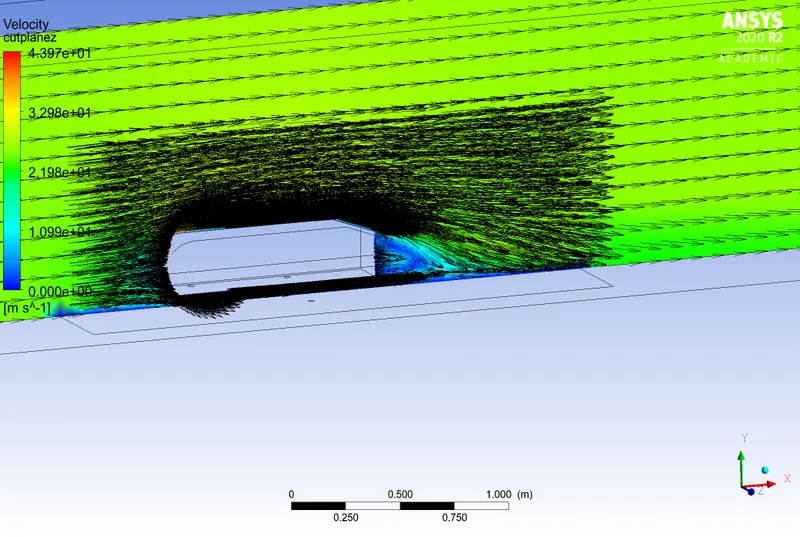
Y=100
Velocity wake region
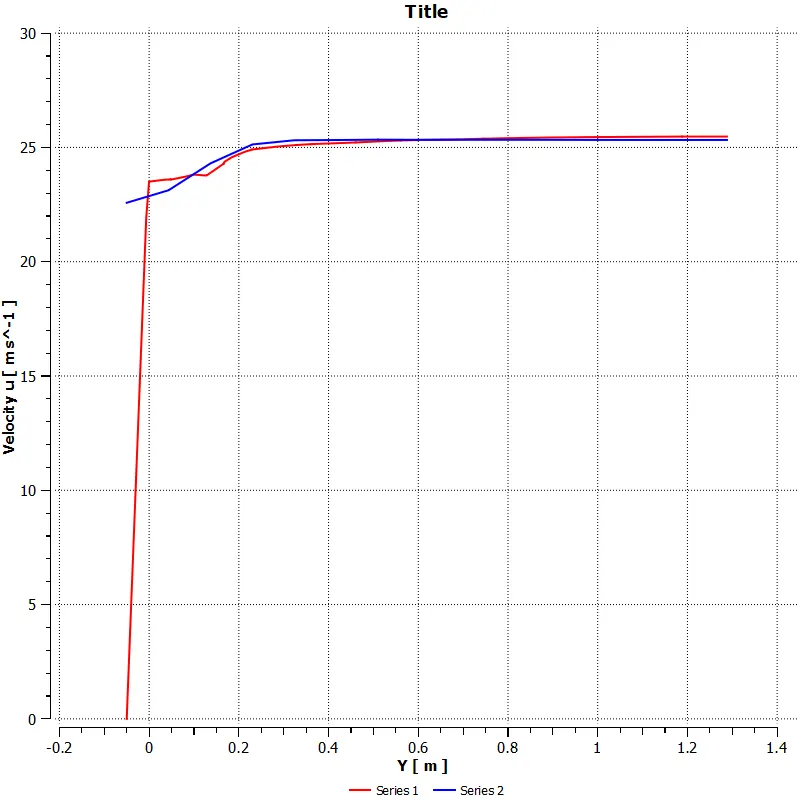
Y=150
Velocity wake region