Mechanical Engineering Jobs in India: October 2026 JobSpeak Breakdown
Naukri's JobSpeak index rose 14% in October 2026, with auto hiring up 36% and heavy machinery 32%. Here is what the data shows for core engineering industries, roles, cities and freshers, and how much of the jump is last year's Diwali base effect.

In short
- Naukri's JobSpeak index of white-collar hiring was 2,836 in October 2026, up 14% from 2,480 in October 2025. The report came out on 3 November 2026.
- Core engineering sectors led. Auto and auto ancillary rose 36% and industrial products and heavy machinery 32%. ANI and IANS reported that hiring for production and manufacturing roles grew 39% across all industries.
- Part of that is a base effect. Diwali and Dussehra both fell in October 2025 and dragged that month down 9%. Against October 2024, overall hiring is up only about 4%, auto about 17% and heavy machinery about 11%.
- Auto is the strongest engineering signal. Its index held near its highs from July to October 2026, while overall hiring fell 7% from September to October.
Mechanical and automotive engineering hiring in India grew faster than the overall job market in October 2026. Naukri's JobSpeak index, a monthly measure of new white-collar job postings on Naukri.com, rose 14% year on year. Auto hiring rose 36%, heavy machinery 32%, and production and manufacturing roles 39% across industries. The honest reading is smaller but still positive: against October 2024, auto is up about 17% and heavy machinery about 11%. Overall white-collar hiring is up only about 4% over the same two years.
This article breaks the October 2026 data down for core engineering: industries, roles, cities, and freshers versus experienced engineers. It also covers the base-effect and methodology caveats that most headlines skipped. All charts are drawn from the index values in Naukri's own October 2025 and October 2026 reports.
What did the October 2026 Naukri JobSpeak report say?
Naukri, the job site run by Info Edge, publishes JobSpeak early each month. The index tracks new job postings and recruiter searches on Naukri's resume database. July 2008 is the base month, with an index value of 1,000. The current methodology says the index draws on more than 1.5 lakh clients and over 80 lakh new job mandates a year. It does not count gig work, hyperlocal hiring or campus placements.
The October 2026 report's headline numbers:
- Overall index: 2,836, against 2,480 in October 2025 (+14%) and 3,053 in September 2026.
- Industries: auto +36%, BPO/ITES +17%, banking +16%, oil and gas +9%, IT software services +5%. Education fell 16% and insurance 3%.
- Skills and employer types: AI/ML roles +32%, global capability centres (GCCs, the in-house tech and engineering centres of multinationals) +18%.
- Experience: 0-3 years of experience +15%; the two most senior bands (13-15 and 16+ years) +22% each.
Naukri itself flagged the catch on its chart: "a soft festive base from last October lifted the headline number". Info Edge MD and CEO Hitesh Oberoi said: "Some of October's growth reflects last year's festive-season base, and we should read it in that light." He also said that manufacturing companies are building capacity.
Why is the 14% growth partly a base effect?
A year-on-year growth rate compares one month with the same month a year earlier. If that earlier month was unusually weak, the growth rate looks better than the real trend. That is a base effect.
October 2025 was unusually weak. Naukri's October 2025 report showed the index falling 9% to 2,480. Naukri blamed Diwali and Dussehra both falling in that month, when recruiters post fewer jobs. It estimated that, adjusted for the holidays, the underlying trend was about +3%. So October 2026 is being compared with a month that had two major festivals in it.
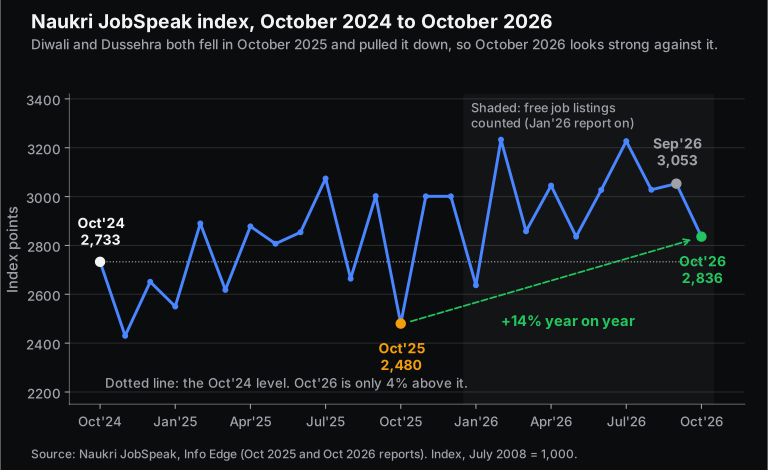
Here are four ways to read the overall index with the base effect stripped out. All four are calculated from Naukri's published index values:
| Comparison | Change | What it tells you |
|---|---|---|
| October 2026 vs October 2025 (the headline) | +14.4% | Flattered by the festive-hit 2025 base |
| October 2026 vs October 2024 (two years) | +3.8% | Skips the weak base entirely |
| September + October 2026 vs the same two months of 2025 | +7.4% | Smooths the festival timing over two months |
| Nov 2025-Oct 2026 vs Nov 2024-Oct 2025 (12-month totals) | +8.8% | The broad one-year trend |
There is a second caveat. From its January 2026 report onwards, Naukri's methodology note says the index now includes free job listings. It says this is causing a "transient uplift" because more small and medium businesses are posting jobs, and it expects that to normalise. Earlier months were not revised: October 2025 reads 2,480 in both the 2025 and 2026 reports. So every year-on-year comparison in 2026, including the two-year one, may be inflated a little by the new free listings. Naukri does not say by how much.
Neither caveat means hiring is weak. Both mean the 14% is an upper bound. A 12-month trend of about 9% is a more realistic reading for white-collar hiring overall.
Which engineering industries are hiring most?
JobSpeak publishes a separate index for each industry. The engineering-heavy ones are below, ranked by year-on-year growth. The two-year column compares October 2026 with October 2024, which skips the festive-hit base. Each industry has its own index, so compare the percentage changes, not the index levels.
| Industry (Naukri's category) | Oct 2024 | Oct 2025 | Oct 2026 | 1-year change | 2-year change |
|---|---|---|---|---|---|
| Consumer durables | 849 | 732 | 1,118 | +53% | +32% |
| Auto / auto ancillary | 1,243 | 1,066 | 1,455 | +36% | +17% |
| Industrial products / heavy machinery | 1,586 | 1,331 | 1,759 | +32% | +11% |
| Electricals / switchgear | 1,817 | 1,607 | 2,014 | +25% | +11% |
| Construction / engineering / cement / metals | 1,192 | 1,092 | 1,308 | +20% | +10% |
| Chemicals / petrochemical / plastic / rubber | 1,759 | 1,585 | 1,889 | +19% | +7% |
| Shipping / marine | 1,159 | 864 | 1,022 | +18% | -12% |
| Steel | 1,763 | 1,538 | 1,746 | +14% | -1% |
| Aviation / aerospace firms | 1,139 | 797 | 901 | +13% | -21% |
| Semiconductors / electronics | 5,065 | 4,461 | 4,954 | +11% | -2% |
| Oil and gas / power / infrastructure / energy | 731 | 628 | 682 | +9% | -7% |
| Medical devices / equipment | 1,396 | 1,414 | 1,533 | +8% | +10% |
| IT software / software services (for reference) | 3,487 | 2,967 | 3,119 | +5% | -11% |
| All white-collar hiring | 2,733 | 2,480 | 2,836 | +14% | +4% |
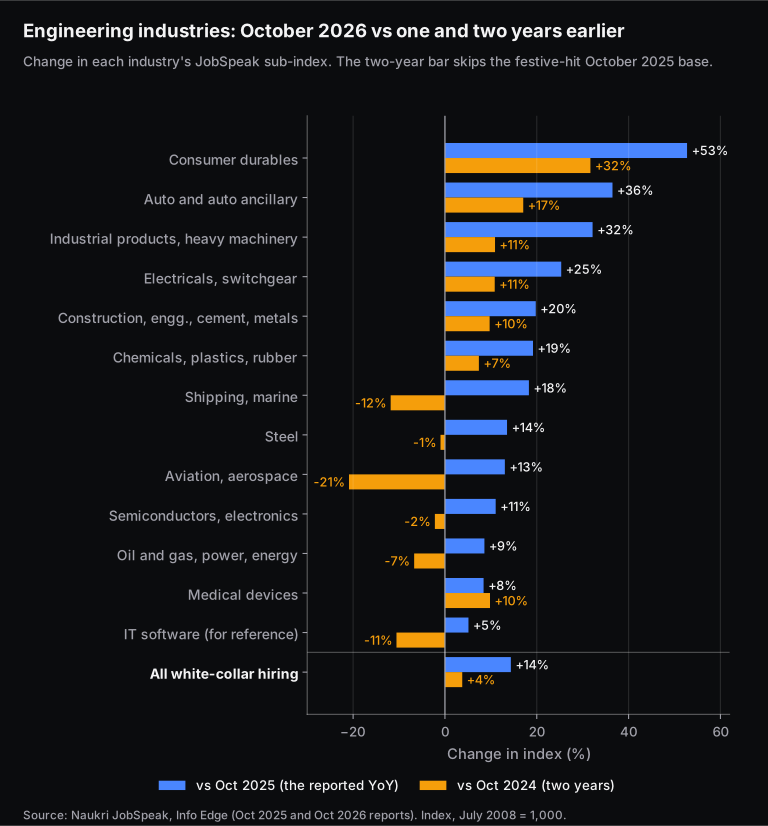
Three groups stand out:
- Clearly growing on both measures: consumer durables (home appliances and electronics), auto, heavy machinery, electricals, and construction and metals. Each is up about 10% or more over two years, well ahead of the 4% for all hiring.
- Recovering, not yet back: shipping, aviation and aerospace, oil and gas, semiconductors and electronics, and steel. Each posted one-year growth of 9% to 18% but is still below October 2024. Aviation and aerospace is the starkest: +13% in a year but -21% over two.
- Steady: medical devices is the only engineering industry here whose two-year change (+10%) beats its one-year change (+8%). It did not dip in October 2025, when its index rose 1%.
Is auto hiring really growing, or is it just the base effect?
Auto is the clearest real signal in this report, for three reasons.
First, the two-year change is +17%, about four times the overall market's +4%. Second, the auto index has held at a high level for four months. It was 1,460 in July, 1,457 in August, 1,495 in September and 1,455 in October 2026. Third, auto held up in October 2026 itself. Its index slipped 3% from September, while the overall index fell 7%. Remember that Dussehra fell on 20 October this year, so October 2026 was not festival-free either.
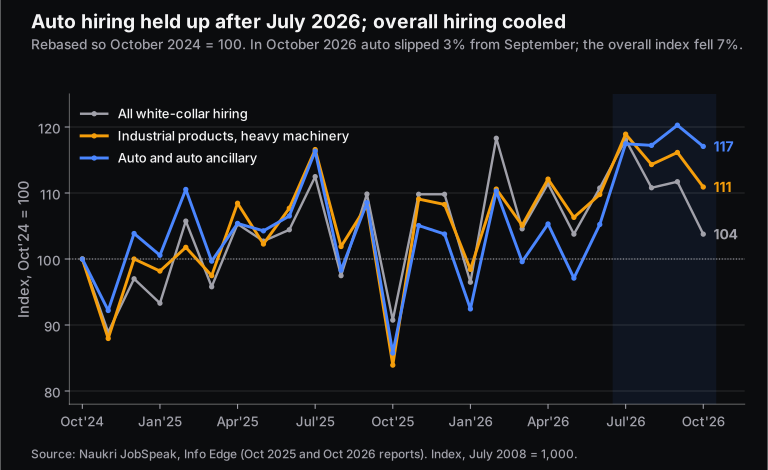
The longer view is more modest. Add up all 12 months from November 2025 to October 2026 and the auto index is only about 5% above the previous 12 months. Most of auto's gain came from July 2026 onwards: the August-October total is about 21% higher than a year earlier. That is a recent upswing, not a long boom. One weak month would change the picture.
Within auto, Naukri said southern cities drove the growth: Bengaluru +50%, Hyderabad +44% and Chennai +34% year on year. If you follow vehicle demand, our October 2026 EV sales breakdown covers the retail side of the same month.
Heavy machinery tells a similar but weaker story. It is +32% on the year and +11% over two years. Over 12 months it is up about 9%, in line with the overall market, and it fell 5% from September to October.
Which engineering roles are in demand: production, quality or R&D?
The industry index tells you which employers are posting jobs. Role (function) data tells you what kind of work they are hiring for. Naukri's published deck does not include role-level numbers. The figures below come from news-agency reports of Naukri's release on 3 November 2026. ANI and IANS both reported the all-industry, auto and heavy machinery figures. The construction figures are from ANI's report.
| Industry | Role (function) | Year-on-year change, Oct 2026 |
|---|---|---|
| All industries | Production and manufacturing | +39% |
| Auto / auto ancillary | Research and development | +53% |
| Procurement and supply chain | +50% | |
| Production and manufacturing | +41% | |
| Sales and business development | +7% | |
| Industrial products / heavy machinery | Quality assurance | +41% |
| Production | +40% | |
| Construction / engineering / cement / metals | Production | +33% |
| Project and programme management | +25% | |
| Site engineering | +20% |
The pattern is consistent. The engineering functions (R&D, production, quality and supply chain) grew several times faster than sales inside the same auto employers. That is consistent with Oberoi's comment that manufacturers are building capacity.
Two cautions. These role figures are one-year changes against the same weak October 2025 base, and no two-year version has been published. They also come from wire copy of Naukri's release, not from the deck itself.
Which cities are hiring engineers?
Among the big metros, Hyderabad (+15%), Pune (+14%) and Delhi-NCR (+13%) led on the year. The larger moves were in smaller industrial cities, especially in Gujarat. Gandhinagar rose 48%, Surat 36%, Vadodara 30% and Ahmedabad 23%. The two-year view sorts the real gains from the rebounds:
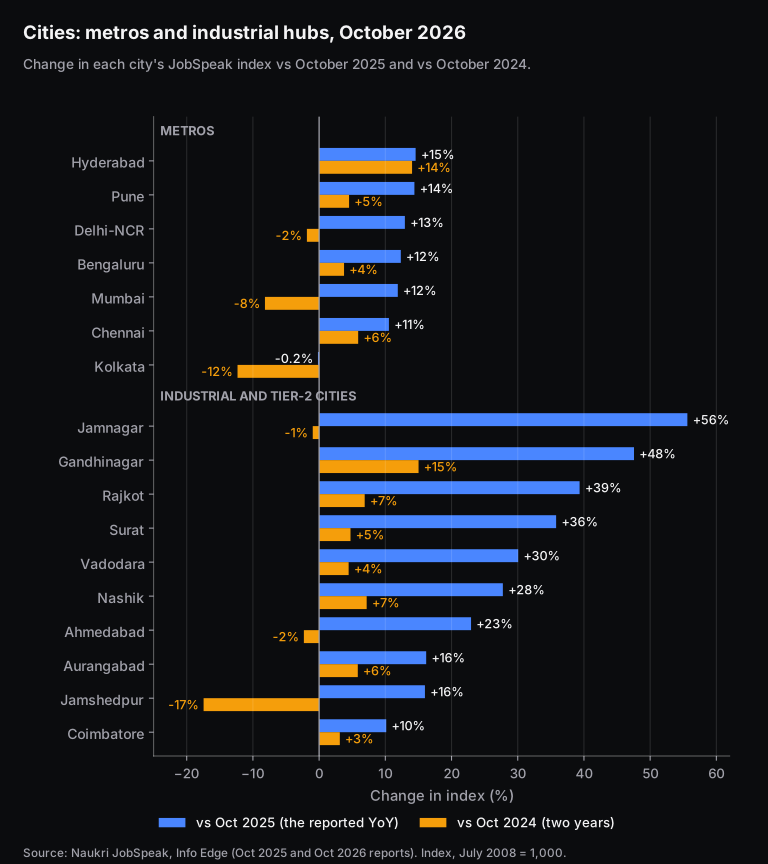
- Real gains: Hyderabad is up 14% over two years and Gandhinagar 15%. Bharuch in Gujarat, not in the chart, is also up 14% over two years (and +29% on the year).
- Modest gains: Pune, Chennai, Bengaluru, Nashik, Rajkot, Aurangabad, Surat, Vadodara and Coimbatore are up between 3% and 7% over two years. That is roughly in line with the overall market.
- Rebounds that have not fully recovered: Jamnagar, Ahmedabad, Delhi-NCR, Mumbai, Jamshedpur and Kolkata. Jamshedpur rose 16% on the year but is 17% below October 2024.
City indices count all white-collar jobs, not just engineering ones. A rising city index tells you employers there are posting more jobs. It does not tell you how many of those jobs are for mechanical engineers.
Is hiring growing for freshers or for experienced engineers?
JobSpeak splits hiring by years of experience. It publishes only the percentage change for each band, not index values, so the two-year figures below are approximate. Each one compounds the two rounded yearly changes.
| Experience | Oct 2025 vs Oct 2024 | Oct 2026 vs Oct 2025 | Approx. two-year change |
|---|---|---|---|
| 0-3 years (freshers and juniors) | -7% | +15% | about +7% |
| 4-7 years | -11% | +11% | about -1% |
| 8-12 years | -9% | +14% | about +4% |
| 13-15 years | -6% | +22% | about +15% |
| 16+ years | -8% | +22% | about +12% |
Senior hiring grew fastest. Naukri said auto and FMCG drove the 16+ years band. The 4-7 year band, the typical mid-level design or production engineer, is roughly flat over two years. Fresher hiring is up about 7% over two years. Naukri said non-IT sectors such as banking and oil and gas drove it, and named Vadodara (+37%) and Ahmedabad (+33%) as fresher hiring hotspots.
One limitation matters for final-year students. JobSpeak excludes campus placements. The fresher numbers reflect off-campus jobs posted on Naukri, not how many engineers were placed on campus.
What does this mean for mechanical, automotive and EV engineers?
The data supports some practical conclusions. It does not guarantee anyone a job or a particular salary.
- Manufacturing-side roles have the momentum. Production, quality assurance, supply chain and R&D posted the fastest role growth. If you are choosing between a design-only and a plant-facing profile, plant skills matter right now. That means process planning, tolerance stack-ups, inspection and root-cause analysis. Our guide to GD&T symbols covers the drawing language that quality and production roles use every day. For a structured route into plant-side design, see Skill-Lync's Post Graduate Program in Manufacturing Design.
- Auto is the strongest employer group, but it is a recent upswing. Treat the July-October 2026 run as a good window, not a permanent state. The two-year +17% is the number to remember, not the headline +36%.
- EV work sits inside "auto" in this data. JobSpeak has no separate EV category, so no EV-specific hiring number exists here. The 53% growth in auto R&D roles is the closest proxy, but it covers all powertrains.
- Look beyond the metros. Gandhinagar, Bharuch, Rajkot, Surat, Nashik, Pune, Chennai and Hyderabad are all up over two years, while Mumbai, Delhi-NCR and Kolkata are still below October 2024. Being willing to work at a plant location widens your options.
- Several engineering industries are still below 2024 levels. In aerospace, shipping, oil and gas, steel and semiconductors, one good month is not a recovery yet.
If you are mapping out which path fits you, our overview of career options after mechanical engineering compares the main tracks and the skills each one asks for.
What should you watch in the November 2026 report?
The base effect is about to flip. Diwali fell in October in 2025, but it falls on 8 November in 2026, according to the central government holiday list. November 2025 was a strong month: the index jumped to 3,001, up 23% year on year. So November 2026 will be compared with a strong month and will contain Diwali itself. A weak year-on-year number for November would not, on its own, mean hiring has turned down.
Naukri dealt with the same problem last year by also reporting combined October-November growth. For 2025 that was +6%. The October-November 2026 combined figure will be the fairest single number to judge the festive season by. The November report should come out in early December 2026. We will look at whether auto stays near its recent levels and whether the free-listings uplift starts to fade.
Frequently asked questions
What is the Naukri JobSpeak index?
It is a monthly index of white-collar hiring activity in India, built from new job postings and recruiter searches on Naukri.com. July 2008 = 1,000. From the January 2026 report onwards, its methodology note says it also counts free job listings. It excludes gig work, hyperlocal hiring and campus placements, and it measures posting activity, not completed hires.
Did mechanical engineering jobs increase in India in October 2026?
Postings in the industries that employ most mechanical engineers rose. Auto was up 36% year on year, heavy machinery 32% and construction and metals 20%, and production and manufacturing roles were reported up 39%. Against October 2024, the gains are smaller: about 17%, 11% and 10% for those three industries. JobSpeak does not publish a separate "mechanical engineering" category.
Why did white-collar hiring grow 14% in October 2026?
Partly because October 2025 was weak. Diwali and Dussehra both fell in that month, and the index fell 9%. Against October 2024 the overall index is up only about 4%. Naukri's CEO said the growth should be read in the light of last year's festive base. He also pointed to real capacity building by manufacturers and strong demand for AI skills.
Which cities had the most growth in engineering-sector hiring?
JobSpeak's city figures cover all white-collar jobs. In October 2026 the biggest yearly jumps were in Gujarat: Jamnagar +56%, Gandhinagar +48% and Surat +36%. Over two years, Gandhinagar (+15%), Hyderabad (+14%) and Bharuch (+14%) show the strongest lasting gains. For auto specifically, Naukri named Bengaluru, Hyderabad and Chennai.
Is fresher hiring improving for engineers?
Hiring for people with 0-3 years of experience rose 15% year on year in October 2026, after a 7% fall a year earlier. That works out to roughly +7% over two years. These figures exclude campus placements, and they are not split by branch of engineering.
When is the next JobSpeak report?
Naukri usually publishes JobSpeak in the first few days of the following month, so the November 2026 report should come out in early December 2026. Diwali falls on 8 November 2026, so expect the festive effect to show up in November this time.
Sources and further reading
- Naukri / Info Edge, Naukri JobSpeak, October 2026 (released 3 November 2026): overall and industry index series, city annexure, experience bands, methodology, Hitesh Oberoi quote.
- Naukri / Info Edge, Naukri JobSpeak, October 2025 (31 October 2025): October 2024-October 2025 index values, festive-clustering explanation, experience bands.
- Naukri / Info Edge, Naukri JobSpeak, November 2025: combined October-November 2025 growth of 6%.
- Naukri / Info Edge, Naukri JobSpeak archive: monthly reports, including the December 2025 and January-April 2026 methodology pages (free-listings note).
- ANI via NewKerala, India's white-collar hiring rises 14% in October, manufacturing leads (3 November 2026): role-level growth figures.
- IANS via Investment Guru India, India's white-collar hiring up 14 pc in Oct on manufacturing push (3 November 2026): role-level growth figures.
- Staffing Industry Analysts, India's white-collar hiring jumps 14% in October; auto sector leads (3 November 2026).
- Department of Personnel and Training, Holidays to be observed in Central Government Offices during 2026, O.M. F.No.12/2/2023-JCA, 3 July 2025 (Dussehra 20 October, Diwali 8 November 2026).