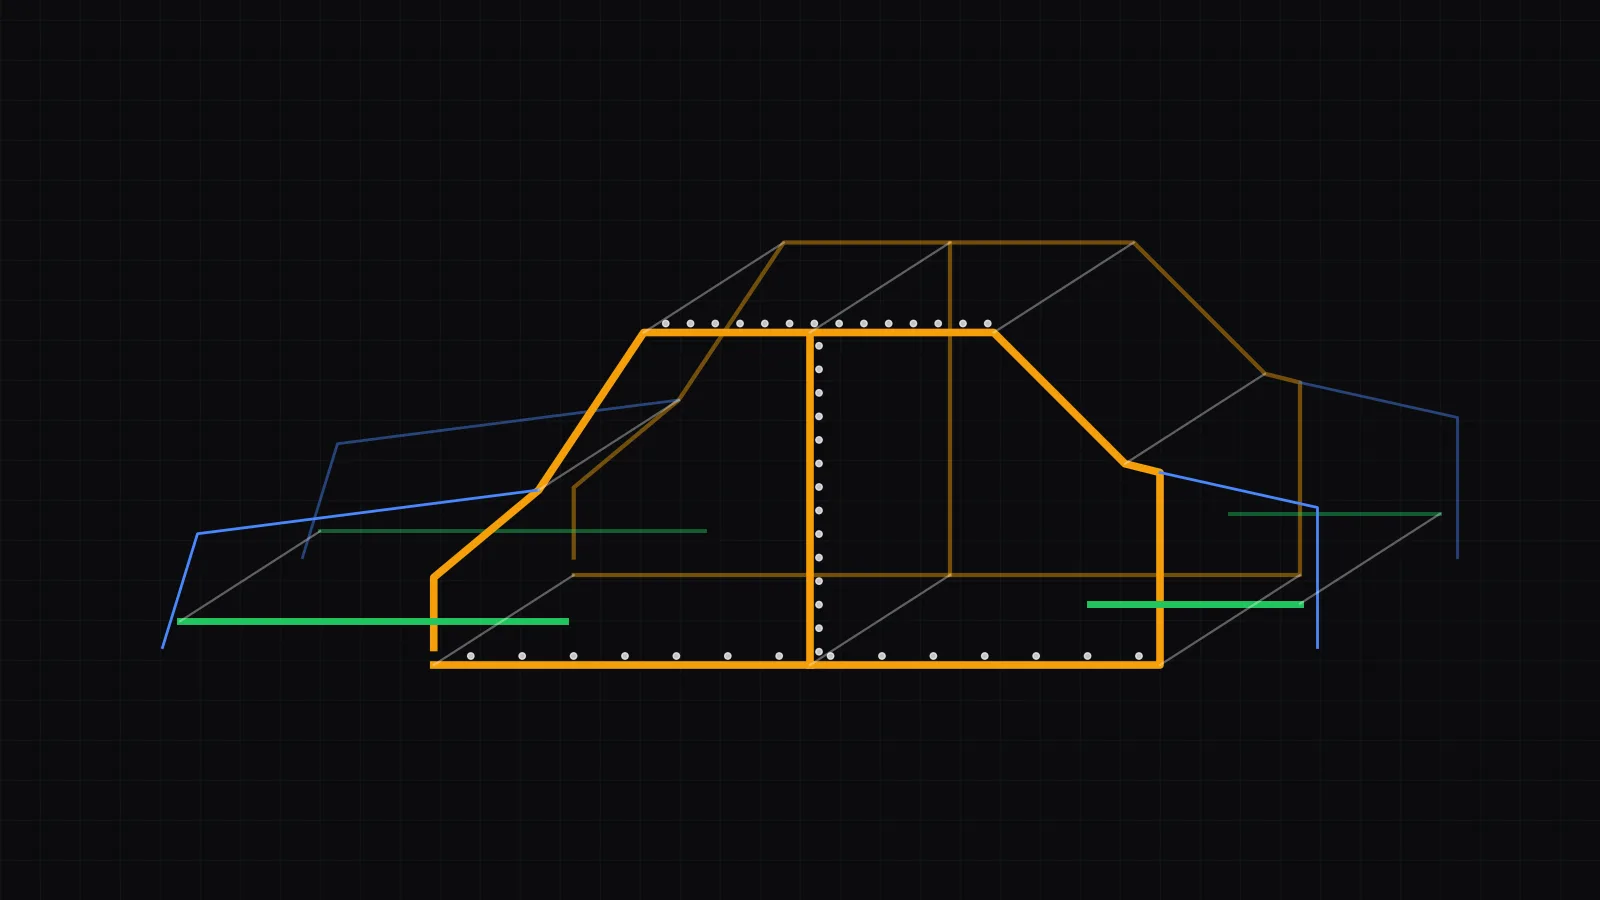
Automotive Benchmarking: 4 Types, Teardown Process and Worked Example
What automotive benchmarking is, what external benchmarking means, and the four types (internal, competitive, functional, generic) from Robert Camp's Xerox work. Then the seven-step teardown process, a scripted body-in-white weight and cost comparison, and the firms and skills behind the work in India.

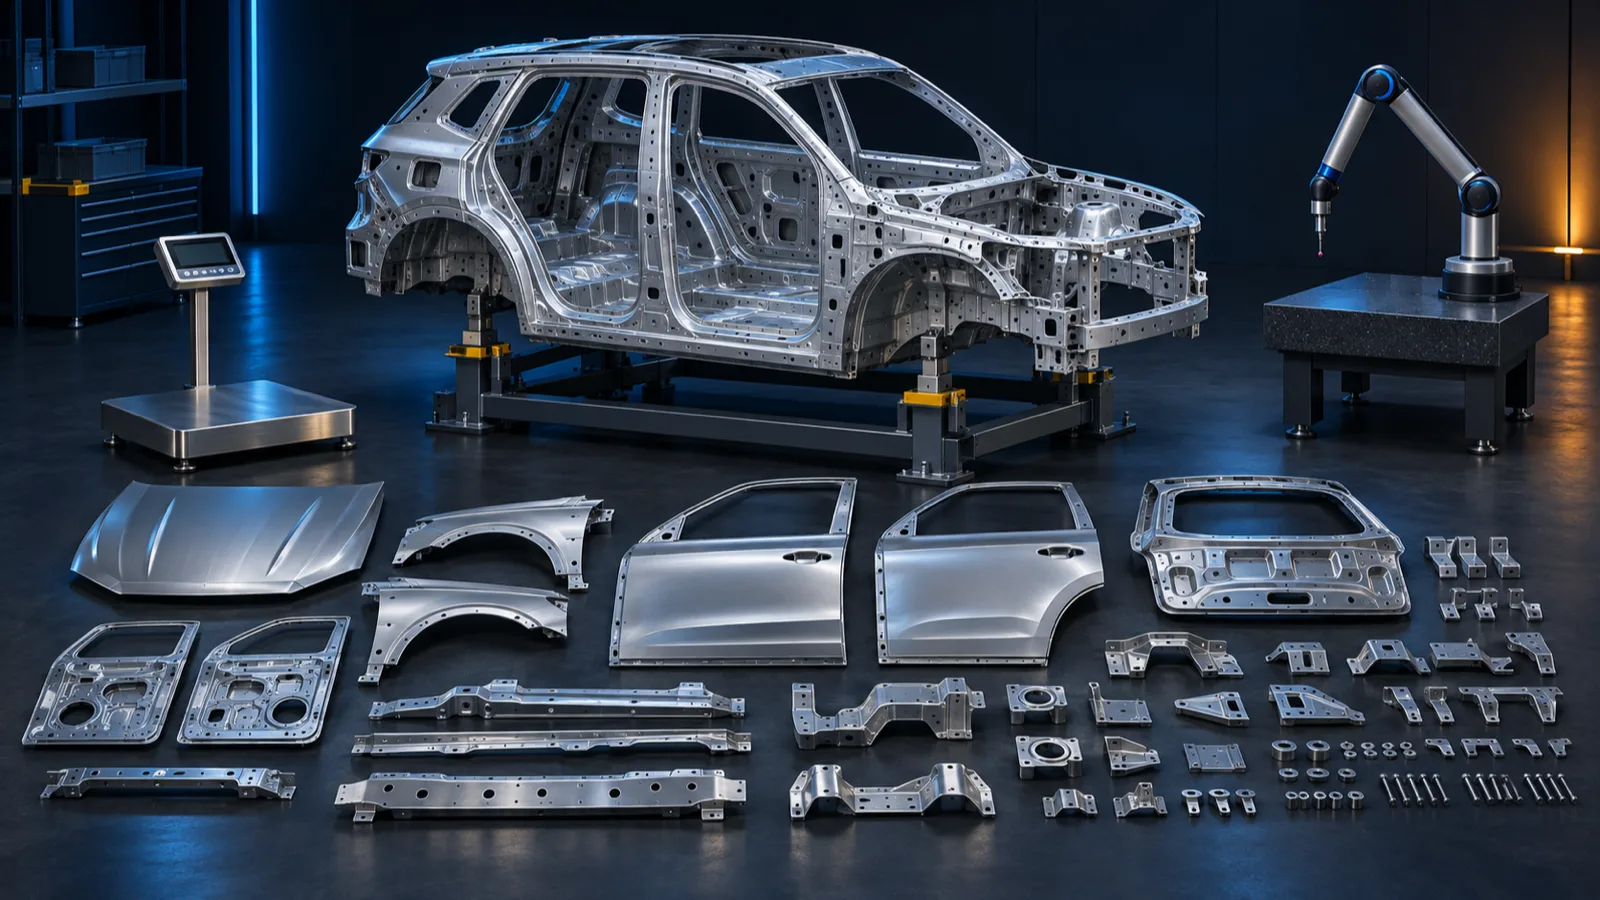
Automotive benchmarking is the structured comparison of a vehicle, or one of its systems, parts or processes, against rival products and the best practice anywhere. Engineers buy competitors' cars, measure and test them whole, then tear them down to weigh, identify and cost every part. The result is a set of evidence-based targets (mass, cost, dimensions, performance) that a new car's design must meet or beat.
This guide is for engineering students and early-career design engineers in India. It defines external benchmarking, explains the four types of benchmarking and where that classification comes from, walks through the teardown process step by step, and works through a weight and cost comparison of two car bodies with a script. It ends with the firms that do this work in India and the skills they hire for.
In short
- External benchmarking compares you with anyone outside your organisation: direct competitors, the same function in another industry, or the best process anywhere. Internal benchmarking compares parts of your own company.
- The four types (internal, competitive, functional and generic) come from Robert Camp of Xerox. Camp said Xerox started benchmarking in 1979-80 (Healthcare Forum Journal interview, 1993).
- Weight is the headline number in a teardown because, according to the US Department of Energy, a 10% lighter vehicle can get 6-8% better fuel economy.
- Teardowns run deep. Munro & Associates counted more than 54,000 parts and 196,000 manufacturing steps in a BMW i3 (Jalopnik, 3 Oct 2016). A2MAC1 says it has analysed more than 1,200 vehicles (A2MAC1, read 19 Nov 2026).
- Our worked example (illustrative numbers): a body 15 kg lighter costs ₹11,849 more, or ₹790 per kg saved. Taking the lightest zone from each rival gives a 322 kg target.
What is automotive benchmarking?
Automotive benchmarking is how a car maker or supplier finds out, with measurements rather than opinions, how its product compares with the best rival products. Teams study competitors' price, specifications and features, then measure dimensions, test performance and tear vehicles down part by part. The gaps they find become targets for the next design.
Benchmarking happens early. Skill-Lync's BIW Design and Development course teaches it as a sub-stage of the pre-design phase of the vehicle development process, before any part is drawn. Its free lesson on benchmarking case studies splits the work into two levels:
- Benchmarking 1: a segment-level study. Who are our competitors, what do they charge, and what specifications and features do they offer?
- Benchmarking 2: a part-by-part comparison of competitors' vehicles, aimed at cutting weight or improving performance.
The instructor's rule: the numbers must be exact, because they become the inputs for the design phase. A wrong benchmark means a wrong design.
What is external benchmarking?
External benchmarking means comparing your products, processes or performance with organisations outside your own company. Those can be direct competitors (a rival car maker), firms with the same function in another industry (a retailer's warehouse), or whoever runs a process best anywhere. Internal benchmarking is the opposite: comparing plants, teams or models within one company.
In the four-type scheme below, external benchmarking covers three types: competitive, functional and generic. Camp's 2007 presentation describes the gap between internal and external practices as what "creates the NEED for change". You find that gap only by looking outside.
| Question | Internal benchmarking | External benchmarking |
|---|---|---|
| Compared with | Your own plants, teams, models or past programmes | Competitors, other industries, best-in-class processes |
| Data access | Easy: same company, same definitions | Harder: buy the product, use public data, a database or a partner |
| Automotive example | Paint-shop cycle time at two of your own plants | Tearing down the segment leader's SUV to weigh its body panels |
| Typical output | Spread the best internal practice | Targets set against the market, plus ideas you didn't have |
In automotive work, external benchmarking usually means competitive product benchmarking: buying a rival's car and studying it, which needs no partner. Functional and generic benchmarking usually study processes, so they need a willing partner.
What are the four types of benchmarking?
The four types of benchmarking are internal (comparing similar operations within your own organisation), competitive (comparing with the best direct competitors), functional (comparing with companies that do the same function in another industry) and generic (comparing with whoever has the most innovative, exemplary version of a work process, in any industry).
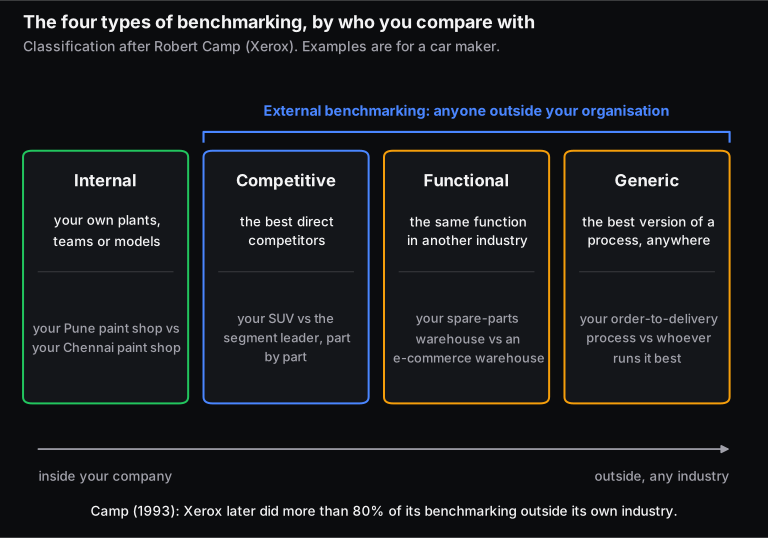
Where the classification comes from. These four types come from Robert C. Camp, who brought benchmarking to Xerox's logistics operation and wrote Benchmarking: The Search for Industry Best Practices That Lead to Superior Performance (ASQC Quality Press, 1989). His 2007 slides "Best Practice Benchmarking" list them under these names. The University of Cambridge's Institute for Manufacturing uses the same four definitions and cites Camp's 1995 book Business Process Benchmarking.
| Type | Compared with | Car-industry example | What it is good for |
|---|---|---|---|
| Internal | Similar operations in your own company | Weld-line uptime at two of your plants | Quick wins; data is easy to get |
| Competitive | The best direct competitors | Teardown of the segment leader's body-in-white | Product targets: mass, cost, features, dimensions |
| Functional | The same function in another industry | Your parts warehouse against a large retailer's | Process ideas a rival car maker wouldn't share |
| Generic | The best version of a process, anywhere | Your order-to-delivery process against the best run anywhere | Breakthrough process changes |
Camp told the Healthcare Forum Journal in 1993 that Xerox started benchmarking in 1979 and 1980, and folded it into its quality programme in 1982. He also said Xerox by then did more than 80% of its benchmarking outside its own industry. Car makers adopted the approach early. The Henry Ford museum's history of the 1986 Ford Taurus says Ford "benchmarked" the car by finding the competitor cars with the best features and trying to equal or beat them.
What is the automotive benchmarking process?
The automotive benchmarking process has seven steps. Define the question and pick target vehicles. Acquire them. Measure each vehicle whole and test it whole. Tear it down and record every part's mass, material and joints. Estimate what each part costs to make. Then normalise the data, find the gaps and turn them into design targets.
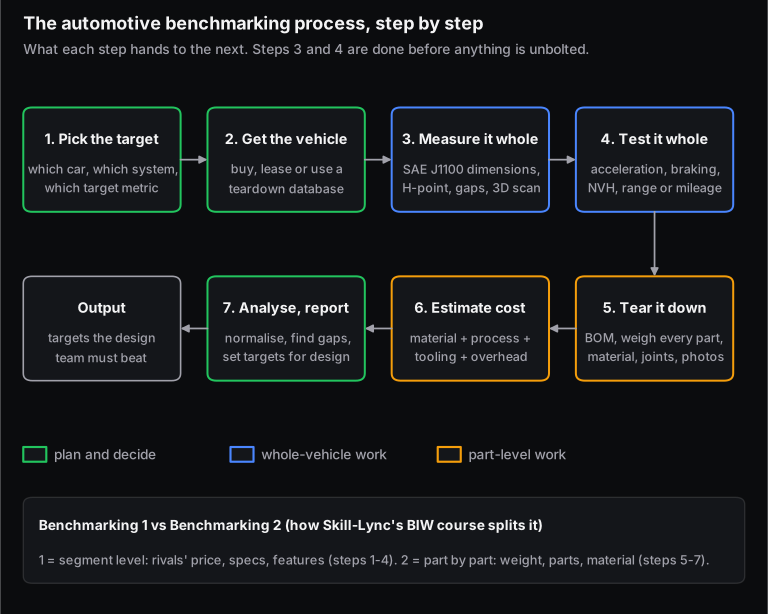
1. Pick the target and the question
Start with a decision someone has to make: "Should our next compact SUV's body be lighter, and at what cost?" The question decides which vehicles to buy (usually the segment leader and one or two challengers) and which systems to study in depth.
2. Acquire the vehicles
Product benchmarking needs the physical product, so teams buy cars, often the variant that sells most. The alternative is to subscribe to a teardown database. A2MAC1 says it has analysed more than 1,200 vehicles. Caresoft Global says its teardown data covers BOM, material composition, part-level photos and dimensions for more than 200 benchmarked vehicles.
3. Measure the vehicle whole
Dimensions are taken to a standard so they can be compared. SAE J1100 (Motor Vehicle Dimensions) gives every measurement a code: L101 is the wheelbase, L103 the overall length, W103 the overall width, H61 the effective front headroom, L34 the effective front legroom and L51 the second-row legroom. Seating positions are referenced to the H-point, the hip pivot of the SAE J826 manikin. Teams also measure panel gaps and flushness, and often 3D-scan the body.
4. Test the vehicle whole
Before teardown, the car is driven and tested: acceleration and braking, ride and handling, noise and vibration (NVH), fuel economy or range, and rolling resistance. Hinduja Tech, a Chennai-based engineering services firm, calls this the "pre-process" of its competitive benchmarking service: performance benchmarking plus static benchmarking. Teardown is the "mid-process".
5. Tear it down
The car is taken apart in a planned order, and every part gets a line in the bill of materials (BOM): part name, mass, material, thickness, process, joining method and photos. In Skill-Lync's free lesson, the instructor uses an Elcometer gauge to measure underbody-coating thickness on a Toyota Etios and a Ford Figo, and a Niton XLT analyser to find the coating's composition. He also compares a Nissan Murano body-in-white, built from 436 parts, with a Mazda CX-5's 490 parts. For BIW (body in white, the welded sheet-metal shell) the body is split into zones: closures, the upper body and roof, the floor, and the engine compartment. Our worked example below uses the same split.
The detail can be enormous. Jalopnik reported in 2016 that Munro & Associates found more than 54,000 parts in a BMW i3 (31,000 mechanical and 23,000 electrical). The firm sold the resulting 23,000-page report for $150,000.
6. Estimate the cost
Nobody publishes what a rival pays for a part, so benchmarkers build a should-cost: what the part ought to cost given its material, process, cycle time, tooling and overheads. Munro's i3 cost map ran to 196,000 manufacturing steps. One horn bracket weighed 0.03 kg, took about 10 seconds to make and was costed at 18 cents.
Investors run teardowns too. In 2017, UBS analysts tore down a Chevrolet Bolt. They reported that its electric powertrain was $4,600 cheaper to make than previously thought, and estimated that GM was losing $7,400 in earnings before interest and tax on each car, mainly because of low volume (CleanTechnica, 20 May 2017).
7. Analyse, normalise and report
Raw numbers mislead when cars differ in size, so they are normalised: kg per square metre of plan area, cost per kg, parts per zone, or share of high-strength steel. The report states the gap, a likely reason for it, and a target. The free lesson's example: match the best rival's underbody-coating thickness, or beat it if the budget allows.
Camp's slides quote Xerox chairman Paul Allaire: "The prime objective of benchmarking is to understand those practices which will provide a competitive advantage in the market place; target setting is secondary." A good report explains why the rival is lighter or cheaper, not only by how much.
Worked example: how do you compare two car bodies for weight and cost?
Take two rival compact SUVs, Car A and Car B, after a BIW teardown. All numbers here are illustrative. They are round teaching values chosen to behave like real data, not measurements of any real car, and the prices are not market quotes. The script that computes every figure is kept with this post (calc.py).
| Zone | Car A mass (kg) | Car B mass (kg) | Lighter | Car A should-cost | Car B should-cost |
|---|---|---|---|---|---|
| Closures (doors, hood, tailgate) | 58 | 61 | A | ₹18,189 | ₹19,709 |
| Upper body and roof | 140 | 122 | B | ₹48,721 | ₹53,534 |
| Floor (underbody) | 98 | 102 | A | ₹40,203 | ₹43,664 |
| Front end (engine bay) | 48 | 44 | B | ₹21,763 | ₹23,818 |
| Total BIW | 344 | 329 | B by 15 kg | ₹1,28,875 | ₹1,40,724 |
| Stamped parts / spot welds | 422 / 4,340 | 480 / 4,600 | |||
| High-strength steel share | 32.6% | 45.3% |
The cost model. For each zone of mass , the stamping blanks weigh , where is the share of the bought sheet that ends up in the part. Sheet costs a blended price : ₹70/kg for conventional steel and ₹105/kg for advanced high-strength grades, weighted by the zone's high-strength share. Offcuts sell as scrap at = ₹25/kg. Each stamped part adds = ₹180 for press time, die wear and handling, and each spot weld adds = ₹3:
For Car B's upper body, kg, so the blanks weigh kg. With 63% high-strength steel, rupees per kg. With 174 parts and 1,990 welds:
That zone costs about ₹53,534. Summing all four zones gives the table's totals.
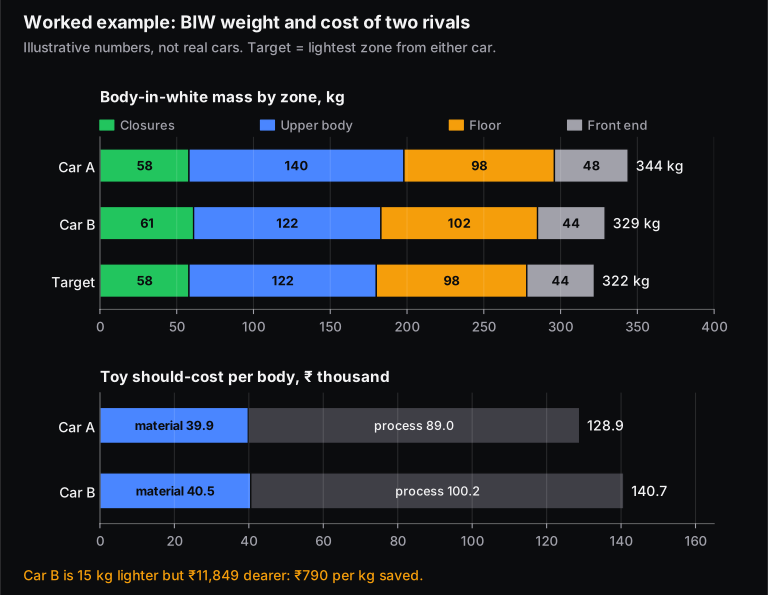
What the comparison says.
- Lighter is not cheaper. Car B's body is 15 kg (4.4%) lighter but costs ₹11,849 more. That is rupees per kg saved, paid for with more high-strength steel, 58 more parts and 260 more welds. Whether that is worth it depends on what a kilogram is worth to your programme.
- Normalise before you judge. Car B is also slightly bigger. Using J1100 length × width (L103 × W103) as plan area, Car A's body is 344 kg over 7.697 m², or 44.7 kg/m². Car B's is 329 kg over 7.857 m², or 41.9 kg/m². So the advantage holds after correcting for size.
- Take the best of each zone. Neither car wins everywhere. Car A has the lighter closures and floor, and Car B the lighter upper body and front end. Taking the lightest zone from each gives a 322 kg target, 22 kg lighter than Car A and 7 kg lighter than Car B. Composite targets like this are a standard output of benchmarking.
- Put the saving in context. If the new car has a kerb mass of 1,300 kg, 22 kg is 1.69%. Scaling the DOE's rule of 6-8% better fuel economy per 10% weight reduction in a straight line gives roughly 1.0-1.35%. That is only a rough estimate: the DOE figure assumes the whole vehicle is optimised, including a resized powertrain.
Who does automotive benchmarking in India?
In India, benchmarking is done by OEM product-planning and design teams, by specialist teardown firms with labs in Chennai and Coimbatore, by engineering services companies, and by test agencies such as ARAI. Most of the people doing it are mechanical engineers with design, manufacturing or costing backgrounds.
- OEM design teams. Benchmarking is part of pre-design, and the design engineer receives its results as targets. That is why Skill-Lync's body-in-white and automotive design courses teach it before panel design.
- A2MAC1 leased 43,000 sq ft at ESR Oragadam, Chennai, in April 2022 to produce benchmarking data and reports for car makers (ESR release, 12 Apr 2022).
- Caresoft Global calls itself "a world leader in benchmarking and cost reduction". It lists technology centres in Chennai and Coimbatore and more than 1,100 employees. In May 2025, KPIT agreed to buy its engineering-solutions business, and Caresoft is restructuring so that benchmarking and cost-reduction engineering form a separate unit (Autocar Professional, 6 May 2025).
- Hinduja Tech (corporate office in Chennai) sells competitive benchmarking in three phases: performance and static benchmarking, then teardown with weights, dimensions and cost analysis, then material and E/E analysis.
- ARAI in Pune lists "benchmarking against global standards" and "metrology and dimensional inspection" among its engineering services.
Skill-Lync's own placement records include learners hired by Caresoft Global as design engineers and by A2MAC1 as a costing engineer. These are self-reported placements of Skill-Lync learners, not a market survey, and the counts are too small to quote salaries.
What skills does a benchmarking engineer need?
A benchmarking engineer needs to know how parts are made, measured and costed. Pick up a bracket and you should be able to say what it is made of, how it was formed and joined, and roughly what it costs. Then prove it with a scale, a gauge and a cost model, and write it up clearly. CAD and data skills tie it together.
- Manufacturing processes: stamping, deep drawing, casting, injection moulding and joining. You estimate cost from the process, so you must recognise it from the part. Skill-Lync's Manufacturing Processes book covers each one with worked numbers.
- Measurement: vernier and height gauges, coating-thickness gauges, CMM and 3D scanning, plus the J1100 dimension codes. See the Machining Science, Machine Tools and Metrology book.
- Materials: steel grades from mild steel to press-hardened boron steel, aluminium and plastics. Spectrometers and XRF analysers give the chemistry; you interpret it.
- CAD and drawings: rebuilding scanned parts in CATIA or NX, reading GD&T, and comparing master sections. Our body-in-white guide explains the zones and joints you will be tearing apart.
- Costing and data: should-cost models, Excel or Python, and the habit of normalising before comparing.
- Report writing: one clear page per finding, with the recommendation stated. As the Skill-Lync instructor puts it, benchmarking has no fixed format, but the comparison should make the answer obvious.
How can a student practise automotive benchmarking?
You can practise with a buyer's brief and public data before you ever touch a teardown. Skill-Lync's free sheet-metal design lesson ends with exactly this assignment: recommend one car, on a ₹8-10 lakh budget, for a family of five in Bengaluru who also drive about 500 km to Madurai. Learners have published 2,412 projects with "benchmarking" in the title on Skill-Lync's student-project pages, 2,207 of them between 2021 and 2023.
Read one learner's automotive benchmarking report to see the format. It compares four cars in the ₹8-10 lakh on-road band against the family's needs and recommends one. To go further, do a Benchmarking 2 study on something you can take apart, such as a bicycle, a mixer-grinder or a scrapped two-wheeler's panels. Weigh every part, name the material and process, and build a should-cost like the one above.
The full path (vehicle development process, benchmarking, then panel design in NX) is in the PG Program in Automotive BIW Design and Development. For the broader design track, see the PG Program in CAD and our automotive design courses. Where benchmarking sits in a programme is covered in our guide to automotive product development stages.
What are the limits of benchmarking?
Benchmarking shows you what a rival built, not why. In the free lesson, the Murano's heavier pillar panels might come from a side-impact rating target, but that is a hypothesis to check, not a finding. Treat every "why" as a guess until crash data or the supplier confirms it.
A teardown also describes a car designed years earlier. If you aim only at today's best rival, you may launch a car that matches a model your rival is already replacing. And it is expensive: Munro's full i3 cost report sold for $150,000. Teardown databases exist partly to spread that cost across many subscribers.
Frequently asked questions
Is benchmarking the same as reverse engineering?
No. Reverse engineering rebuilds a part's geometry and design so you can reproduce or analyse it. Benchmarking compares products or processes to set targets, and the comparison may never need a CAD model. Teardown-based benchmarking often includes some reverse engineering, such as scanning a part to measure its section.
Is competitive benchmarking legal?
Buying a competitor's car on the open market and studying it is how teardown firms such as A2MAC1 and Caresoft build their databases. Studying is not copying, though: patents and registered designs still protect the rival's features. Benchmarking reports a gap; your own design has to close it.
What is the difference between Benchmarking 1 and Benchmarking 2?
In Skill-Lync's BIW course, Benchmarking 1 is the segment-level study of rivals' price, specifications and features. Benchmarking 2 is the detailed part-by-part comparison of competitors' vehicles, aimed at reducing weight or improving performance. Benchmarking 2 is what most people mean by a teardown.
Which standard defines car dimensions for benchmarking?
SAE J1100 (Motor Vehicle Dimensions) gives each dimension a code, such as L101 for wheelbase, L103 for overall length and H61 for effective front headroom. SAE J826 defines the H-point manikin used to locate seating positions. Using the codes lets two teams compare measurements without arguing over definitions.
Sources and further reading
- Robert C. Camp, Best Practice Benchmarking for Global Competition and Cooperation, Best Practice Institute / Global Benchmarking Network (2007): four types of benchmarking, internal-external gap, Paul Allaire quote
- Joe Flower, interview with Robert Camp, The Healthcare Forum Journal 36(1), Jan-Feb 1993: Xerox began benchmarking in 1979-80; over 80% outside its industry
- Institute for Manufacturing, University of Cambridge, Benchmarking (decision support tools), read 19 Nov 2026
- The Henry Ford, Showroom of Automotive History: 1986 Ford Taurus (archived copy)
- SAE International, SAE J1100 Motor Vehicle Dimensions (2001 edition, public copy; current edition J1100_200911)
- US Department of Energy, Lightweight Materials for Cars and Trucks, read 19 Nov 2026
- David Tracy, The fascinating company that tears cars apart to find out exactly how they're built, Jalopnik, 3 Oct 2016
- Steve Hanley, UBS: Chevy Bolt drivetrain $4,600 cheaper than thought, CleanTechnica, 20 May 2017
- A2MAC1, Benchmarking data, read 19 Nov 2026
- ESR India, ESR leases 43,000 sq ft industrial space to A2Mac1 in Chennai, 12 Apr 2022
- Caresoft Global, About, read 19 Nov 2026
- Autocar Professional, KPIT Technologies acquires Caresoft Global's engineering solutions business, 6 May 2025
- Hinduja Tech, Competitive benchmarking, read 19 Nov 2026
- ARAI, Engineering services, read 19 Nov 2026
- Skill-Lync, Design Engineering Process and Benchmarking Case Studies (free lesson) and BIW Design and Development Part 1 syllabus
- Skill-Lync student-project index and placement records (internal data export, read 19 Nov 2026)