Week 9 - Senstivity Analysis Assignment
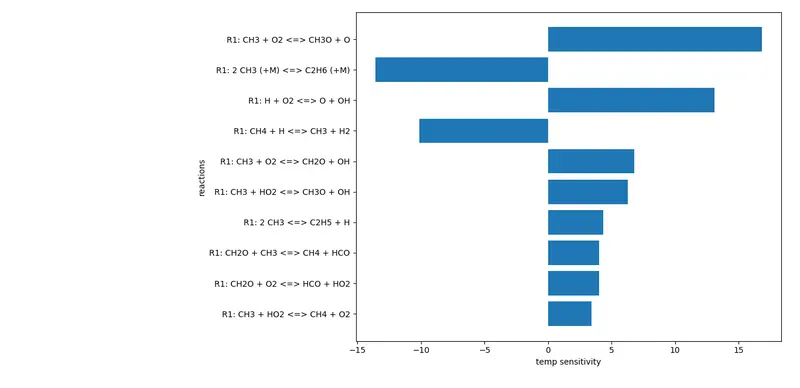
Aim: To determine the 10 most sensitive reactions with respect to temperature among the list of reactions in the GRI mechanism for combustion.
Objective:
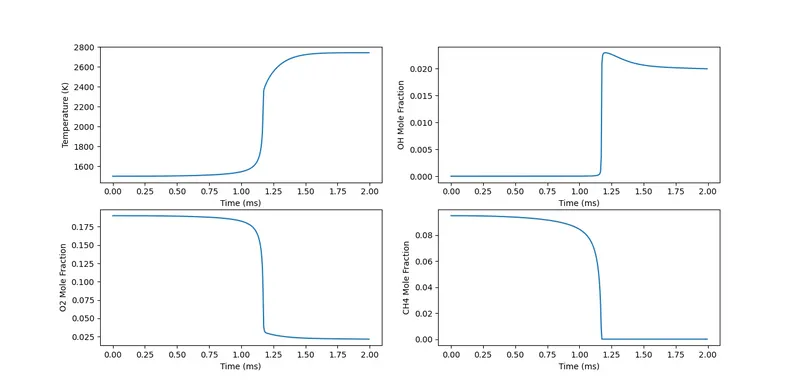
- Plot the variation of temperature and molar concentration of the species with respect to time.
- Plot the bar graph showing the 10 most sensitive reactions with respect to temperature.
Introduction
Sensitivity analysis is a process to get a relationship between input parameters and output of the model. e.g., effect of a particular species concentration of the adiabatic flame temperature.
`text(sensitivity)=text(change in variable)/text(change in parameter)`
Computational combustion sensitivity has a separate system from ODE which has to be solved for obtaining the relationship. Generally, sensitivity is given by:
`(dZ)/(dt)=F(Z,t,a)`
Where, Z is the vector of temperature and species whose size is (K+1), where K is the number of species.
t is time.
a is reaction rate constant.
The sensitivity ODE system has its own tolerance values. The two types of tolerance specified are absolute and relative tolerance. Absolute tolerance is used for the newton Raphson convergence and relative tolerance is used for species which have a very slow or fast rate of change of parameters.
A positive value of sensitivity means the particular parameter has a positive coefficient effect on the component and vice versa. e.g., a particular reaction might Favour temperature of the state. higher the rate of this reaction. higher the temperature obtained in that state and lesser is the ignition delay.
in this project, the sensitivity analysis of temperature is done on the reactions of methane from GRI mechanism file. the GRI mechanism has a total of 325 reactions listed in it. out of them, the top 10 sensitive reactions to temperature are determined in this project. Additionally, the concentration of OH, `O_2` and `CH_4` is plotted against the simulation time.
Cantera solves the system of ODEs for sensitivity analysis. The reactor is considered to be the ideal gas constant pressure reactor.
Python code with explanation
'''
Program to identify top 10 most sensitive reaction to temperature in GRI 3.0 mechanism


program by: krishnanand kushwaha
'''

#importing necessary libraries
import sys
import cantera as ct
import numpy as np
import matplotlib.pyplot as plt

gas = ct.Solution('gri30.xml')   #initializing gas as instance of the Solution class based on GRO30.xml file
temp  = 1500   #Initial temperature
pres = ct.one_atm   #pressure 1 atm

gas.TPX =  temp, pres, 'CH4:1, O2:2, N2:7.52'    # defining temperature , pressure and species concentration according to stoichiometry
r = ct.IdealGasConstPressureReactor(gas, name = 'R1')   #creating ideal gas constant presure reactor 'r' from gas instance
sim = ct.ReactorNet ([r])   #creating reactor network 'sim' from 'r' instance

no_rxn = gas.n_reactions#n. of reactions in gri file


for i in range(no_rxn):
    r.add_sensitivity_reaction(i)  #asking cantera to also compute senstivity of reaction at index i
#set the tolerances for the solution and for the sensitivity coefficients
sim.rtol = 1e-6 #absolute change in solution should be less than this number
sim.atol = 1e-15# relative change in solution should be less than this number
sense = final = []
sim.rtol_sensitivity = 1e-6 #relative change in sensitivity should be less than this number
sim.atol_sensitivity = 1e-6 #absolute change in sensitivity should be less than this number
rxn = []
maxi_1 = []
maxi = [0]*no_rxn  # array to store maximum senstivity of each reaction
states = ct.SolutionArray(gas, extra=['t','s2','s3']) #sorting solution array in state object
for t in np.arange(0, 2e-3, 5e-6):
    sim.advance(t)  #asking cantera to integrate the solution from 0 till 2e-3
    for j in range(no_rxn):
        s = sim. sensitivity('temperature', j) # sensitivity of Temperature to reaction
        states.append (r.thermo.state, t=1000*t, s2 = s,s3=s)  #saving thermodynamic state of reactor

        if(np.abs(s)>=np.abs(maxi[j])):  # checking and saving maximum senstivity in tim eof each reaction
            maxi[j] = s

maxi_1 = np.copy(maxi)
maxi_1.sort()
left_ptr = 0
right_ptr = len(maxi_1) - 1
ctr = 0

while (ctr<10):
    if np.abs(maxi_1[left_ptr]) > np.abs(maxi_1[right_ptr]):
        final.append(maxi_1[left_ptr])
        left_ptr += 1
        ctr = ctr+1
    else:
        final.append(maxi_1[right_ptr])
        right_ptr = right_ptr-1
        ctr = ctr +1

ctr = 0
final.reverse()
rxn.reverse()
while(ctr<10):
    index = maxi.index(final[ctr])
    rxn.append(sim.sensitivity_parameter_name(index))
    ctr += 1
print(final)


#plotting result


plt.figure(1)

plt.barh(rxn,final)
plt.xlabel('temp sensitivity')
plt.ylabel('reactions')
plt.tight_layout()


plt.figure(2)

plt.subplot(2,2,1)
plt.plot(states.t, states.T)
plt.xlabel('Time (ms)')
plt.ylabel('Temperature (K)')

plt.subplot(2,2,2)
plt.plot(states.t,states('OH').X)
plt.xlabel('Time (ms)')
plt.ylabel('OH Mole Fraction')

plt.subplot(2,2,3)
plt.plot(states.t, states('O2').X)
plt.xlabel('Time (ms)')
plt.ylabel('O2 Mole Fraction')

plt.subplot(2,2,4)
plt.plot(states.t, states('CH4').X)
plt.xlabel('Time (ms)')
plt.ylabel('CH4 Mole Fraction')
plt.show()
Output plots
Conclusion
- From the sensitivity pot, it can be clearly seen that the reaction with highest positive sensitivity is
`CH_3+O_2<=>CH_3O+O` and the reaction with highest negative sensitivity is `2CH_3+M<=>C_2H_6+M` - This means if the rate of the first reaction is increased, the state temperature increases and hence we can obtain lesser ignition delay. Also, if we increase the rate of the second reaction, the estate temperature decreases and hence the ignition delay will increase.
- The other eight reactions affect the ignition delay as per their magnitude and their sign.
- The other plot shows the variation of temperature, concentration of `OH`, `O_2` and `CH_4` with respect to time from which the ignition delay can be calculated.
- We can see that ignition takes place and there is a spike in temperature. The ignition delay can be calculated around 1.25ms.
- During ignition we can see that there is a spike in concentration of `OH`, decrease in concentration of `O_2` and `CH_4`. This is because OH is the product of combustion but `O_2` and `CH_4` are consumed during combustion.