Week 9 - Senstivity Analysis Assignment
Assignment number 8
Assignment name-sensitivity analysis of methane combustion using cantera
Aim-write the code that takes the all reactions from the GRI mechanisms and calculate 10 most sensitive reactions. Parameter should be with respective to temperature
Sensitivity analysis
In chemistry sensitivity analysis is performed to check how the reaction behave to a given parameter such as temperature, pressure, concentration etc.
It is highly used in combustion chemistry. And we know the combustion process is associated with lot of intermediate reactions
The important things of such type of analysis to study or get the knowledge of ignition delay of system and its help in controlling the parameter and rate of reaction and perform any combustion process as per required application
Coding approach
- Gas object is created from solution class and use gas.TPX and give the input of temperature, pressure and moles are set
- Then created reactor object r and use IdealGasConsPressureReactor
- Again used ReactorNet for creating reactor network
- There are total 325reaction in GRI mechanism file was simulated using add_sensitivity_reaction () and also add relative as well as absolute tolerance to check converge criteria
- Used solution array instead of separated array
- Used advanced command is used to advance the reaction with time
Code
"""
assignment number 8

computional combustion

sensitivitty analysis of methane

date=02-02-2022

author=iddhesh Sakpal

"""
import cantera as ct
import matplotlib.pyplot as plt
import numpy as np

gas=ct.Solution("gri30.cti")
T=1500
P=ct.one_atm
gas.TPX=T,P,{"CH4":1,"O2":2,"N2":7.52}
r=ct.IdealGasConstPressureReactor(gas)
sim=ct.ReactorNet([r])

for i in range(325):
	r.add_sensitivity_reaction(i)

sim.rtol=1e-6
sim.atol=1e-15
sim.rtol_sensitivity=1e-6
sim.atol_sensitivity=1e-6
n=gas.n_reactions
s_max=[0]*n
states=ct.SolutionArray(gas,extra=['t'])

for t in np.arange(0,2e-3,5e-6):
	sim.advance(t)
	states.append(r.thermo.state,t=1000*t)
	for j in range (n):
		s2=sim.sensitivity("temperature",j)
		if np.abs(s2)>=np.abs(s_max[j]):
			s_max[j]=s2

n_number=10
s_max_abs=np.abs(s_max)
s_maximum=sorted(s_max_abs,reverse=True)
sensitivities=s_maximum[0:n_number]
sensitivity_final=[]
indexr=[]
eq=[]
for i in range(n_number):
	for j in range(n):
		if np.abs(s_max[j])==sensitivities[i]:
			sensitivity_final.append(s_max[j])
			indexr.append(j)
			eq+=gas.reaction_equations([j])

print(sensitivities)
print(sensitivity_final)
print(indexr)
print(eq)
plt.figure(1)
plt.barh(eq,sensitivity_final)
plt.yticks(fontsize=6)
plt.gca().invert_yaxis()
plt.xlabel("sensitivities")
plt.title("10 most temperturesensitive reaction in methane combustion")
plt.figure(2)
plt.subplot(2,2,1)
plt.plot(states.t,states.T,color="blue")
plt.xlabel("time")
plt.ylabel("Temperture")
plt.subplot(2,2,2)
plt.plot(states.t,states("OH").X,color="green")
plt.xlabel("time")
plt.ylabel("OH mole fraction")
plt.subplot(2,2,3)
plt.plot(states.t,states("H").X,color="red")
plt.xlabel("time")
plt.ylabel("H mole fraction")
plt.subplot(2,2,4)
plt.plot(states.t,states("CH4").X,color="yellow")
plt.xlabel("time")
plt.ylabel("CH4 mole fraction")
plt.show()
Console screenshot

Graphs
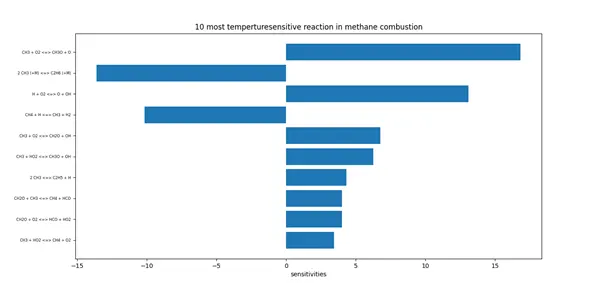
The above graph shows most temperature sensitive reaction methane combustion.
Changing the rate of this reaction different parameter like ignition delay would be controlled
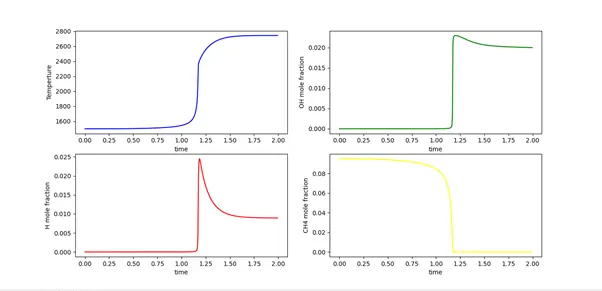
Above graph shows temperature variation and mole fraction concentration against time. The temperature has increased suddenly indicating time auto ignition from the initial value of 1500 k
Mole fraction of OH and H increases means species is formed and finally attaining the equilibrium
The CH4 mole fraction decreased means it has been consumed