Week 9 - Senstivity Analysis Assignment
Aim: To write a program to find the 10 most sensitive reactions w.r.t Temperature from the GRI mechanism.
Introduction:
In the combustion process, there are a series of reactions taking place in the microseconds. There is a need to study these reactions as the output of the combustion depends on these reactions. Some reactions majorly contribute to the change in the parameters like temperature, pressure, and concentration. To know which reactions affect these parameters more there is an analysis called sensitivity analysis. Sensitivity Analysis is a procedure to get the relationship between the parameters and the output of a model. It gives the data of how the reactions vary with the parameters. Temperature sensitivity gives the data of which reaction is most sensitive to temperature. It is used to tune the reaction mechanisms.
Code explanation:
- The gas object is created from the 'Solution' class and the temperature pressure and concentration of species are defined using 'gas.TPX' function.
- The reactor is created using the 'IdealGasConstPressureReactor' class passing the gas object.
- A reactor network is created for the data transfer using the 'ReactorNet' passing the reactor created.
- sensitivities of all the reactions are added using 'add_sensitivity_Reaction'method.
- Tolerances for both the species and the sensitivities are defined for convergence.
- States of the species are defined with the Solutuon_array
- Temperature sensitivity is added to all the reactions
- The 'advance' method is used to integrate the reactor network.
- Sorting of the sensitivities of the reactions along with the index, reactions, and the sensitivities.
- Save the top 10 sensitivities and their reactions and index.
- Extract the reactions, sensitivities, and index from the zip.
- Plot the bar graph with reactions on the y-axis and sensitivities on the x-axis.
Python code:
#senstivity of temperature on the reaction(Top 10)
import sys
import numpy as np
import cantera as ct
import matplotlib.pyplot as plt

gas = ct.Solution('gri30.xml')
T = 1500.0
P = ct.one_atm

gas.TPX = T,P,'CH4:1,O2:2,N2:7.52'
r = ct.IdealGasConstPressureReactor(gas, name='R1')
sim = ct.ReactorNet([r])
reaction = gas.reaction_equations()
N = gas.n_reactions
max_s = [0]*N
n = 10
# enable sensitivity wrt the rates of a11 reactions
for i in range(N):
	r.add_sensitivity_reaction(i)# sensitivities of all reactions

#set the tol for the solution and for the sensitivity coefficients
sim.rtol = 1.0e-6 # relative change in sensitivity should be less than this number
sim.atol = 1.0e-15 # absolute change in sensitivity should be less than this number

sim.rtol_sensitivity = 1.0e-6 # relative change in sensitivity should be less than this number
sim.atol_sensitivity = 1.0e-6 # absolute change in sensitivity should be less than this number

states = ct.SolutionArray(gas,extra='t')
reac_num=np.arange(1,N+1)
for t in np.arange(0,2e-3,5e-6):
	sim.advance(t)
	for j in range(N):
		s = sim.sensitivity('temperature',j) # sensitivity of all reactions
		#Saving sensitivities other than zero
		if np.abs(s)>np.abs(max_s[j]):#abs is used to get the numbers that ar negative )
			max_s[j]=s

	states.append(r.thermo.state, t =1000*t)

#Sorting
s_abs = np.abs(max_s)
reaction=sorted(zip(s_abs,reaction),reverse=True)
reac_num=sorted(zip(s_abs,reac_num),reverse=True)
max_s=sorted(zip(s_abs,max_s),reverse=True)

#getting first 10 reactions data from the sorted arrays
reac_HS = reaction[0:n]
rea_numb_HS = reac_num[0:n]
Sens = max_s[0:n]

#creating array to save required data
reaxns =[0]*n
index =[0]*n
sens = [0]*n
for i in range(n):
	reaxns[i] = reac_HS[i][1]
	index[i] = rea_numb_HS[i][1]
	sens[i] = Sens[i][1]

# show the reactions and their sensitivities
print("The %d most temperature sensitive reactions are:" % (n))
print("------------------------------------------------------------------")
print("%10s %s %18s %12s %12s" % ('Reaction Index','|','Reaction','|','Sensitivity'))
print("------------------------------------------------------------------")
for i in range(n):
	print("%5d %8s %26s %4s %10.4f" % (index[i],'|',reaxns[i],'|',sens[i]))
print("------------------------------------------------------------------")

#Reversing the order for plotting
reaxns.reverse()
index.reverse()
sens.reverse()

#plotting bar graph
plt.figure(figsize=(12,5))
plt.barh(reaxns,sens,align = 'center',color=['pink','grey'])
plt.yticks(fontsize=9)
plt.xlabel('Temperature Sensitivity')
plt.title("%d Most Temparture Sensitive Reactions with their sensitivities"%(n))
plt.tight_layout()
plt.show()

#plot showing variation of species concentration wrt time
plt.subplot(2,2,1)
plt.plot(states.t,states.T,color='orange')
plt.xlabel('Time(ms)')
plt.ylabel('Temperature(k)')

plt.subplot(2,2,2)
plt.plot(states.t,states('OH').X,color='pink')
plt.xlabel('Time(ms)')
plt.ylabel('OH Mole Fraction')

plt.subplot(2,2,3)
plt.plot(states.t,states('H').X,color='red')
plt.xlabel('Time(ms)')
plt.ylabel('H Mole Fraction')

plt.subplot(2,2,4)
plt.plot(states.t,states('CH4').X,color='cyan')
plt.xlabel('Time(ms)')
plt.ylabel('CH4 Mole Fraction')
plt.tight_layout()
plt.show()
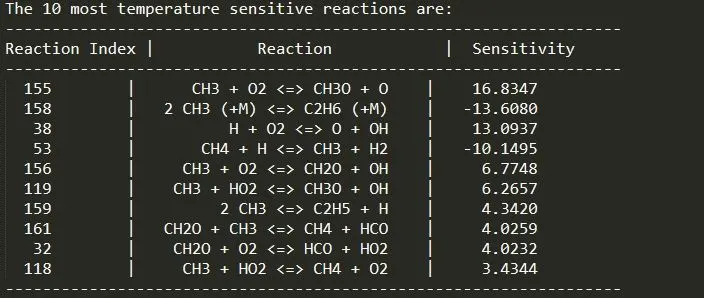
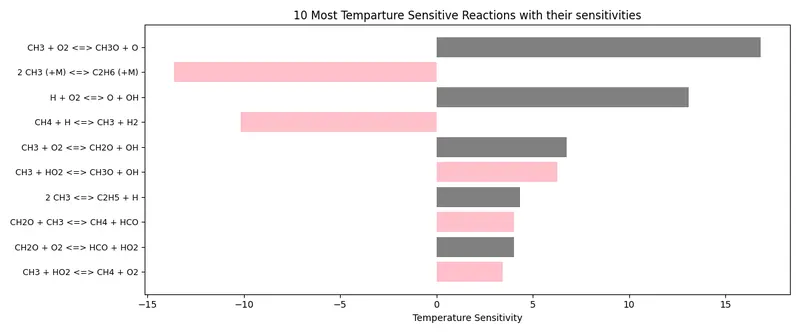
Program to show the 10 most sensitive reactions which are displayed with the highest sensitivity on the top, and plot graph showing sensitivity vs reaction is written.
10 most temperature-sensitive reactions and their sensitivities:
Plots:
Bar chart showing the 10 most temperature-sensitive reactions:
Conclusion:
- A positive sensitivity coefficient will increase the reaction rate with the increase in the parameter. Here in the above graph with the increase in temperature the reaction rates increases.
- A negative sensitivity coefficient will have a negative effect on the reaction rates i.e the reaction rate decreases with the increase in the parameter.
- The reaction with negative sensitivity has a negative effect on the reaction rate.
- The reaction with positive sensitivity has a positive effect on the reaction rate.