Parametric study on Gate valve.
AIM:
To perform a parametric study on the gate valve simulation by setting the opening from 10 % to 80%.
THEORY:
Gate valves are used to shut off the flow of liquids rather than for flow regulation. When fully open, the typical gate valve has no obstruction in the flow path, resulting in very low flow resistance. The size of the open flow path generally varies in a nonlinear manner as the gate is moved. This means that the flow rate does not change evenly with stem travel. Depending on the construction, a partially open gate can vibrate from the fluid flow. Gate valves are mostly used with larger pipe diameters (from 2" to the largest pipelines) since they are less complex to construct than other types of valves in large sizes. Gate valves without an extra sealing ring on the gate or the seat are used in applications where minor leaking of the valve is not an issue, such as heating circuits or sewer pipes.
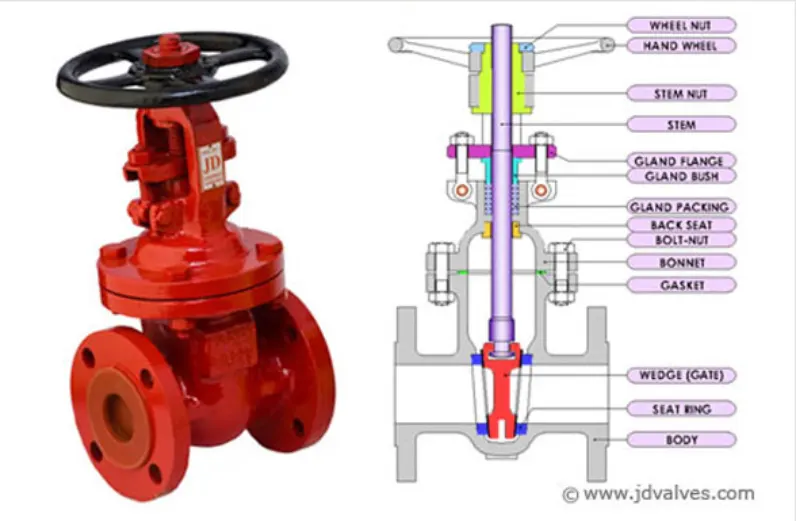
FIG 1:DIFFERENT PARTS OF VALVE
Different types of Gate Valves:
Wedge Gate Valves Plug-Disk Gate Valves Subsea Gate Valve Knife Gate Valve Insider Screw Gate Valve Rising Stem Gate Valve
Functioning Principle: Main Components of a Gate Valve are: body, seat, stem, bonnet and actuator. The main operation mechanism is very simple. When the hand wheel is turned, it rotates the fluid, which is translated into the vertical movement of a Gate Disc via threads. They are considered multi-turn valves as it makes more than one 3600 turn to fully open/close the valve. When the Gate is lifted from the path of the flow, the valve opens and when it returns to its closed position, it seals the bore resulting in a full closure of the valve. Parametric Study: One of the best ways to get value out of your simulation is to do parametric analysis. With very little marginal work a completed model can be parameterized to simulate scenarios limited only by your computational time and resources. As you move forward in your design, you can assess the impact that changing certain parameters can have on the design. The parameters can include dimensional parameters. Parametric studies allow you to nominate parameters for evaluation, define the parameter range, specify the design constraints, and analyze the results of each parameter variation. A parametric study requires the following:
Design Objective is set to Parametric Dimensions Parameters nominated for use in the simulation Parameter ranges identified Design criteria specified Various configurations generated
When you have the configurations generated you can then evaluate your simulation. You can further refine the parameters or design constraints until satisfied with the results. Once you determine that a configuration satisfies your design needs, you are able to promote that configuration back to the model as a CAD edit. You are prompted whether to make changes.
ANALYSIS:
Here we will perform simulation for a Gate Valve and see the effect of lifting the Gate Disc at different amount of percentage from 10 % to 80%. With the help of Parametric option, for lift of Gate Disc, we can parameterized the lift amount and see the different results or changes with different lift percentages. Once we study for 10% of lift, we will parameterize the lift and perform the analysis. Then we will see the changes in contours and other variable like Mass flow rate, Flow coefficient and Flow factor for all results one by one.
GEOMETRY USED:
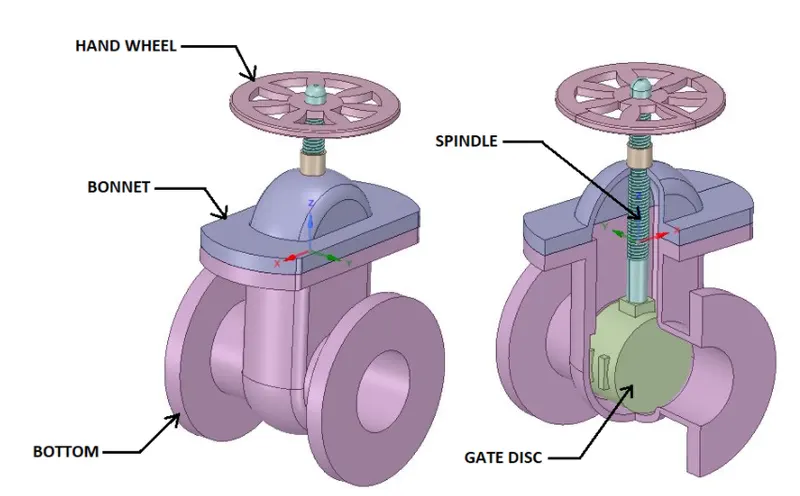
FIG 2: FULL GEOMETRY OF GATE VALVE
PROCEDURE:
1:GEOMETRY SETUP
1.After opening SpaceClaim in Fluent, import Geometry named as “Gate Valve. STEP”.
2.We can see the simplified geometry of Gate Valve as given below as well as the Structure of all parts mentioned as given
3.We can see all the parts listed in the Structure Tree. After importing Geometry, hide the “Bottom” Part, so we can clearly see the “Gate Disc”.
Then Select “Gate Disc” component and move it upward direction by “10 mm” lift. To analyze the flow and its effects, we must allow the flow, and for that we have given “10 mm” lift to the “Gate Disc”.
Lift of the “Gate Disc” can be given as shown in below image:
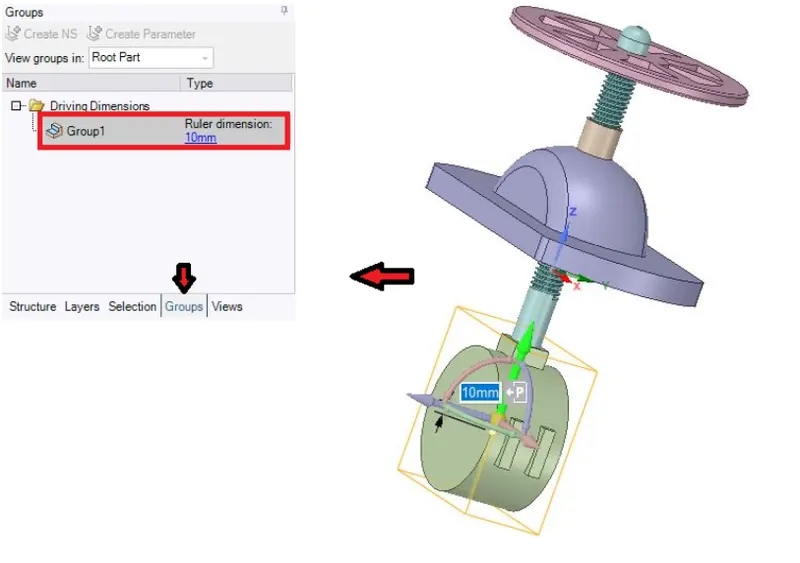
FIG 3: PARAMETERIATION SETUP
Here we can see the Green color arrow in upward direction shows the movement of “Gate Disc” in Positive Z-Direction.
Here we can see the symbol of “P”. This symbol “P” is used to parameterize the lift of the “Gate Disc”. After selecting the symbol “P”, it turns in Grey color, and message shows that a Group has been created for lift.
On the left side, in Tree structure, if we see the Group options, we can see created group and the amount of parameter, which has been set 10 mm lift. We can simply change the value of parameter from there directly.
After lifting the “Gate Disc”, move the both face at inlet and outlet of the “Bottom” part by amount of 800 mm just to see the fluid flow and its effects as given below:After extension, create Fluid volume by selecting inlet, outlet and upper edges of the “Bottom” part.
The creation of fluid volume is done as shown below:
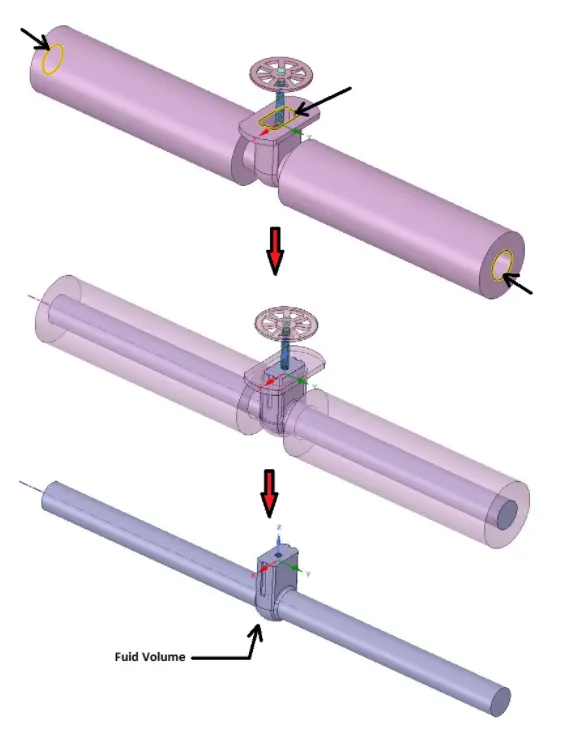
FIG 4: FLUID VOLUME CREATION
After creating Fluid Volume, Hide all rest parts of Gate Valve and suppress it for Physics and save it for further process. Then open Mesh settings.
2.MESHING
Mesh: Mesh for the Fluid Volume of Gate valve, detailed as given below. Here a mesh size of 6mm is used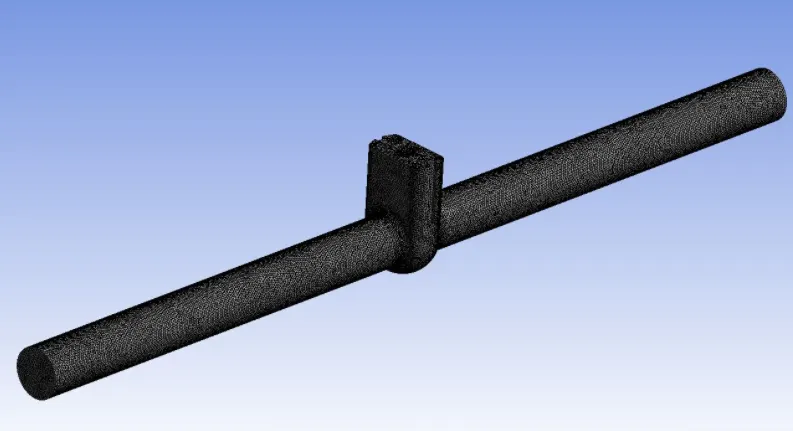
FIG 5:MESHED MODEL
After Meshing, update it for further process and go for the Fluent Setup.
In Fluent Setup, necessary details for simulation are as described below:
3. CASE SETUP DETAILS:
General Settings:
Analysis type: Steady-state Solver: Pressure based solver
Gravity: -9.81 m/s2 in Z-Direction
Material Specifications:
Material: water-liquid (h2o) Chemical Formula: H2O Density: 998.2 Kg/m3 Viscosity: 0.001003 Kg/ (m-s)
Viscous Model: Model: K-Epsilon K-Epsilon Model: Realizable Near Wall Treatment: Scalable Wall Functions
Boundary Conditions:
Inlet: >Type: Pressure-Inlet>Gauge Total Pressure: 10 Pa
Outlet: >Type: Pressure-outlet>Gauge Total Pressure: 0 Pa
Wall: >Type: Wall >Wall Motion: Stationary Wall >Shear Condition:No Slip
Interior: >Type: Interior
Here we have taken Pressure for inlet = 10 Pa.
Typically for Pipe flow, pressure of 10 Pa is acceptable.
In Viscous model, we have taken K-Epsilon model. The Reason behind choosing the K-Epsilon Viscous model is characteristic of the flow, which is turbulent. For Reynolds No. about 2000 and more, flow is turbulent. So we have taken K-Epsilon Viscous model. But here, we have given Pressure Inlet, instead of Velocity Inlet. So knowing the velocity of the flow for correct Reynolds No. is required. So, to know the velocity of the flow, we have to go for initializing the solution. So, go to Solution, and select Standard Initialization, and Initialize from Inlet. After initialization, we can get the correct velocity and calculate the Reynolds No. and from that, we can decide for the appropriate viscous model.
Here, Reynolds No. is 14087.14, which is more than 2000. So the flow is turbulent. So the viscous model will be K-Epsilon. After initialization, create Report Definitions for the report of Mass Flow Rate at the Outlet. Also crate Contours for velocity magnitudes and for Pressure. We also can create animations for the flow of water inside Gate Valve based on Contours. After completing all procedure as described above, run the simulation for about 300 to 500 iterations.
4.PARAMETRIC STUDY
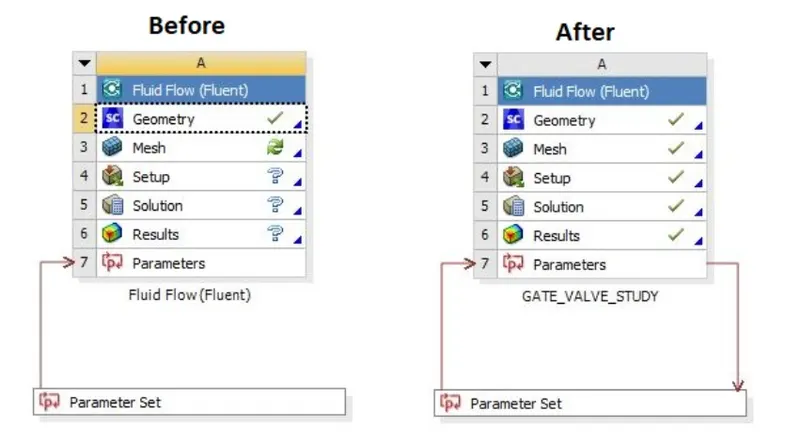
FIG 6:PARAMETRIC STUDY SETUP
In above image we can see the Parameterization of the Lift Parameter before and after Simulation. We can see the Parameter Set for the study at different Design Points of Lift of Gate Valve. On completion of the simulation, select “Parameter Set” and give input for different Design Points. Then Update all Design points and check all the results of different Design points.
In above image, we can see Mass Flow Rate before and after Updating all Design Points. Before Update, we have to give different inputs for the Lift of Gate Disc as 20, 30, 40,50,60,70 and 80 mm and also select the all check boxes in Retain column for all Design Points. Then select on “Update All Design Points”.
These results are calculated by fluent based on the lift of the “Gate Disc”. Now we can check all Design Points one by one for detailed results like Pressure and Velocity Contours, Residuals etc. by selecting each Design Point and making it as “Current”.
Results: Now we will see all cases of lift of “Gate Disc” from 10% to 80% one by one.
We will discuss each case particularly, for all type of results and calculate Flow coefficient and Flow Factor accordingly. Here we will see Mass Flow Rate at Outlet, Flow Coefficient and Flow Factor and required Plots for each opening
Flow Coefficient: The flow coefficient of a device is a relative measure of its efficiency at allowing fluid flow. It describes the relationship between the pressure drop across an orifice valve or other assembly and the corresponding flow rate. Mathematically the flow coefficient Cv (or flow-capacity rating of valve) can be expressed as:
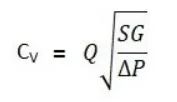
Where:
Q is the rate of flow (expressed in US gallons per minute).
SG is the specific gravity of the fluid (for water = 1).
ΔP is the pressure drop across the valve (expressed in psi).
In more practical terms, the flow coefficient Cv is the volume (in US gallons) of water at 60 °F that will flow per minute through a valve with a pressure drop of 1 psi across the valve. The use of the flow coefficient offers a standard method of comparing valve capacities and sizing valves for specific applications that is widely accepted by industry. The general definition of the flow coefficient can be expanded into equations modeling the flow of liquids, gases and steam using the discharge coefficient.
Flow Factor: The metric equivalent flow factor (Kv; commonly used in Europe and Asia) is calculated using metric units:
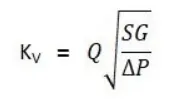
Where:
Kv is the flow factor (expressed in). Q is the flow rate (expressed in cubic meters per hour. SG is the specific gravity of the fluid (for water = 1). ∆P is the differential pressure across the device (expressed in [bar]).
Kv can be calculated from Cv using the equation as given below:
The kv factor of a valve indicates "The water flow in m3/h, at a pressure drop across the valve of 1 kgf /cm2 when the valve is completely open. Cases: Here we will discuss all cases according to opening percentage of “Gate Disc”. According to opening of the valve, given as lift of “Gate Disc” in mm, all details of 8 cases are shown below
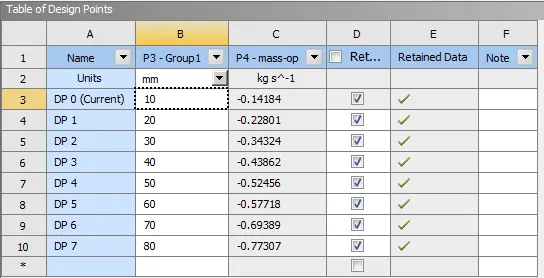
FIG 7:UPDATES DESIGN POINTS
CASE _1: Gate Disc Lift = 10 mm
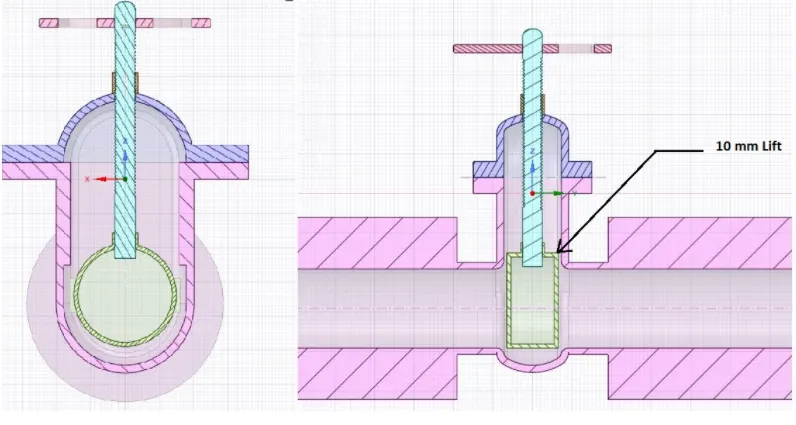
FIG 8:DISK SETUP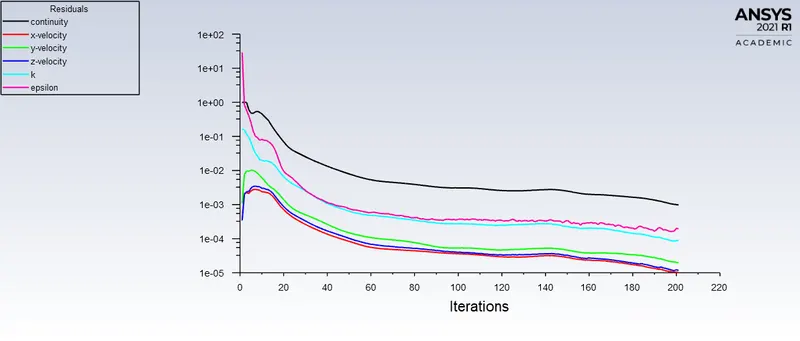
FIG 9:RESIDUALS:
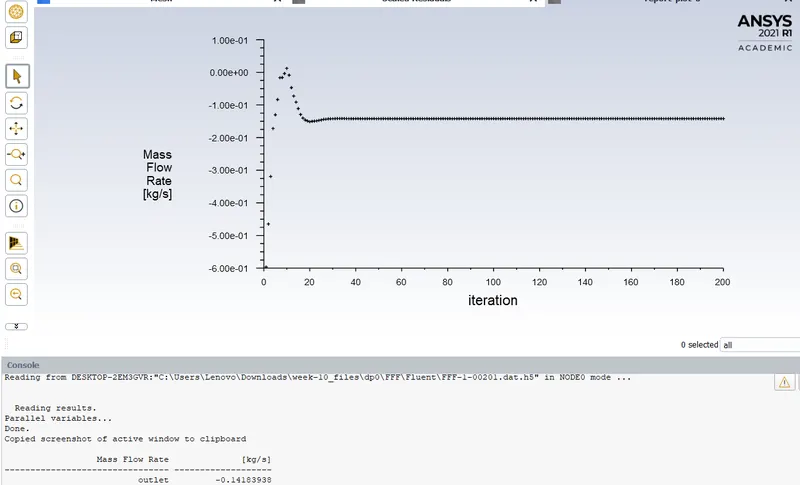
FIG 10:MASS FLOW RATE: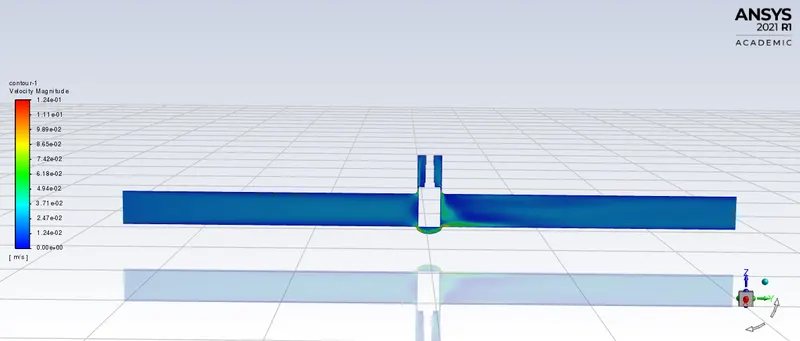
FIG 11:VELOCITY CONTOURS: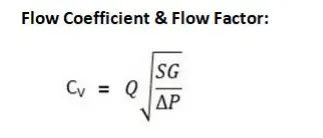
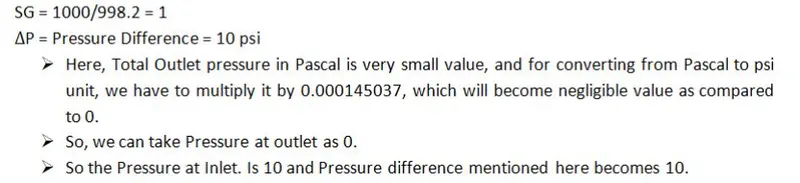
`Cv=0.1418 * (1/10)^(1/2)=0.044`
Cv=0.044
Kv=0.865 x Cv
Kv=0.038
Gate Disc Lift = 20 mm
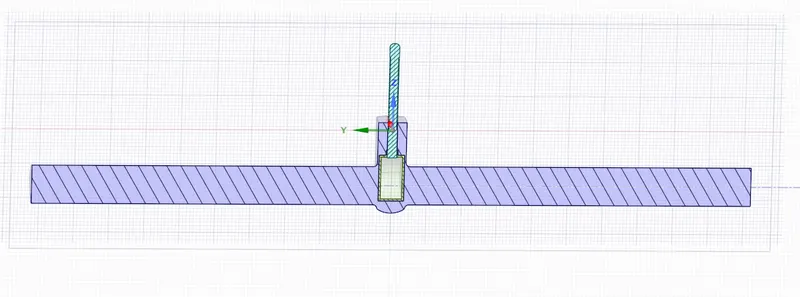
FIG 12: GEOMETRY SETUP CASE II
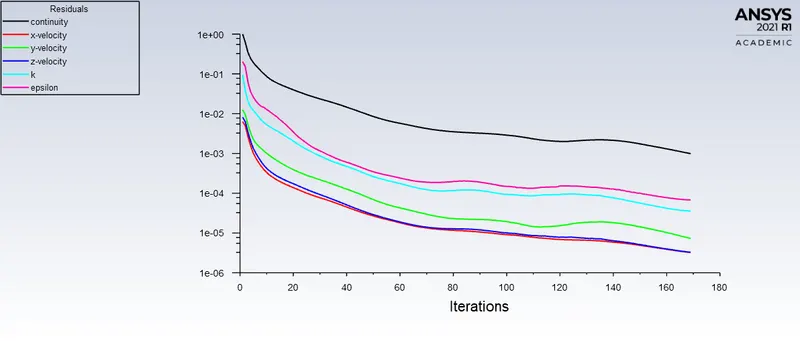
FIG 13:RESIDUALS
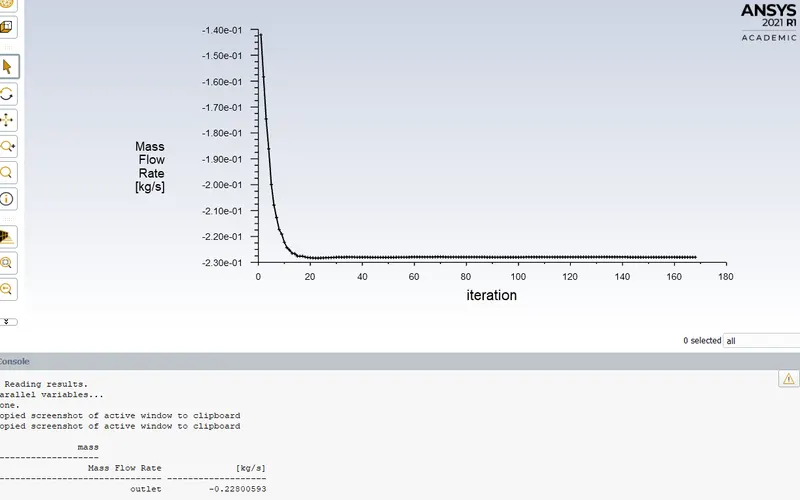
FIG 14:MASS FLOW RATE
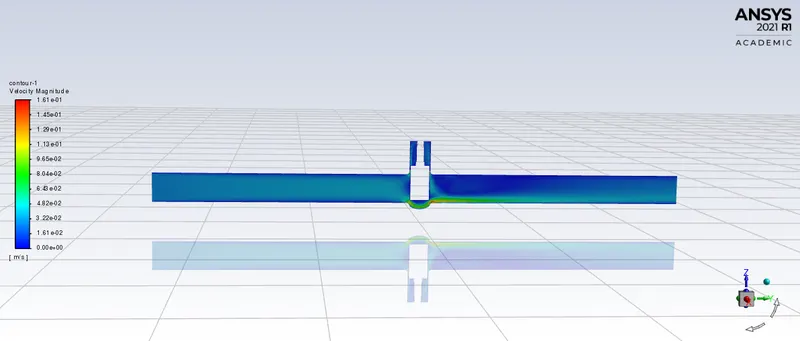
FIG 15:VELOCITY CONTOURS:
`Cv=0.228 * (1/10)^(1/2)=0.072`
Kv=0.865 x Cv
Kv=0.062
Gate Disc Lift = 30 mm
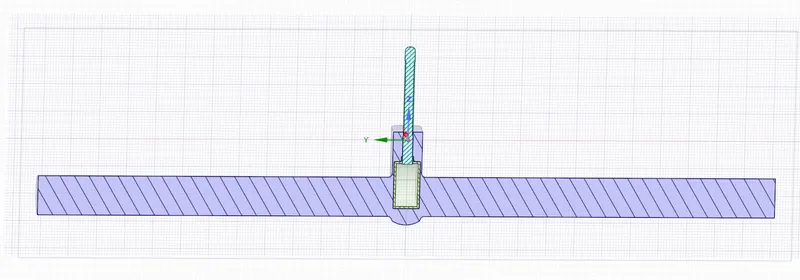
FIG 16: GEOMETRY SETUP CASE III
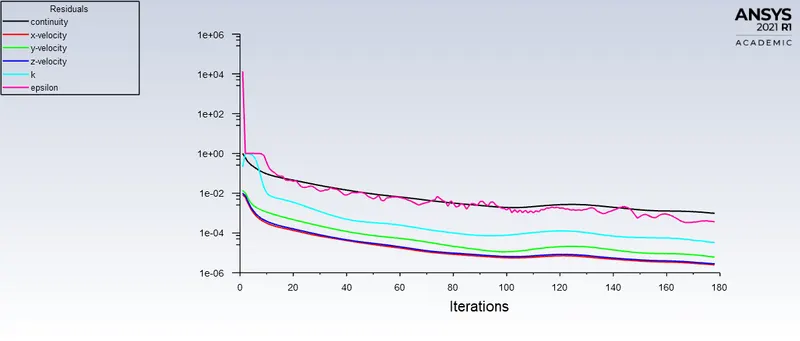
FIG 17:RESIDUALS:
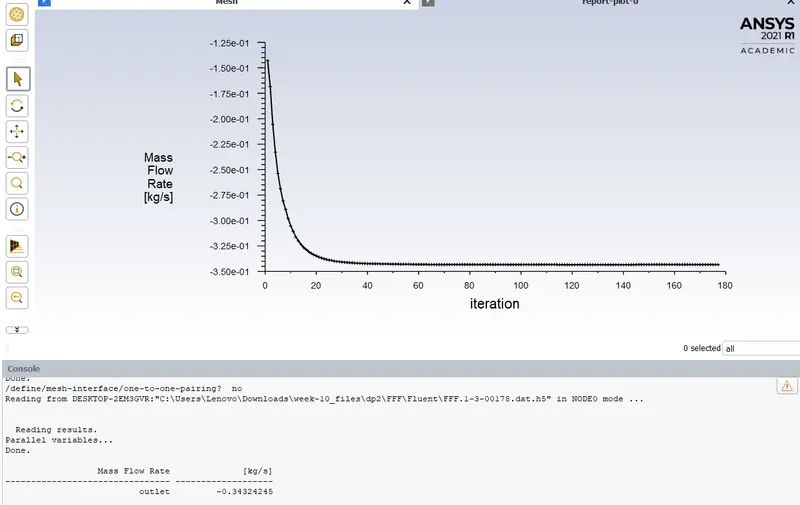
FIG 18:MASS FLOW RATE:
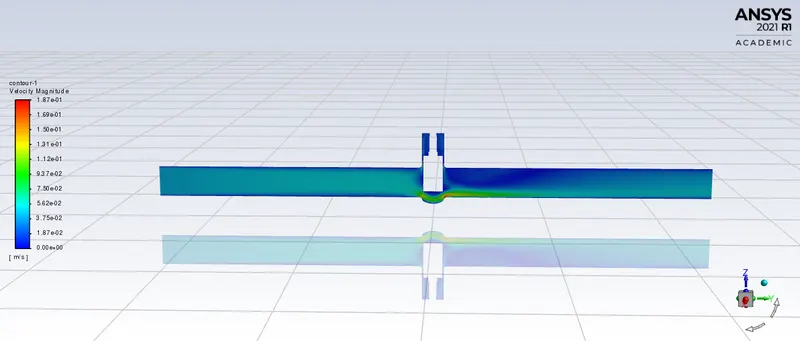
FIG 19:VELOCITY CONTOURS:
`Cv=0.334 * (1/10)^(1/2)=0.105`
`Kv=0.105 *0.865`
Kv=0.091
Gate Disc Lift = 40 mm
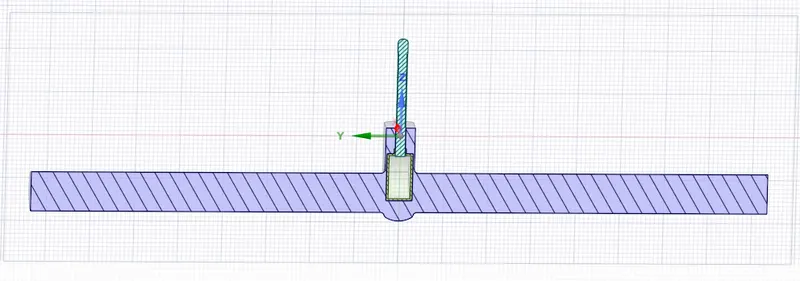
FIG 20: GEOMETRY SETUP CASE IV
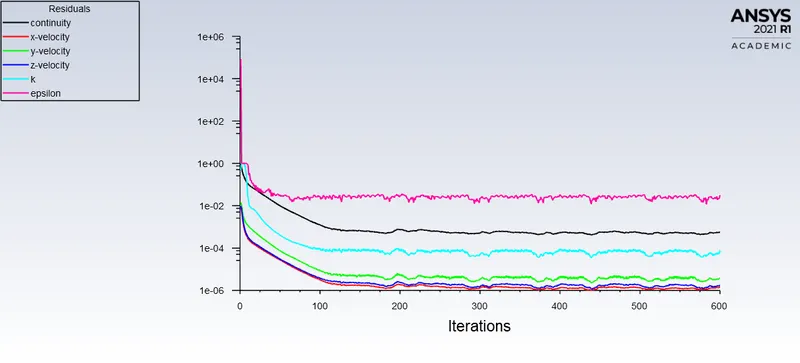
FIG 17:RESIDUALS:
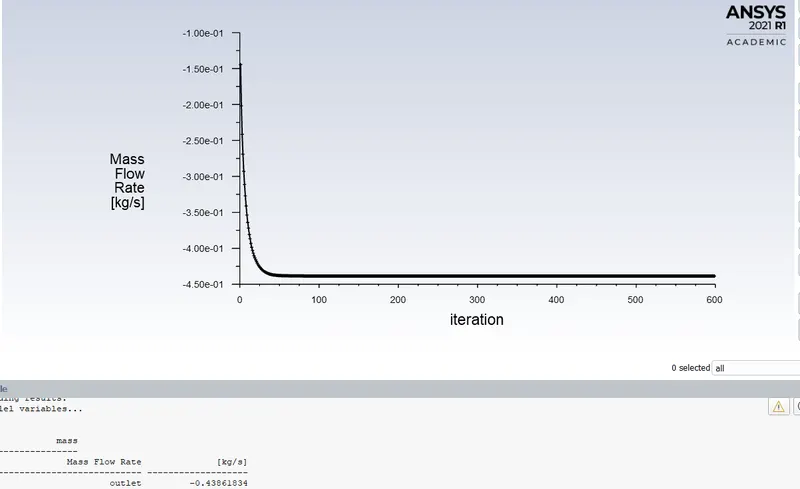
FIG 18:MASS FLOW RATE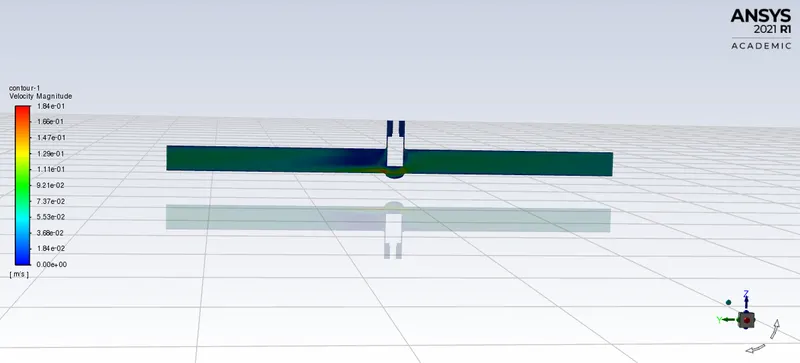
FIG 19:VELOCITY
`Cv=0.438 * (1/10)^(1/2)=0.138`
`Kv=Cv *0.865`
Kv=0.119
Gate Disc Lift = 50 mm
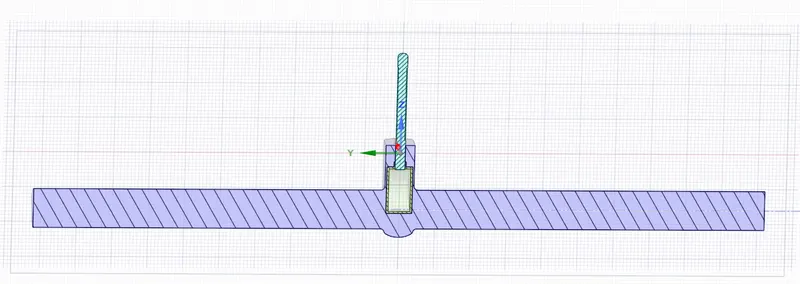
FIG 20: GEOMETRY SETUP CASE V
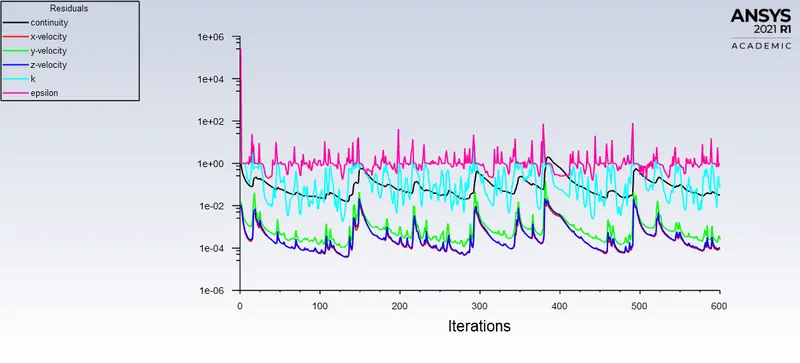
FIG 21:RESIDUALS:
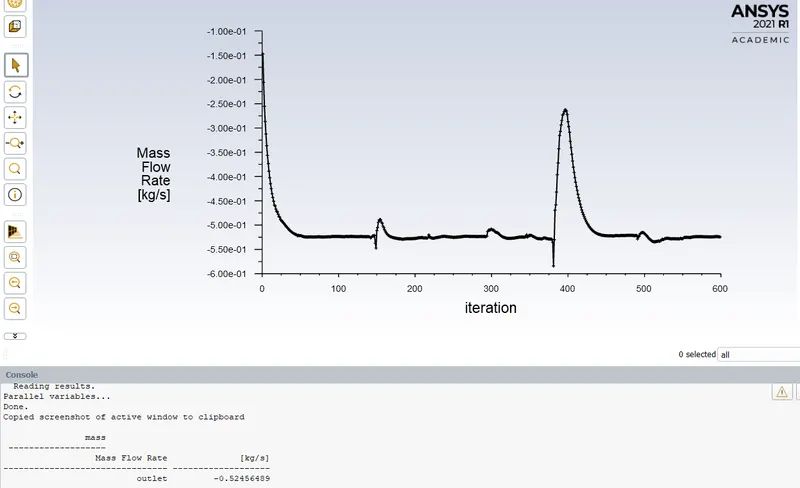
FIG 22: MASS FLOW RATE
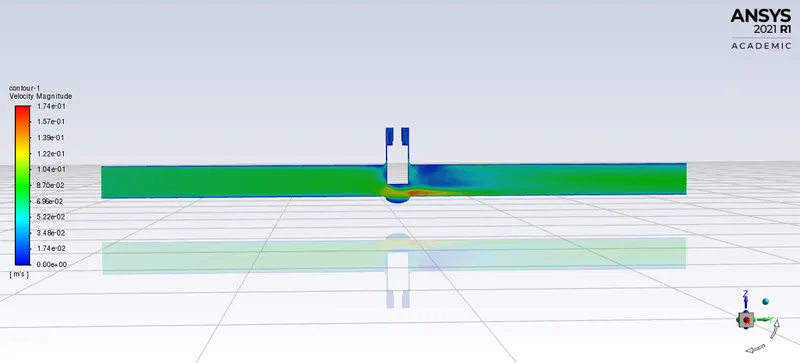
FIG 23:VELOCITY CONTOUR
`Cv=0.524 * (1/10)^(1/2)=0.165`
`Kv=0.165 *0.865`
Kv=0.143
Gate Disc Lift = 60 mm
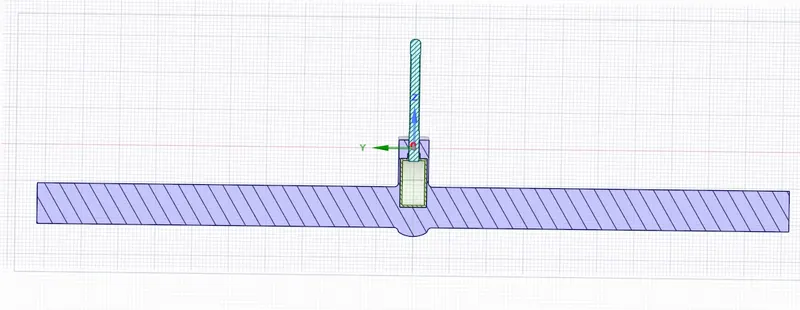
FIG 24: GEOMETRY SETUP CASE VI
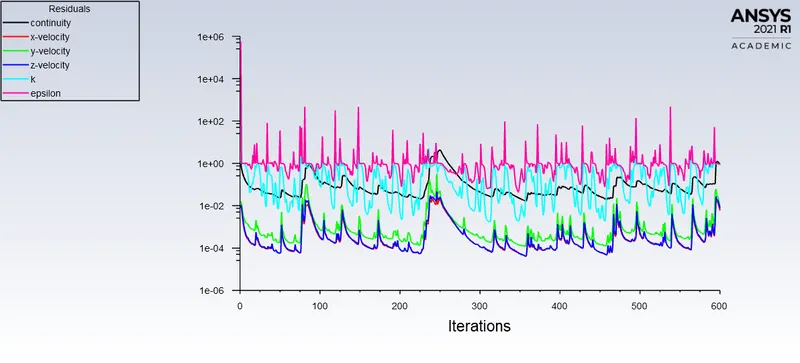
FIG 25: RESIDUALS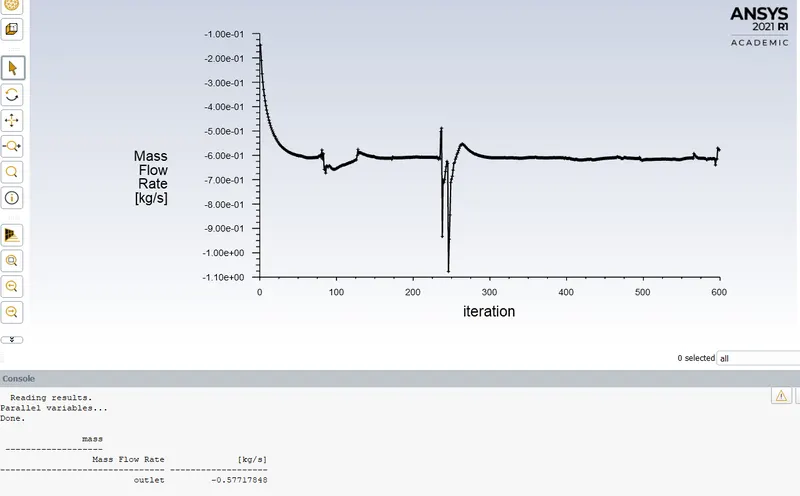
FIG 26:MASS FLOW RATE
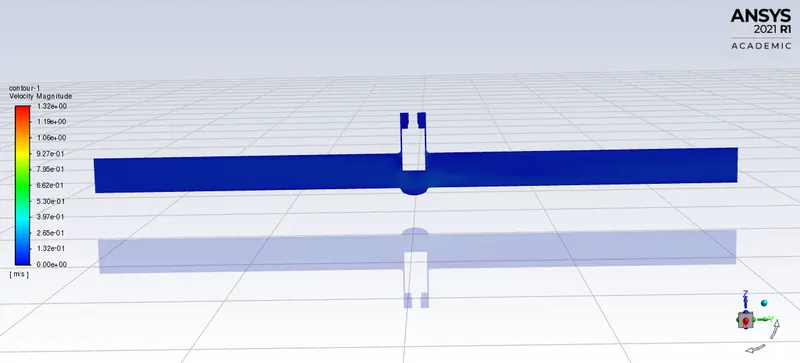
FIG 27:VELOCITY CONTOUR
`Cv=0.577 * (1/10)^(1/2)=0.182`
`Kv=0.182 *0.865`
Kv=0.157
Gate Disc Lift = 70 mm
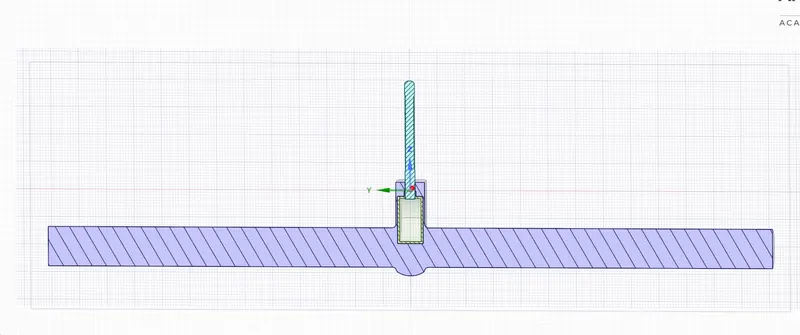
FIG 28: GATE VALVE SETUP FOR CASE VII
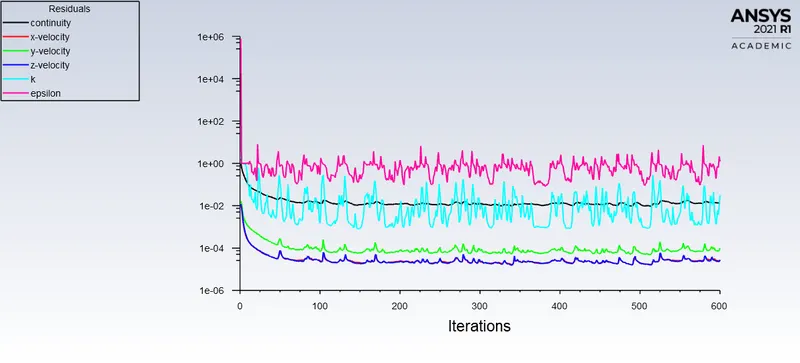
FIG 29: RESIDUALS FOR CASE VII
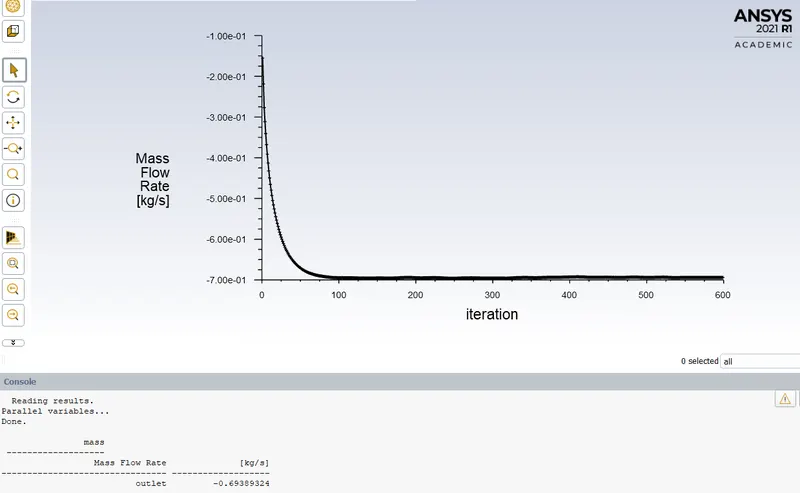
FIG 30:MASS FLOW RATE
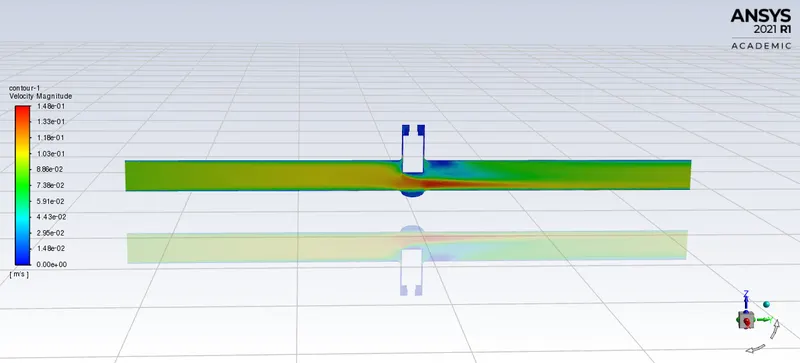
FIG 31: VELOCITY CONTOUR
`Cv=0.693 * (1/10)^(1/2)=0.219`
`Kv=0.182 *0.865`
`Kv=0.189`
Gate Disc Lift = 80 mm
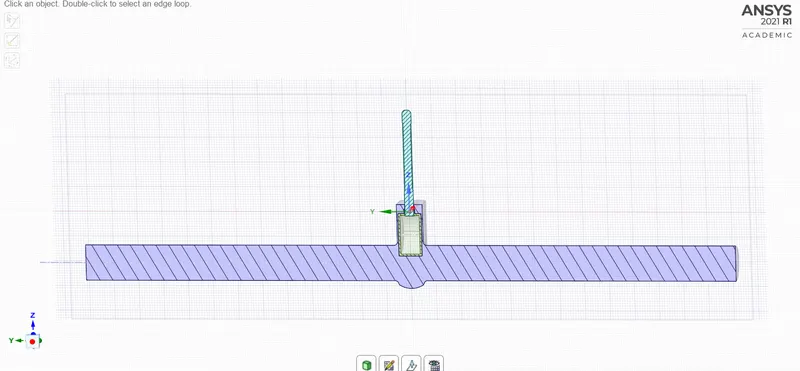
FIG 32: GEOMETRY SETUP CASE VIII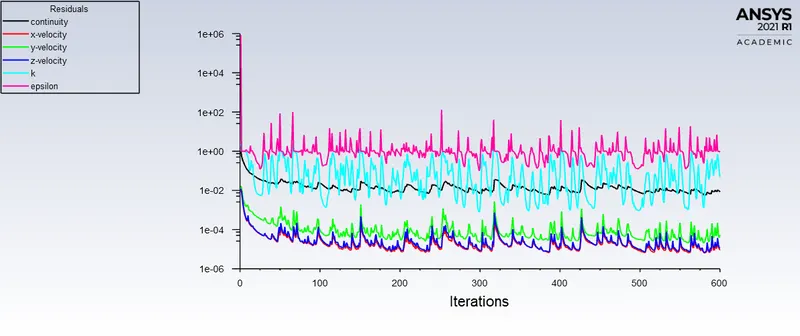
FIG 33: RESIDUALS
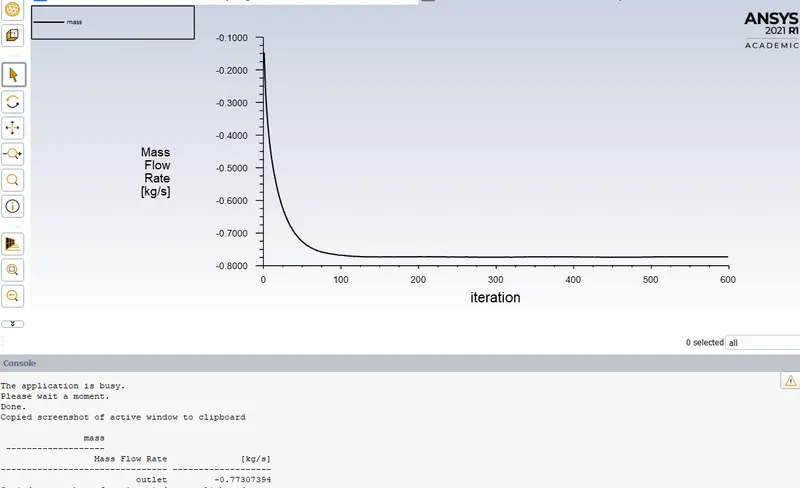
FIG 34:MASS FLOW RATE:
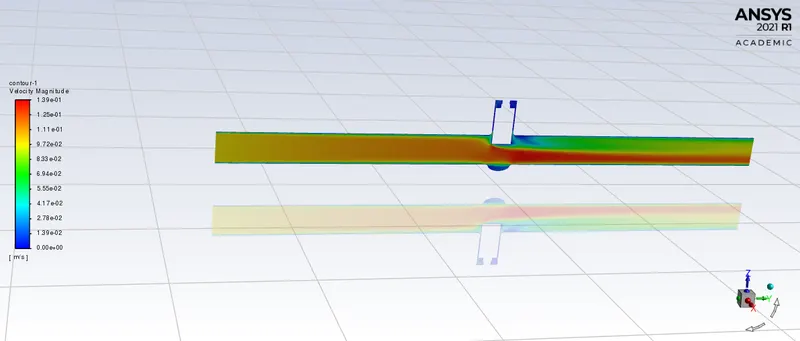
FIG 35:VELOCITY CONTOURS
`Cv=0.773 * (1/10)^(1/2)=0.244`
`Kv=0.182 *0.865`
`Kv=0.211`
OBSERVATIONS: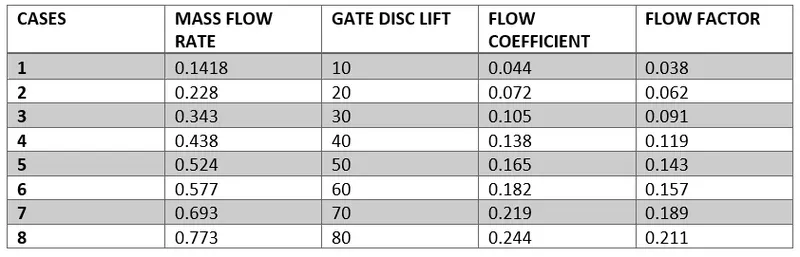
From above Tabular Data and Graphs, we can observe that
As the opening of the Gate Valve or Lift of the Gate Disc increases, Mass Flow Rate increases. With Increases in Mass Flow Rate, there is an increment in Flow Coefficient. Also Increases in Flow Factor is observes at each Design Point from 10 to 80 mm Lift. So, Graph of Mass Flow Rate, Flow Coefficient and Flow Factor go linearly with Gate Disc Opening.
CONCLUSION:
We can conclude from observations that velocity in the first case is very low. As opening or lift of the Gate Disc increases, velocity of the flow increases. We can observe that at the front or inlet side of the valve, pressure is high. As flow passes through the valve opening, it decreases. And at the outlet there are no any restrictions to the flow, so pressure becomes 0. It means there is minimum Pressure Drop. There is a gradual increase in Mass Rate, Flow Coefficient and Flow Factor as Lift of the Gate Disc increases, or from 10% to 80%, or 10 mm 80 mm.
When the valve if fully open, Mass Flow rate and Flow Coefficient and Flow Factor becomes maximum. Thus, parametric study helps to analyze the different positions of valve opening and gives the benefit to get easily and quick results.
References:
https://en.wikipedia.org/wiki/Gate_valve
https://en.wikipedia.org/wiki/Flow_coefficient