Week 9 - Parametric study on Gate valve.
Aim:
to study parametric study on gate valve for various stages of opening of gate disc.
Objectives:
To perform a parametric study on the gate valve simulation by setting the opening from 10 % to 80%.
- Obtain the mass flow rates at the outlet for each design point.
- Calculate the flow coefficient and flow factor for each opening and plot the graph.
- Discuss the results of the mass flow rate and flow coefficient.
Theory:
Parametric study:
study based on the method of changing few parameters like velocity, geomentrical lift is known as parametric study. here we can simualte and find results like mass flow rate and efficiency for many variations in a short period of time.
Gate valve:
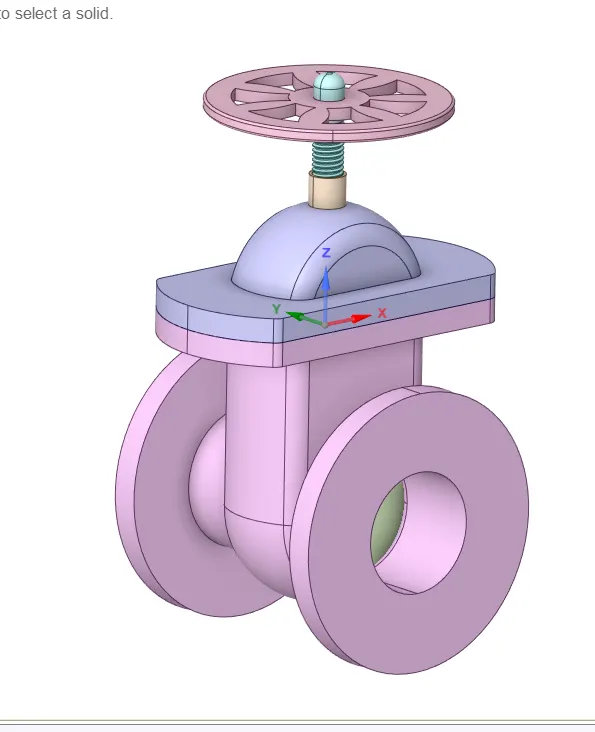
A gate valve, also known as a sluice valve, is a valve that opens by lifting a barrier (gate) out of the path of the fluid. Gate valves require very little space along the pipe axis and hardly restrict the flow of fluid when the gate is fully opened. The gate faces can be parallel but are most commonly wedge-shaped (in order to be able to apply pressure on the sealing surface).
Gate valves work by inserting a rectangular gate or wedge into the path of a flowing fluid. They are operated by a threaded stem which connects the actuator (generally a hand wheel or motor) to the stem of the gate.
Bonnets provide leakproof closure for the valve body.
Flow-Factor(kv):
Kv is the flow coefficient in metric units. It is defined as the flow rate in cubic meters per hour [m3/h] of water at a temperature of 16º celsius with a pressure drop across the valve of 1 bar. Cv is the flow coefficient in imperial units.
Flow-coefficient(Cv):
The coefficient of flow (Cv) is a formula which is used to determine a valve's flows under various conditions and to select the correct valve for a flow application. The Cv was designed for use with liquid flows, it expresses the flow in gallons per minute of 60º F water with a pressure drop across the valve of 1 psi.
Cv=Q.√(Sg/ΔP)
Cv is in [ kg/s, psi]
where Q = mass flow rate in kg/s
Sg = Specific gravity of water which is equal to 1
DeltaP = Change in pressure or pressure drop across valve
Relation between Kv and Cv:
Kv = Cv*0.865 or Cv=Kv*1.156
simulation:
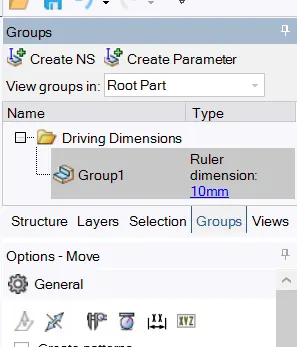
- import the component in space claim and by using pull option lift the gate disc by 10mm and set it as parameter.
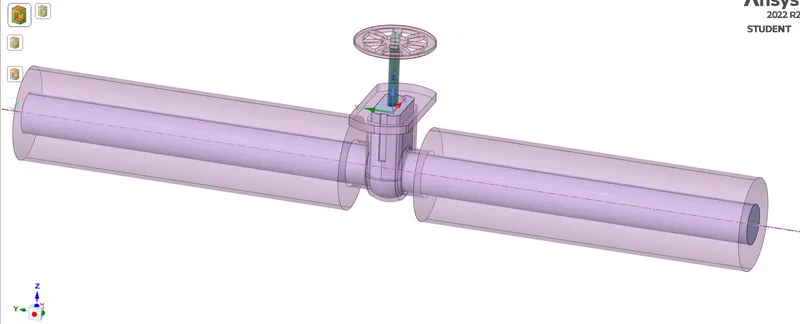
- suppress for physics the components
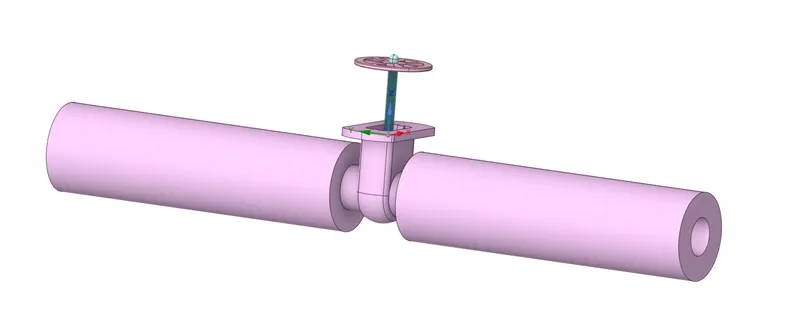
- use pull option to 800mm both sides
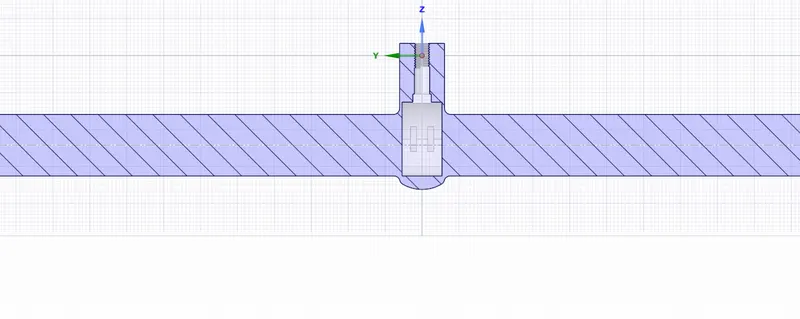
- extract volume by using extract option check for cross section as shown
- open mesh and generate mesh with 5mm mesh size
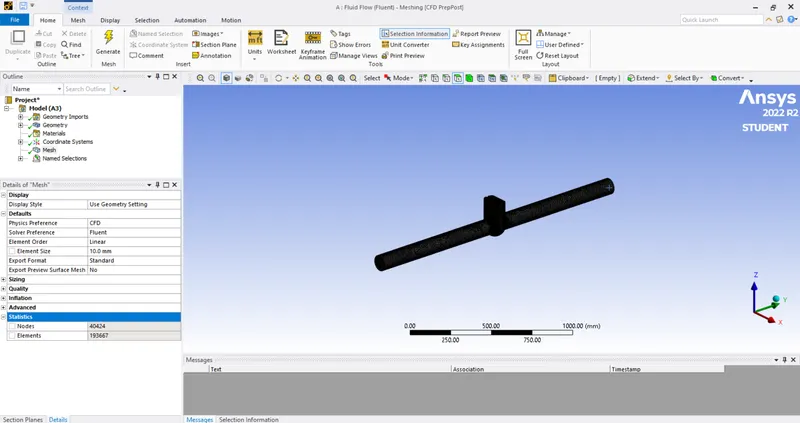
- open setup and set garvity as 9.81m/s2
- set for steady state solver and set cell zone as water.
- set boundary condition as inlet >> pr. inlet>>10Pa
- viscous>>k-epsilon>>realizable>>scalable wall function
- set defenition>>flux report>>mass flow rate>>outlet and also create velocity contour on midplane
- calculate flow coefficient and flow factor using formulas
- open parameter>>give parameters and update design points simultaneously and compare results
observation:
taking first case 10mm lift
residual plot:
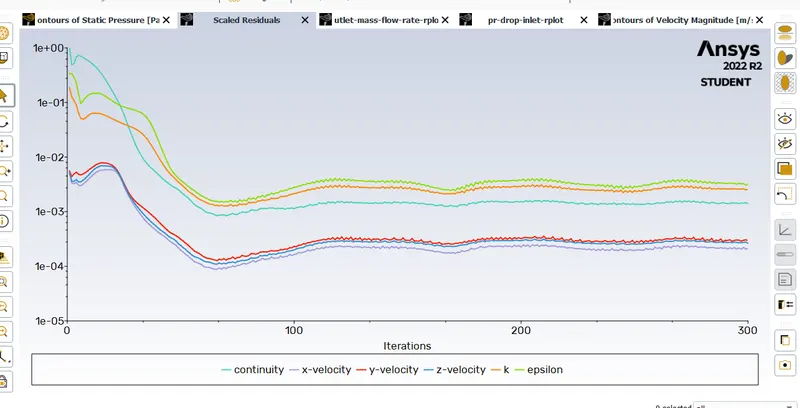
mass flow rate
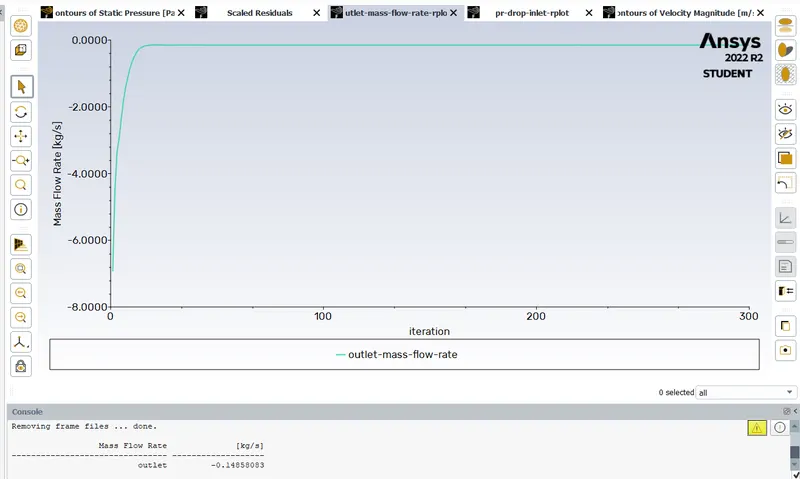
mass flow rate= -0.148 kg/s
(negative sign is indicates that mass is leaving the output )
velocity contour:
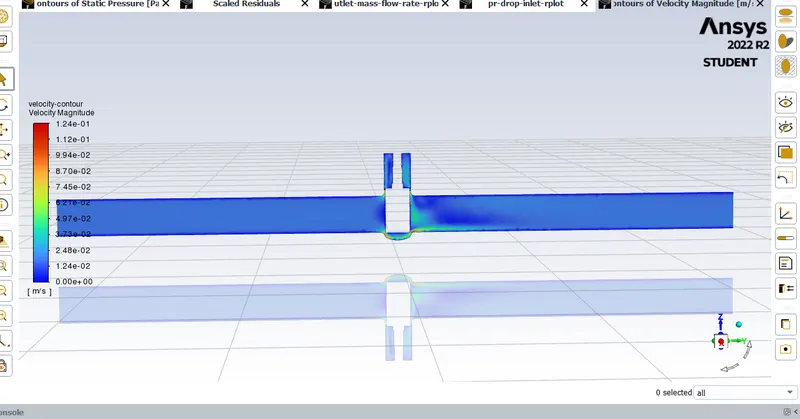
pr contour:
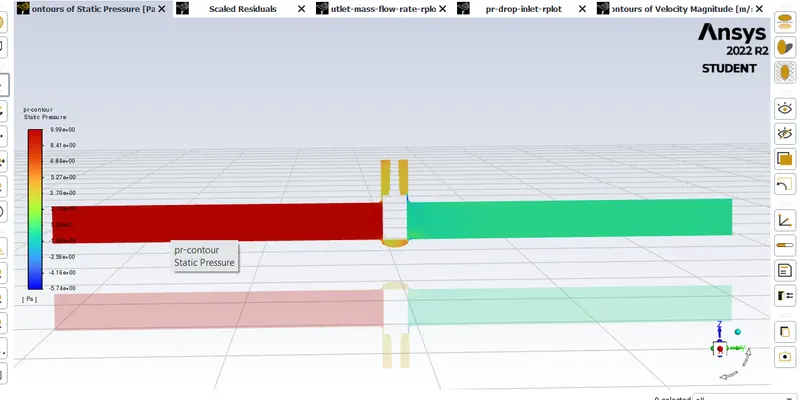
for above results we got
Mass flow Rate Q= 0.148 kg/s
we know that 1kg/s = 15.85 gpm
hence Q= 0.148 x 15.85 = 2.3458 gpm
and also specific gravity of water = 1
and pr drop = 10psi
hence flow coefficient Cv = 2.3458√(1/10)
hence Cv= 0.7418
we know that flow factor Kv= 0.865 Cv
Kv= 0.865 x 0.7418
Kv= 0.641663
similiarly by using parameter option we can calculate flow rate of different opening levels as shown
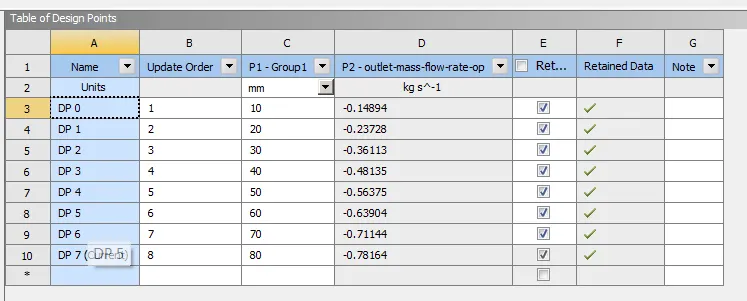
by formulas following table datas are obtained
| LIFT | MASS FLOW RATE KG/S | Q GPM | FLOW COEFFICIENT Cv | FLOW FACTOR Kv |
| 10 | 0.148 | 2.345 | 0.741 | 0.641 |
| 20 | 0.237 | 3.756 | 1.187 | 1.026 |
| 30 | 0.361 | 5.721 | 1.808 | 1.564 |
| 40 | 0.481 | 7.623 | 2.409 | 2.083 |
| 50 | 0.564 | 8.939 | 2.824 | 2.443 |
| 60 | 0.639 | 10.128 | 3.200 | 2.768 |
| 70 | 0.711 | 11.269 | 3.561 | 3.080 |
| 80 | 0.782 | 12.394 | 3.916 | 3.387 |
LET US PLOT THE OBTAINED VALUES ON THE GRAPH
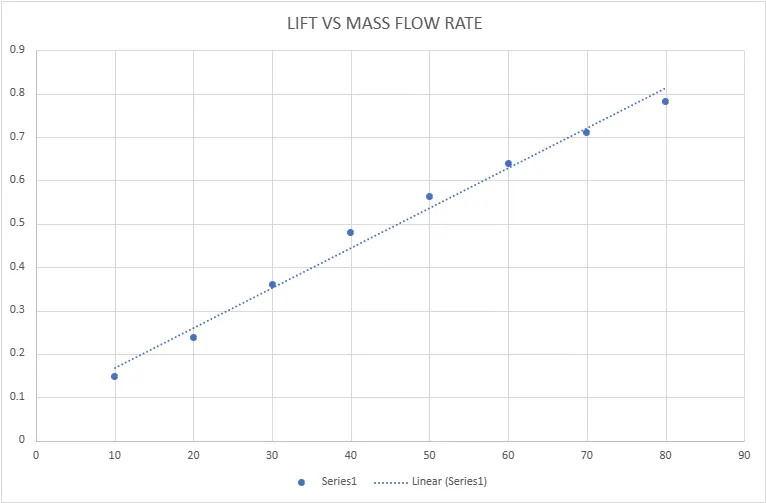
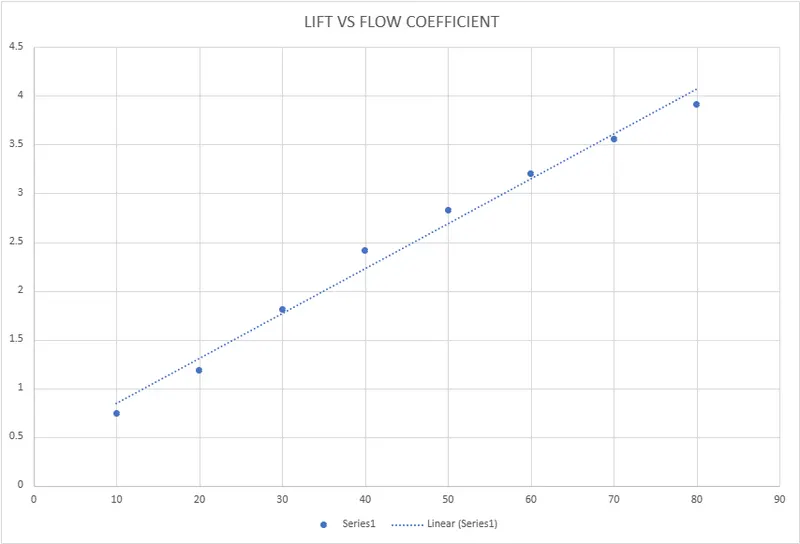
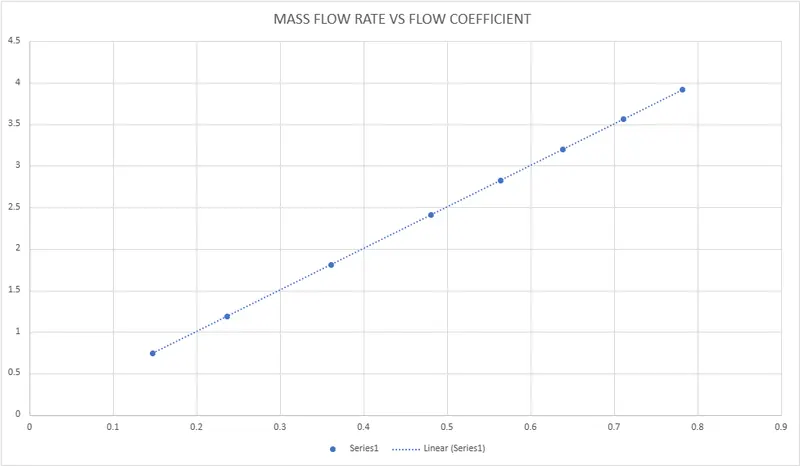
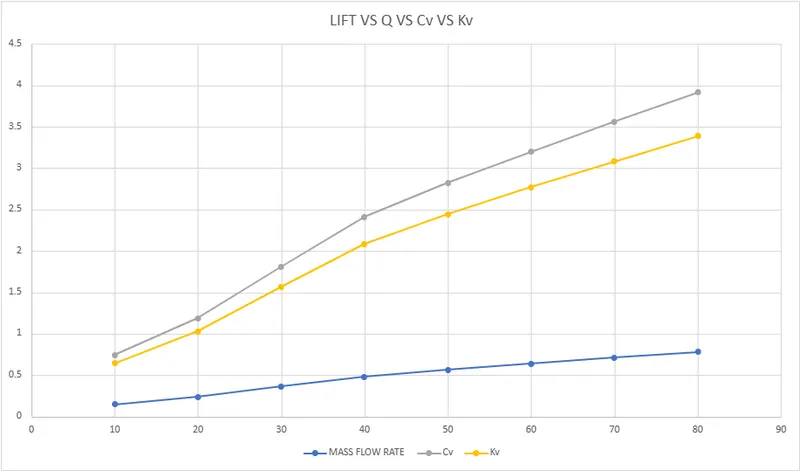
The mass flow rate is increases with the increase in the valve opening and also the flow coefficient of wach case & flow factor also increases as well.
- The graph compares the flow coefficient & flow factor with valve opening. It is clearly visible that the both quantity increases parallely with amount of opening.
`