Week 9 - Parametric study on Gate valve.
Aim: Parametric study on Gate valve.
Objective:
- Perform parametric study on gate valve by setting the opening from 10% to 80%
- Obtain the mass flow rates at the outlet for each design point.
- Calculate the flow coefficient and flow factor for each opening and plot the graph.
- Discuss the results of the mass flow rate and flow coefficient
Gate valve:
A gate valve, also known as a sluice valve, is a valve that opens by lifting a barrier (gate) out of the path of the fluid. Gate valves require very little space along the pipe axis and hardly restrict the flow of fluid when the gate is fully opened. The gate faces can be parallel but are most commonly wedge-shaped (in order to be able to apply pressure on the sealing surface).
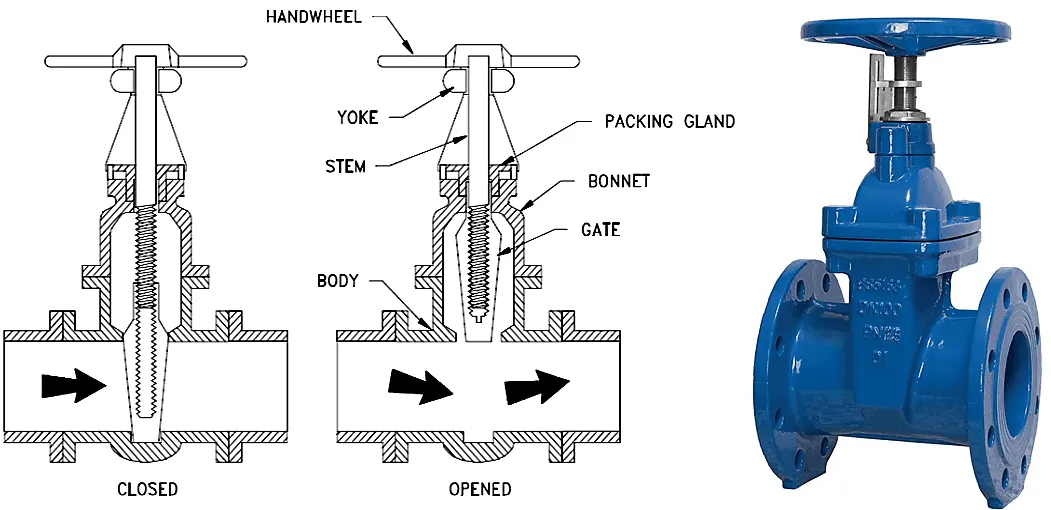
A gate valve is the most common type of valve that used in any process plant. It is a linear motion valve used to start or stop fluid flow. In service, these valves are either in fully open or fully closed position. When the gate valve is fully open, the disk of a gate valve is completely removed from the flow.
Geometry:
Geometry which was provided has been increased in length by value of 800 mm on both face so that fluid volume and fluid flow analysis can be carry out.
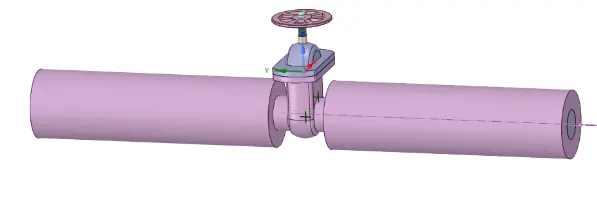
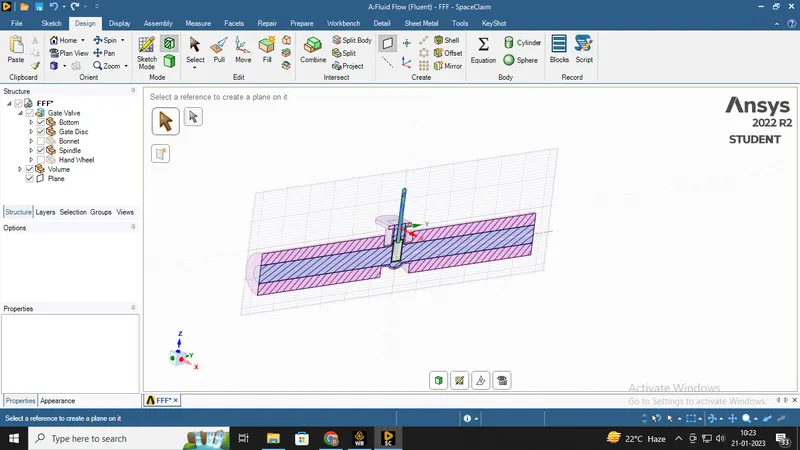
Section view along plane of geometry:
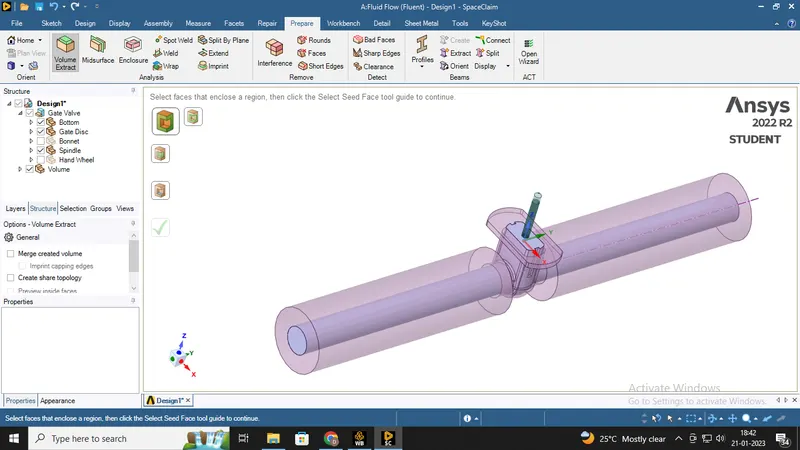
Extracted fluid volume:
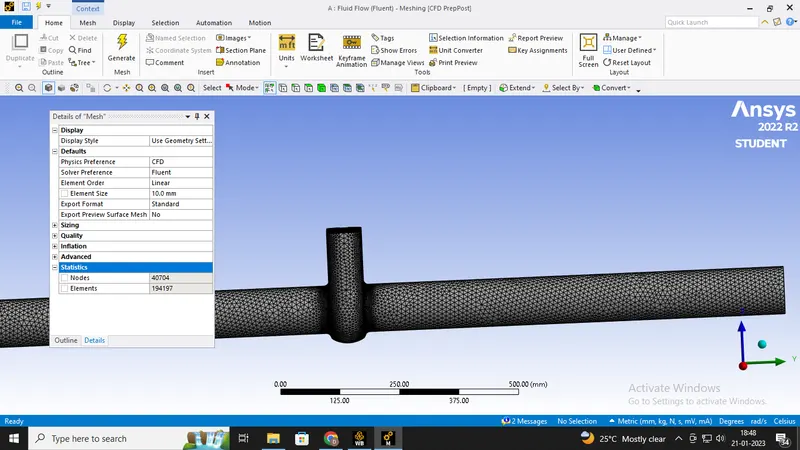
Meshing:
Mesh size=10mm
Number of elements=194197
Model setup:
- Solver type: Pressure based
- Time steady : Steady
- Enable gravity with - 9.81 m/s2 on required axis
- Turbulence model: K epsillon > Realizable > enhanced wall treatment
- Fluid material: Water
- Cell zone : volume-volume > fluid > water
Boundary conditions:
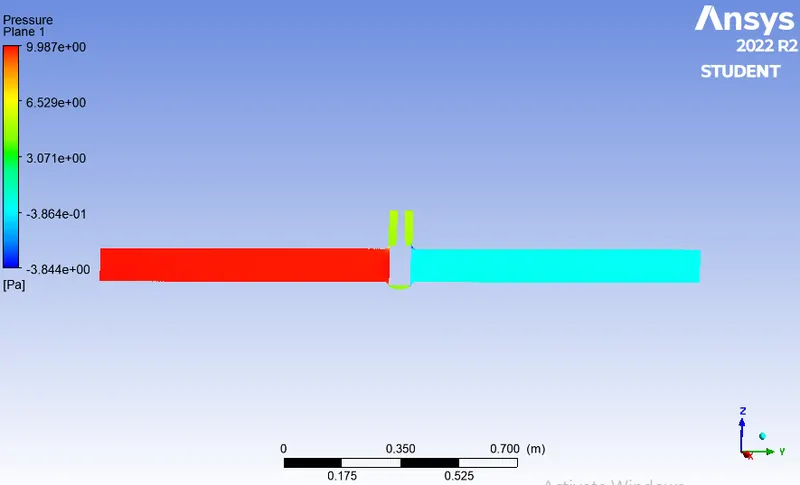
- Inlet> pressure inlet = Gauge total pressure 10 Pascal
- Outlet>pressure outlet = Gauge total pressure 0 Pascal
Initialization : Hybrid
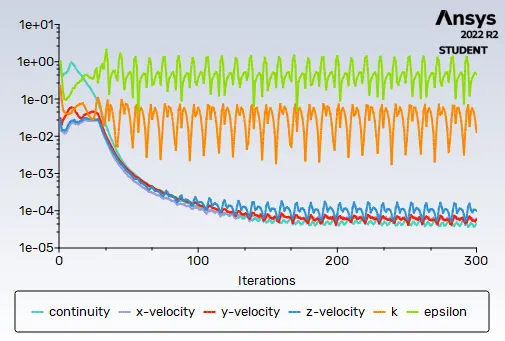
Run iterations = 300
Parametric study results:
Case 1 : Lift 10 mm
Residual plots:
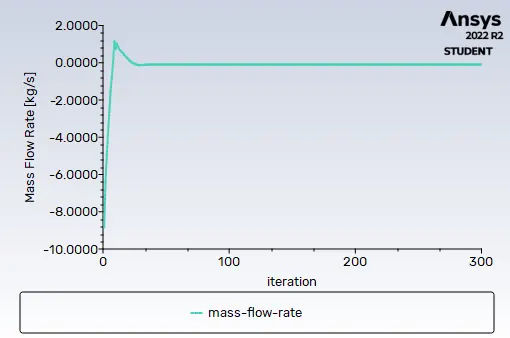
Mass flow rate
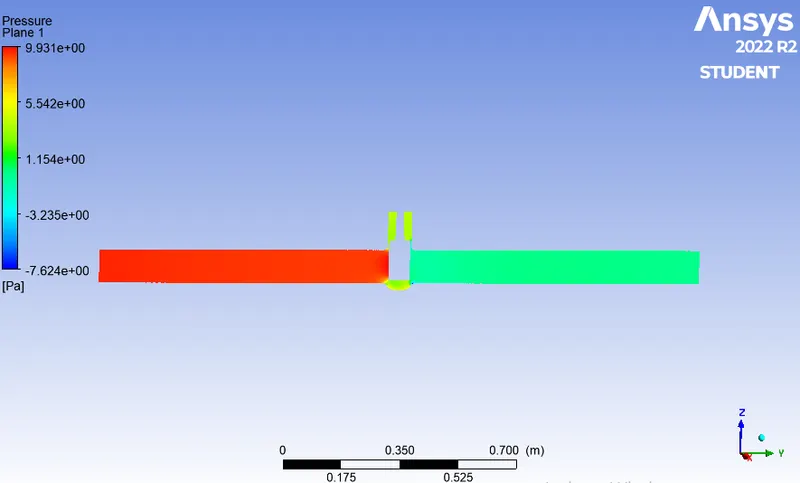
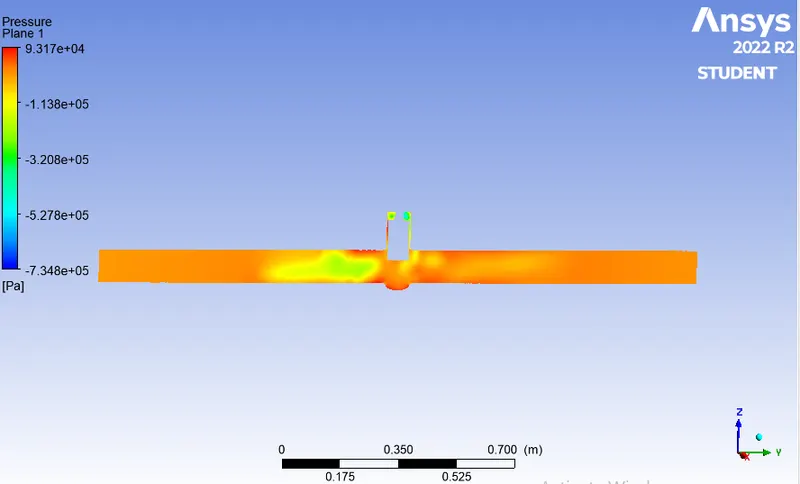
Pressure contour
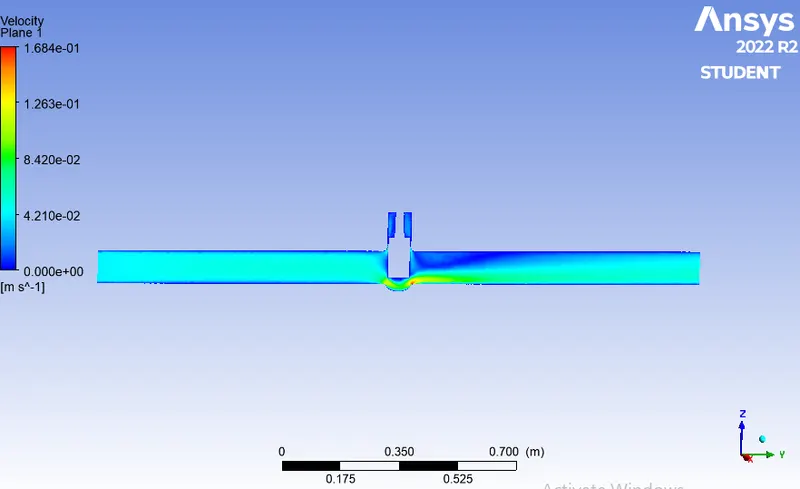
Velocity contour
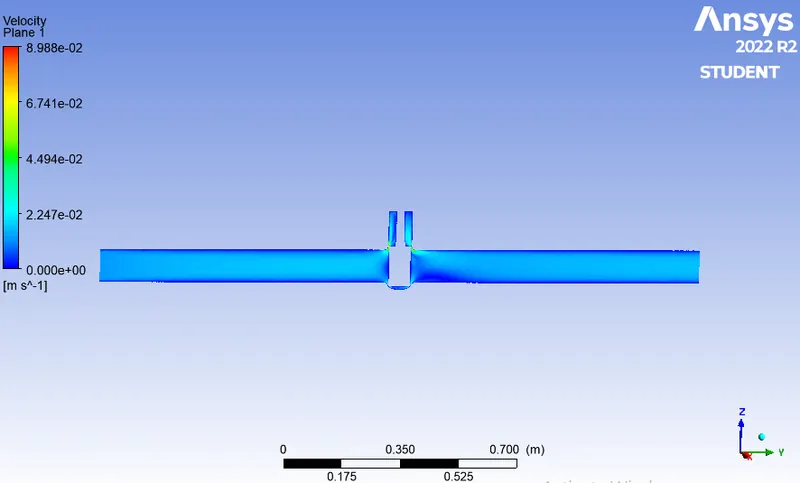
Case 2 : Lift 20 mm
Residual plots:
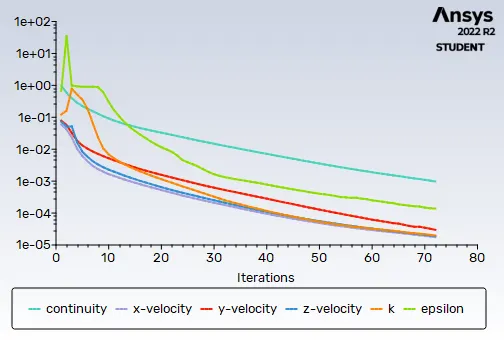
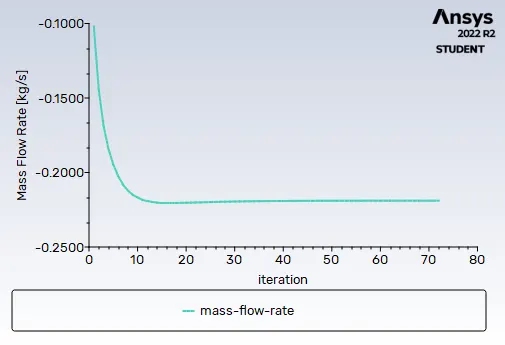
Mass flow rate
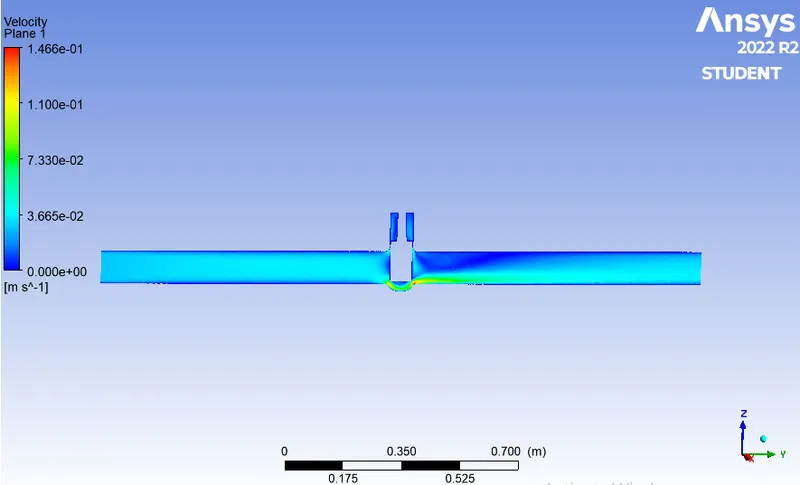
Velocity contour
Pressure contour
Case 3 : Lift 30 mm
Residual plots:
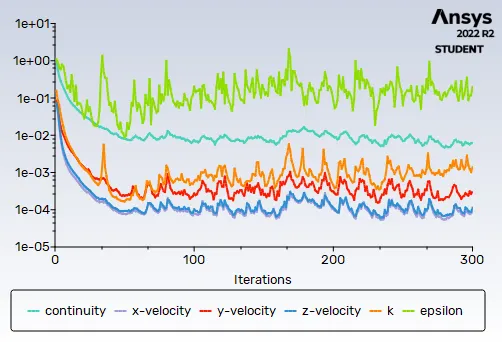
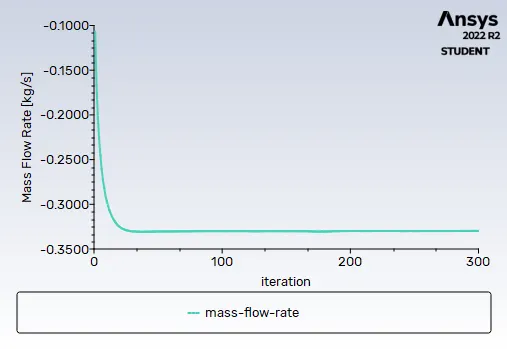
Mass flow rate
Velocity contour
Pressure contour
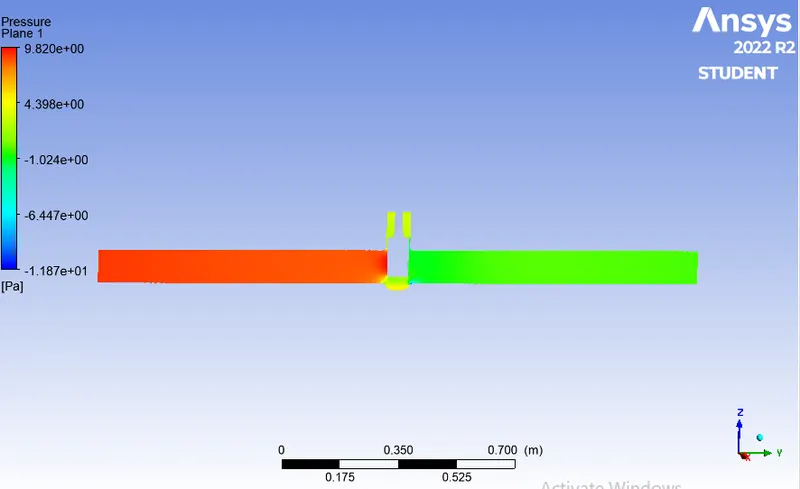
Case 4 : Lift 40 mm
Residual plots:
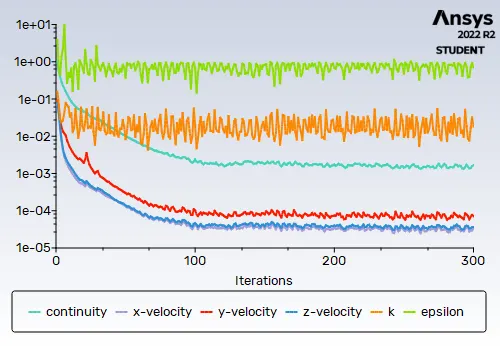
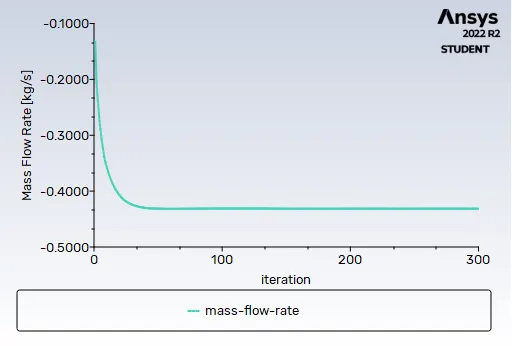
Mass flow rate
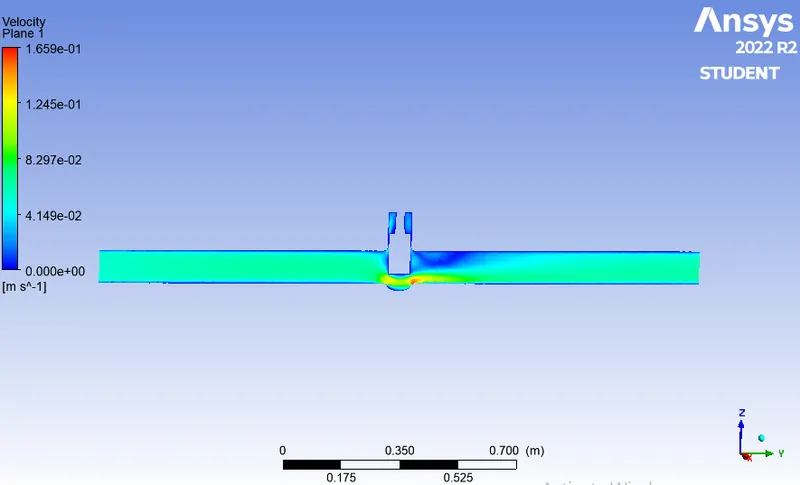
Velocity contour
Pressure contour
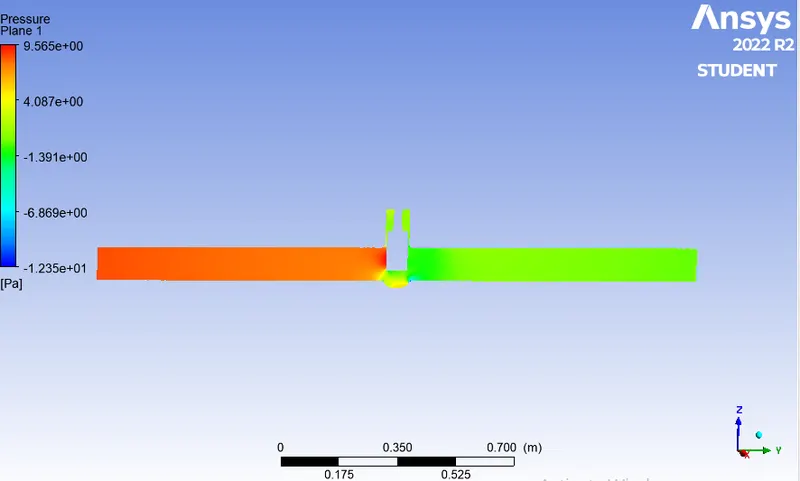
Case 5 : Lift 50 mm
Residual plots:
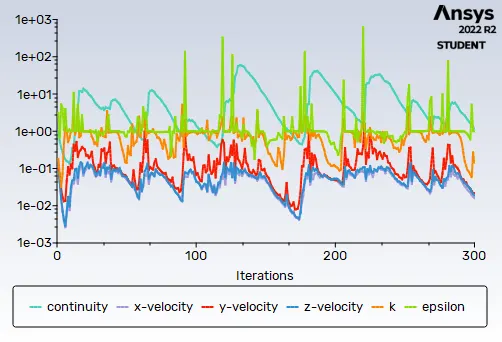
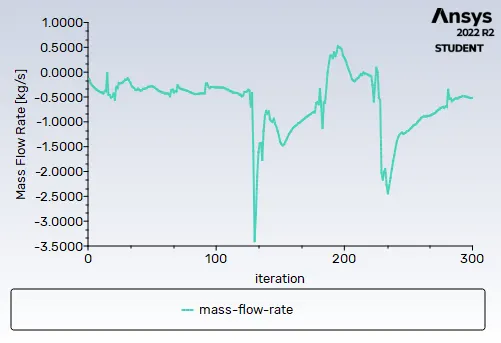
Mass flow rate
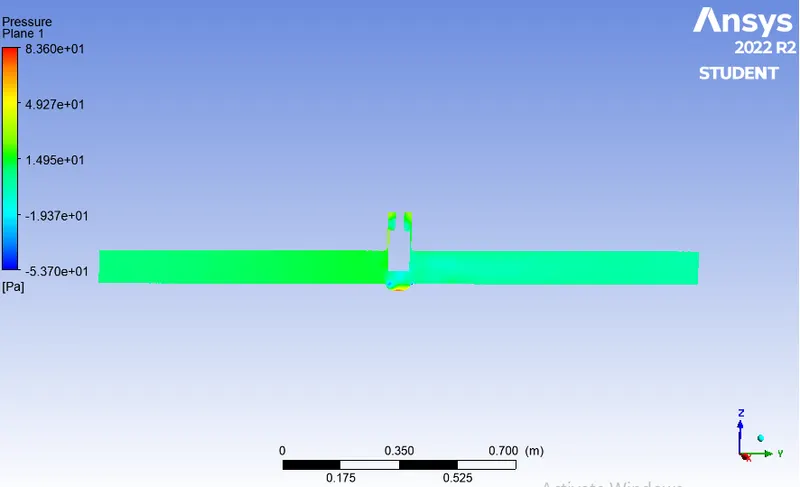
Pressure contour
Velocity contour
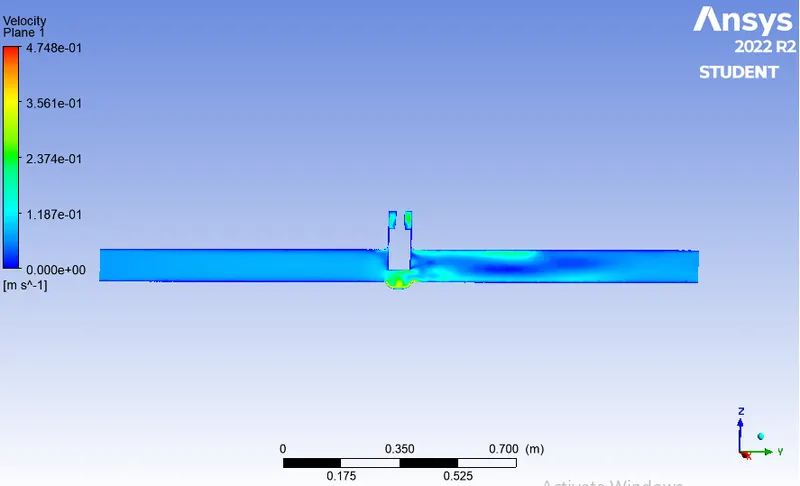
Case 6 : Lift 60 mm
Residual plots:
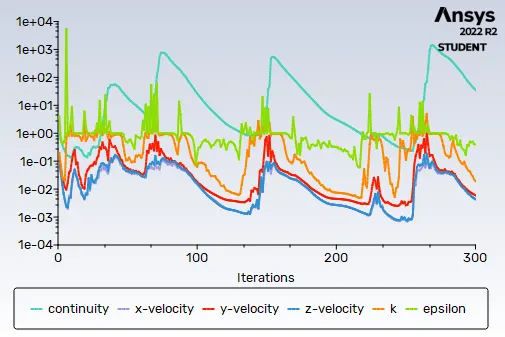
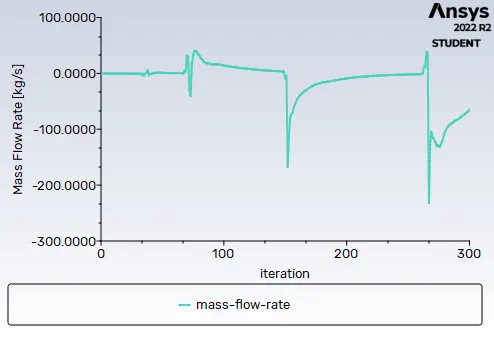
Mass flow rate
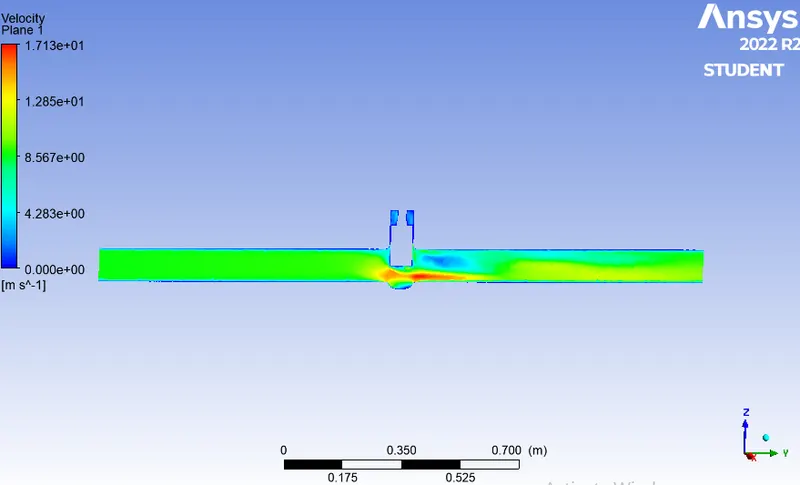
Velocity contour
Pressure contour
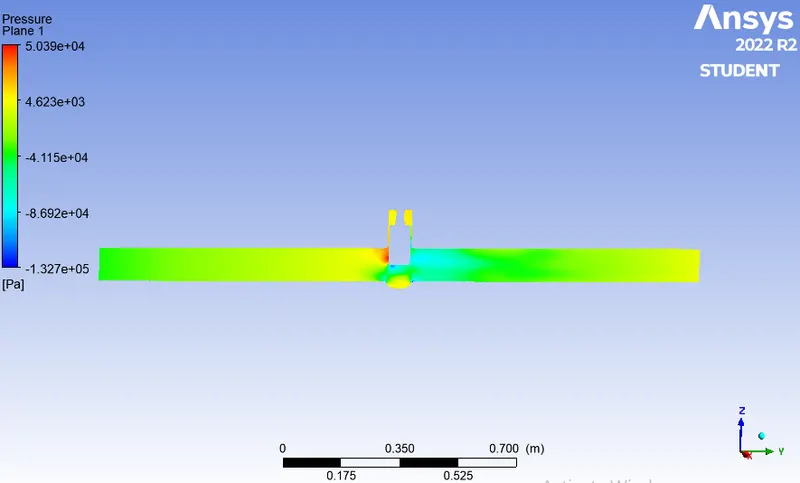
Case 7 : Lift 70 mm
Residual plots:
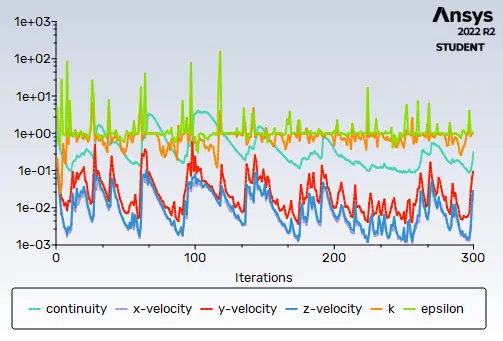
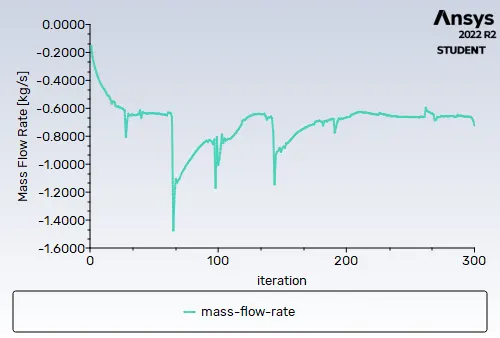
Mass flow rate
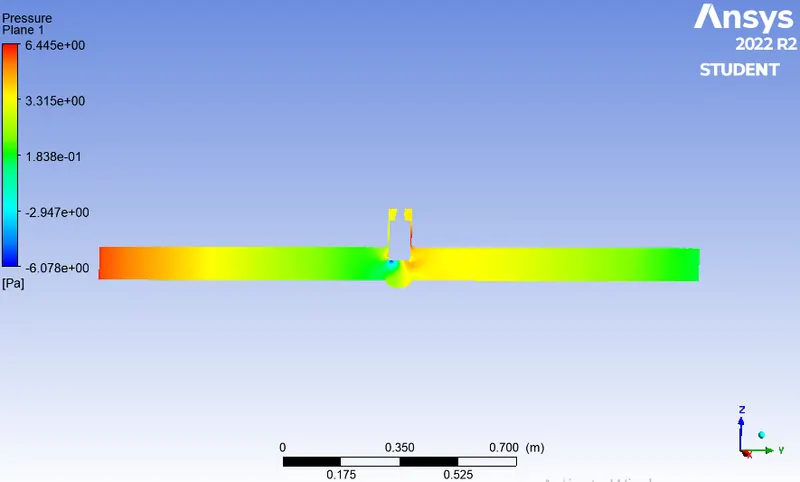
Pressure contour
Velocity contour
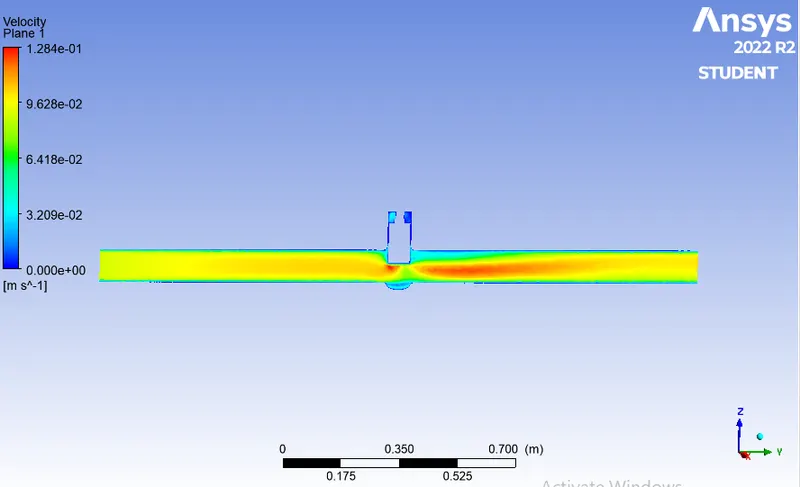
Case 8 : Lift 80 mm
Residual plots:
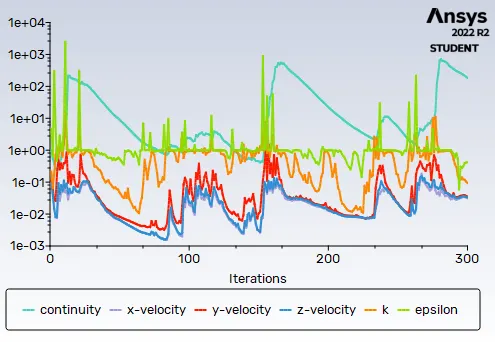
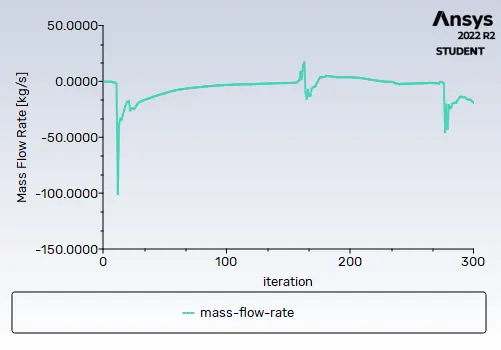
Mass flow rate
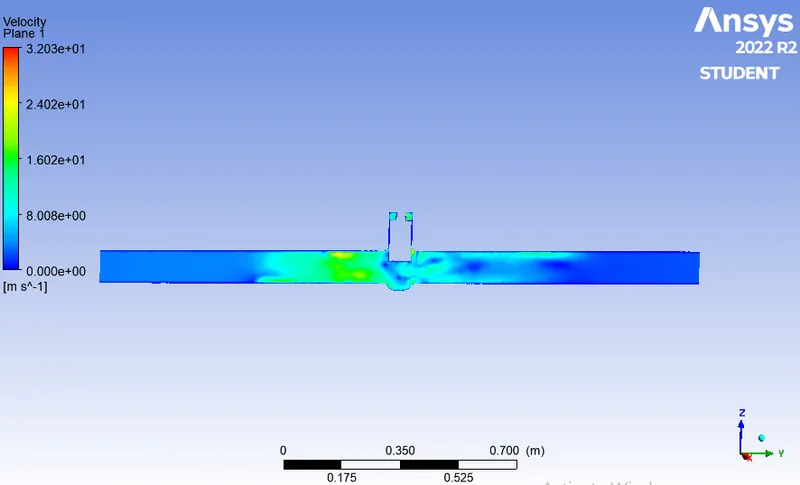
Velocity contour
Pressure contour
Flow-Factor(kv):
Kv is the flow coefficient in metric units. It is defined as the flow rate in cubic meters per hour [m3/h] of water at a temperature of 16º celsius with a pressure drop across the valve of 1 bar. Cv is the flow coefficient in imperial units.
Flow-coefficient(Cv):
The coefficient of flow (Cv) is a formula which is used to determine a valve's flows under various conditions and to select the correct valve for a flow application. The Cv was designed for use with liquid flows, it expresses the flow in gallons per minute of 60º F water with a pressure drop across the valve of 1 psi.
Cv=Q.√(Sg/ΔP)
Cv is in [ kg/s, psi]
where Q = mass flow rate in kg/s
Sg = Specific gravity of water which is equal to 1
DeltaP = Change in pressure or pressure drop across valve
Relation between Kv and Cv:
Kv = Cv*0.865 or Cv=Kv*1.156
|
Lift (mm) |
Pressure (inlet) |
Pressure (outlet) |
Pressure drop (pa) |
Q (kg/s) |
Cv |
Kv |
|
1 |
10 |
0 |
10 |
0.095 |
0.030042 |
0.025986 |
|
2 |
10 |
0 |
10 |
0.219 |
0.069254 |
0.059904 |
|
3 |
10 |
0 |
10 |
0.329 |
0.104039 |
0.089993 |
|
4 |
10 |
0 |
10 |
0.431 |
0.136294 |
0.117894 |
|
5 |
10 |
0 |
10 |
0.516 |
0.163173 |
0.141145 |
|
6 |
10 |
0 |
10 |
0.658 |
0.208077 |
0.179987 |
|
7 |
10 |
0 |
10 |
0.721 |
0.228 |
0.19722 |
|
8 |
10 |
0 |
10 |
0.910 |
0.287767 |
0.248918 |
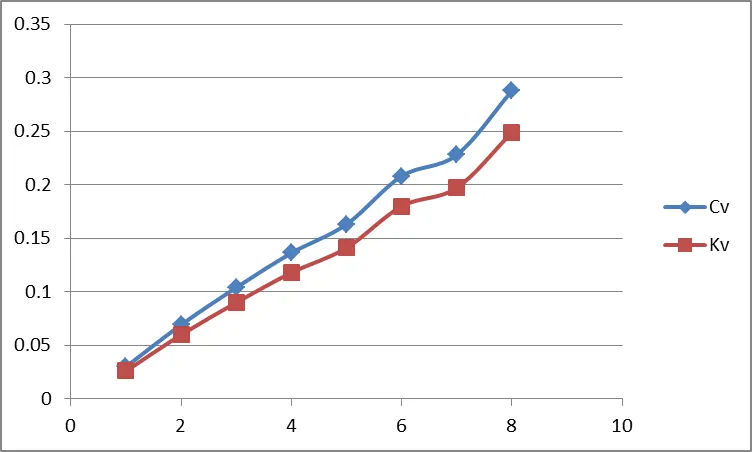
Graphical Analysis :
Conclusion:
- The negative sign in the mass flow rate term comes due to mass leaving at the outlet.
- Parametric study helps a lot to reduce the solving time in studying the effect of change of parameters on the system.
- From Graphical analysis we can say that, As lift of the gate valve is increased, increase in mass flow rate of fluid is observed.
- As flow rate is increased, flow factor (Kv) increases as a result of which flow co-efficient (Cv) also increased.