Week 9 - Parametric study on Gate valve.
Parametric study on the gate valve
Objective-
To perform a parametric study on a gate valve at different valve opening settings.
Introduction-
The gate valve is the fluid valve that opens by lifting the barrier gate from the path of the fluid flowing through a pipeline. Gate valves require generally very less space and are and can be fitted along the pipe axis and they hardly restrict any fluid flow when they are fully opened. The schematic of the gate valve can be seen below-
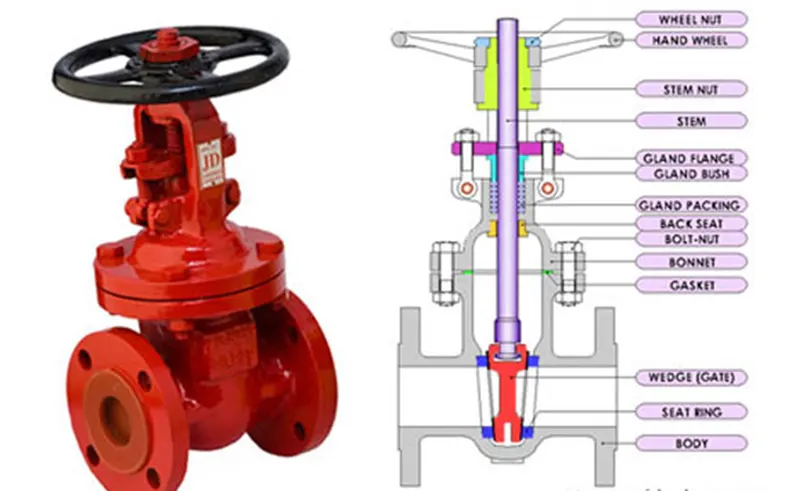
Gate valves are generally used to shut off the fluid flow inside a pipe line and also to control the fluid flow. When they are fully opened they hardly restrict any fluid flow, thus offering very low flow resistance when fully opened. Gate valves are generally used for the pipe of diameters larger than that of 2" to the largest pipes. They are simpler to construct in large sizes.
Generally in pipelines with high pressure the gate valve opening can be quiet difficult due to the high force exerted on the gate. So they are generally connected with a smaller bypass valve to release the pressure and then they are operated.
When the gate is fully opened there is no restriction to the flow hence the pressure drop is low comparatively. Generally, the gate valve are fully closed or fully open as partially opened valve may experience vibration which may lead to excessive wear. A gate valve's main component is body, seat, gate, stem, bonnet, and actuator. The primary mechanism is straight forward where the hand wheel is rotated to move the gate up and down via threads. They require more than a 360-degree turn to fully open the valve.
Parametric study allows you to nominate parameters for evaluation, define the parameter range, specify the design constraints, and analyze the results of each parameter variation. When you have the configurations generated you can then evaluate your simulation. You can further refine the parameters or design constraints until satisfied with the results. Once you determine that a configuration satisfies your design needs, you are able to promote that configuration back to the model as a CAD edit. You are prompted whether to make changes. Using the parametric study method saves a lot of time in the simulations which require to perform the same operations for different settings multiple times.
A parametric study requires the following:
- Design Objective is set to Parametric Dimensions
- Parameters nominated for use in the simulation
- Parameter ranges identified
- Design criteria specified
- Various configurations generated
Flow coefficient and Flow factor-
The flow coefficient (Cv) of a device is a relative measure of its efficiency at allowing fluid flow. It describes the relationship between the pressure drop across an orifice valve or other assembly and the corresponding flow rate.
It is the volume of water in U.S. gallons per minute that passes through the valve at a pressure drop of 1 PSI at 68oF. Cv is in imperial units; in metric units, the same coefficient (often known the flow factor) is Kv and corresponds to the flow rate of water in cubic meters (m3) per hour at a pressure drop of 100KPa (1bar) at 20o C.
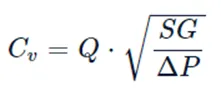
where Q is the rate of flow (expressed in US gallons per minute)
SG is the specific gravity of the fluid (SG for water= 1)
ΔP is the pressure drop across the valve (expressed in psi).
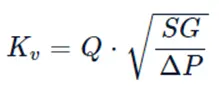
where: Q is the rate of flow (expressed in m^3/h)
SG is the specific gravity of the fluid (SG for water= 1)
∆P is the pressure drop across the valve (expressed in bar).
Cv can be calculated from Kv using the equation: Cv = 1.156 * Kv
Procedure-
Modelling-
The model of the gate valve is shown below-
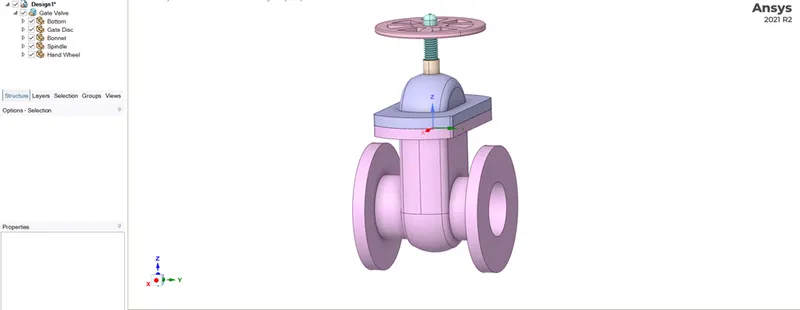
As you can see, the model contains of different parts like bottom, gate disc, bonnet, and spindle and hand wheel.
Initially, we have increased the pipe length both the sides to see the contour clearly. For this, we have to use pull tool and pull the left and right surface of the gate valve.
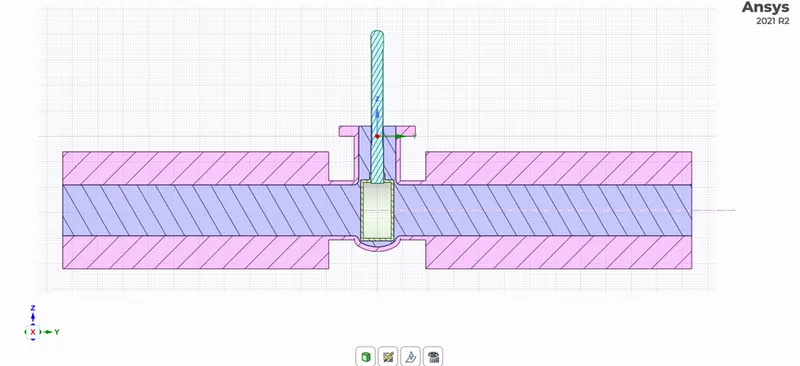
Now, we have to extract the fluid volume by using volume extract tool. Here, there are 3 edges by which we can select the volume. You can see the extracted volume (gray color) in the cut section of the model in the image below-
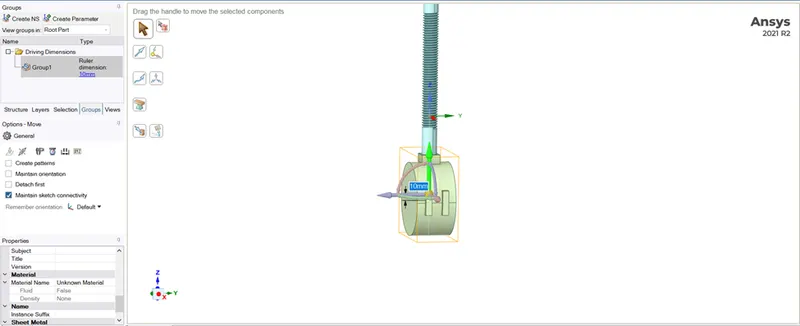
Now, to create the parameter of the opening of the gate disc, we have to use the move tool on gate disc. Now, select move tool and click on ‘select component’ and select gate disc and input value 10mm in z-direction. After giving input, go to ‘create parameter’ under ‘groups‘ tab besides the structure tab.
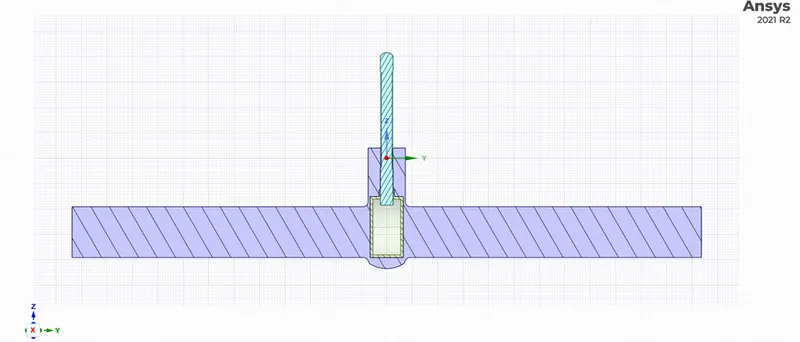
After that right click on volume under the extracted volume and select ‘update volume body as context’ to update the fluid volume. You can see the changed gap between the gate disc and wall in the below image-
Now, we have to suppress for physics all the components except the fluid volume.
Meshing-
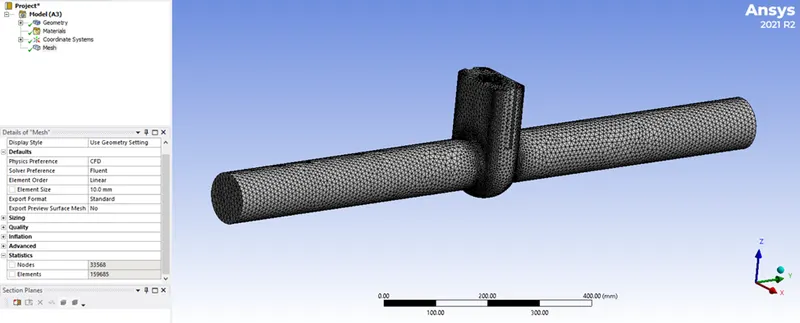
The mesh size is 10mm and the total number of elements is 159685. The meshed model of fluid volume of gate valve is shown below-
Now, name the inlet and outlet surface of the fluid volume.
Pre-Processing and Solver Setting:
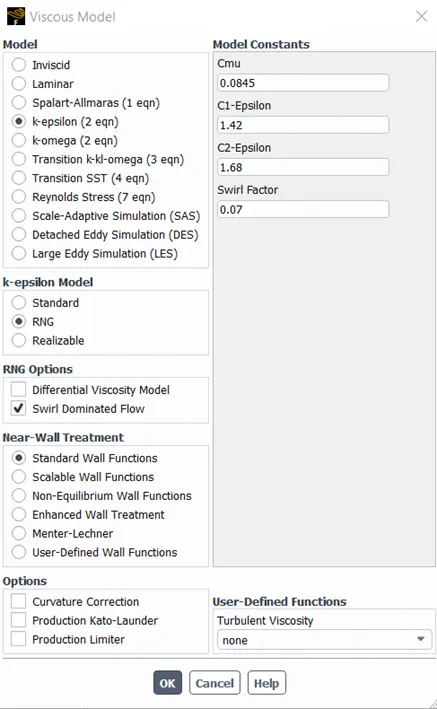
Here, we are using solver type as pressure based and steady solver. Also, we have to enable gravity in –z direction. Then, select viscous model as K-epsilon model. Here, we have used coupled method for solving the equation.
Since in this simulation there is formation of swirling action of fluid so we have to select swirl dominated flow after selecting RNG model under K-epsilon model.
Now, create material as water by copying liquid-water from fluent database.
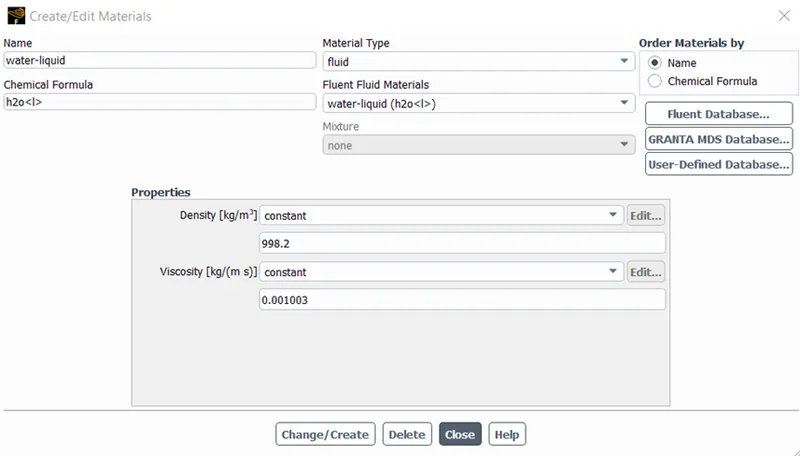
Now, we have to delete the air as material. Before we do that, first we have to change the material of fluid of volume under cell zone conditions otherwise it will show error while deleting it.
Since the water flow inside pipes is at high pressure mostly so we will change the inlet type under boundary tab, as pressure based and input inlet gauge pressure as 10 Pascal.
Now, we have to create report of mass flow rate and enable the create output parameter in the setting as shown in the image below-
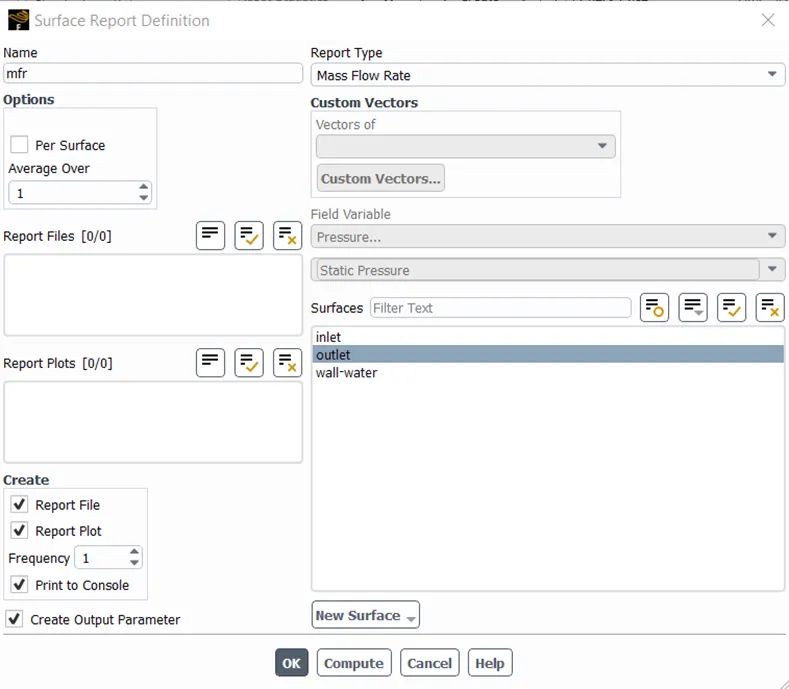
Now, initialize the flow field using hybrid initialization and run the calculation for 150 iterations.
Since we have to get mass flow rate for multiple cases of gate lift, we have to input the value gate lift in the parameter table as shown below. After the value input in the table right click on the row and select ‘update selected design parts’ to start the calculation.
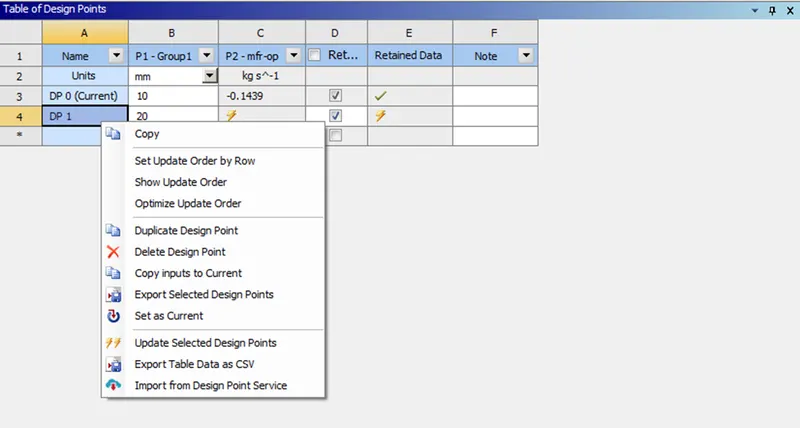
To get the result of the new case, right click on it and select ‘set as current’ to set the case as current case and then we can go to the results.
We have to calculate the mass flow rate for 10mm, 20mm, 30mm, 40mm, 50mm, 60mm, 70mm and 80mm gate lift.
Result-
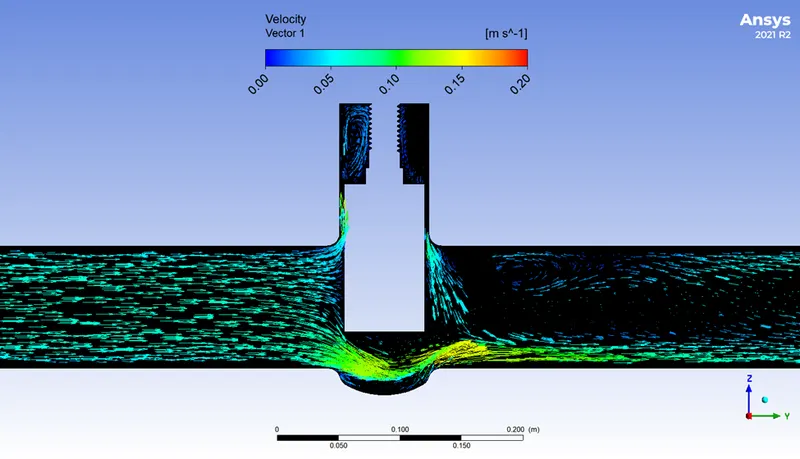
The velocity contour of cases 10mm, 30mm, 50mm gate lift are shown below-
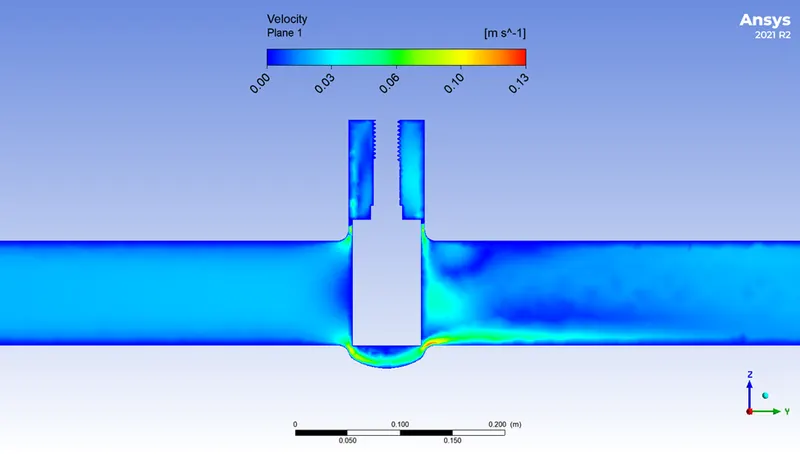
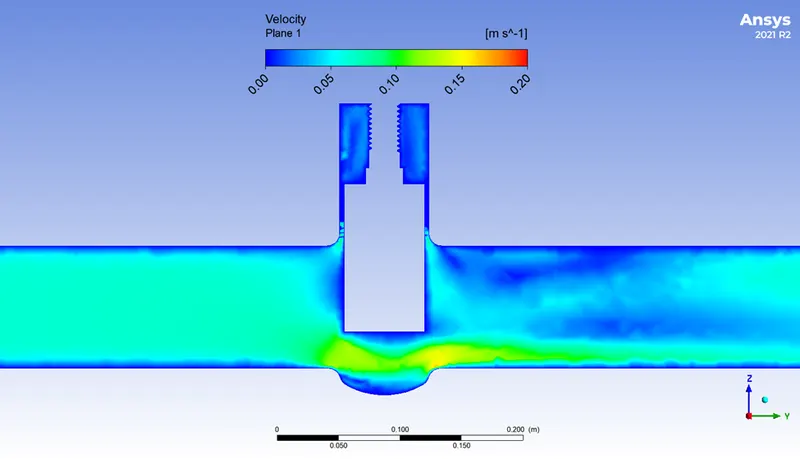
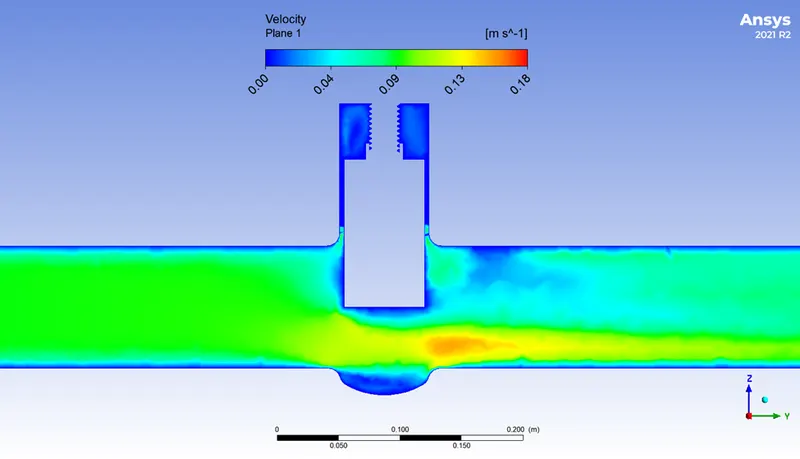
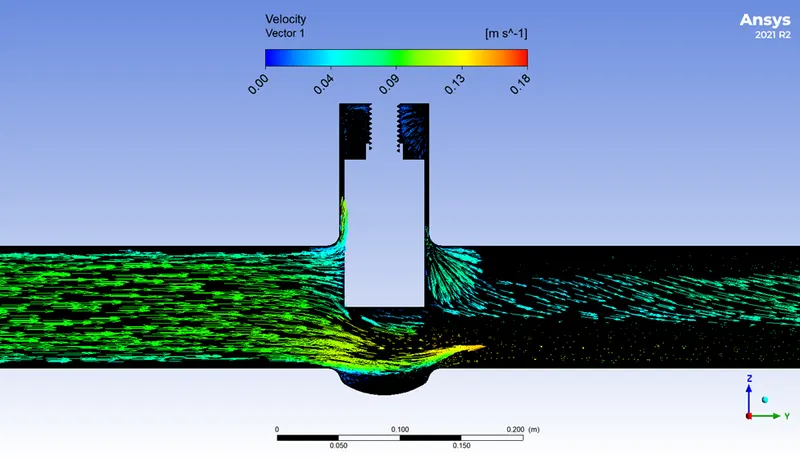
You can see the velocity increase at the right side of the gate as the gate opening increases.
The velocity vector of cases 10mm, 30mm, 50mm gate lift are shown below-
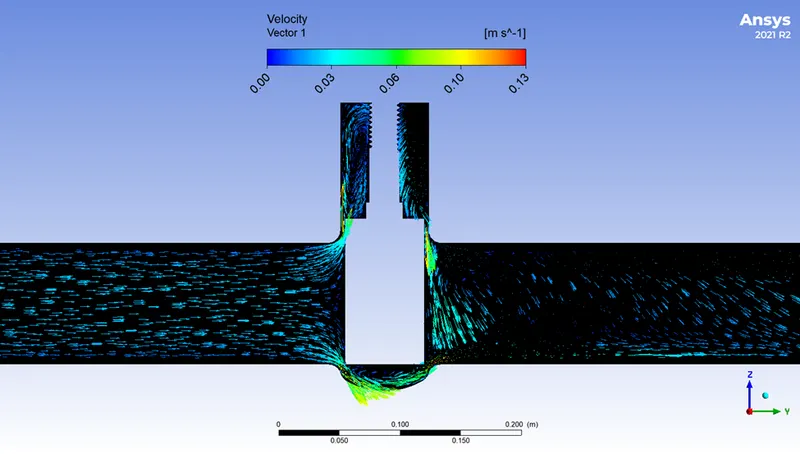
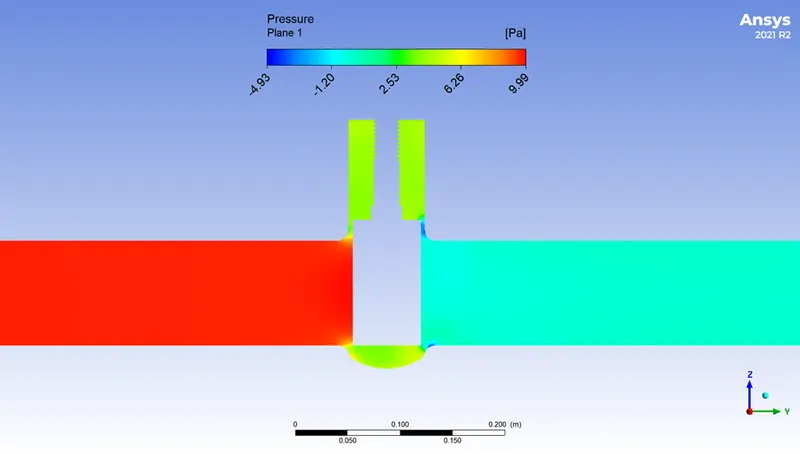
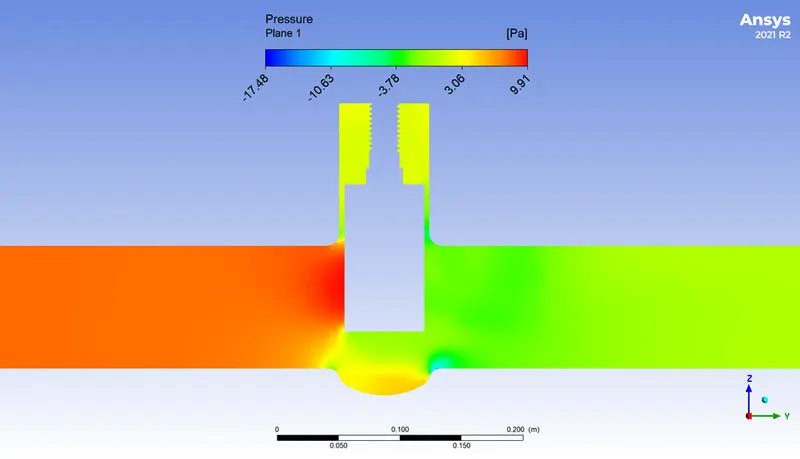
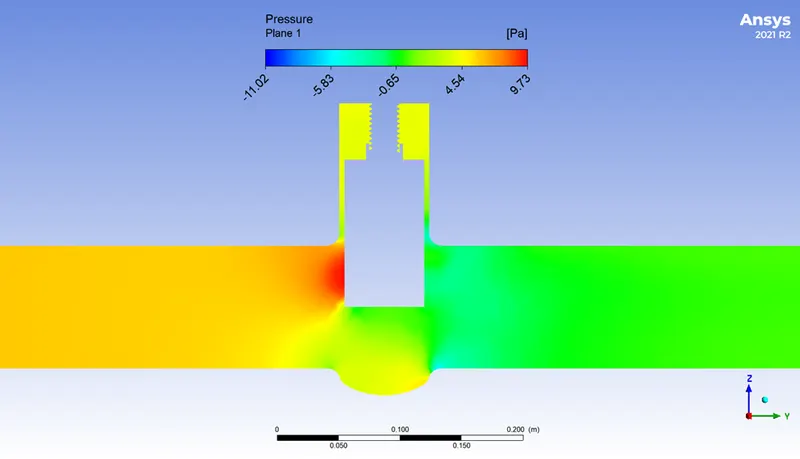
The pressure contour of cases 10mm, 30mm, 50mm gate lift are shown below-
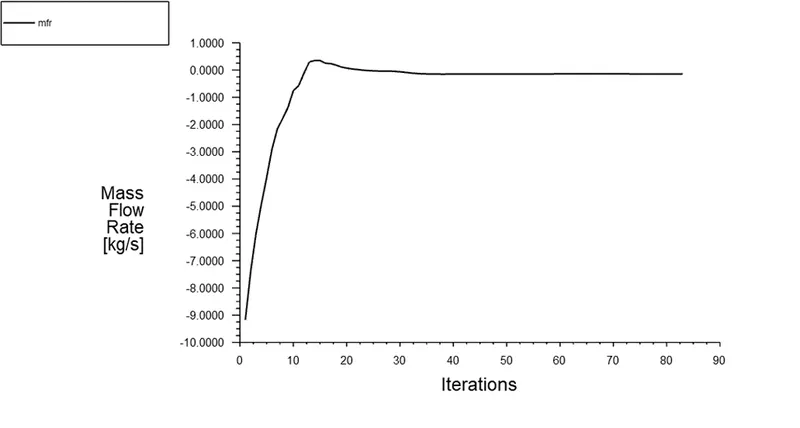
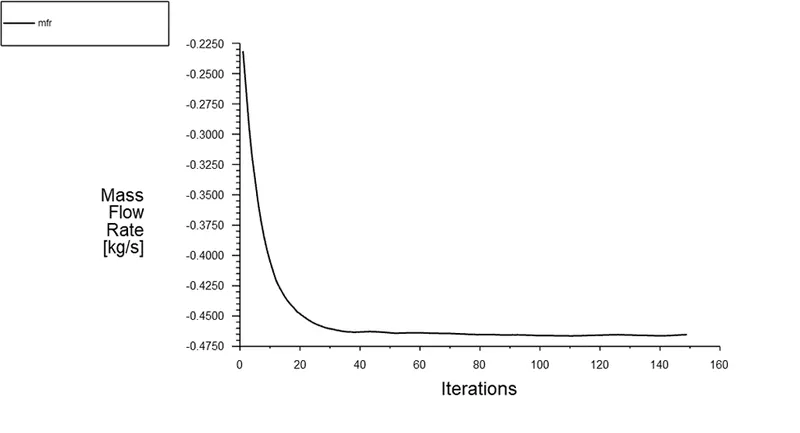
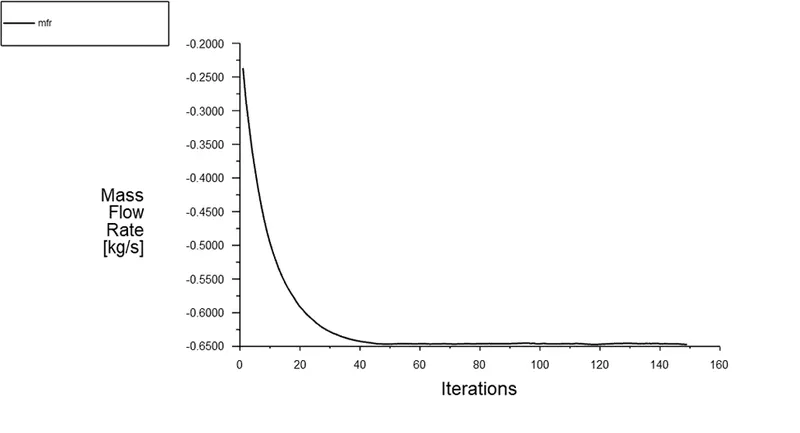
The mass flow rate plot of cases 10mm, 30mm, 50mm gate lift are shown below-
The mass flow rate for every case of gate lift is shown in the below image-
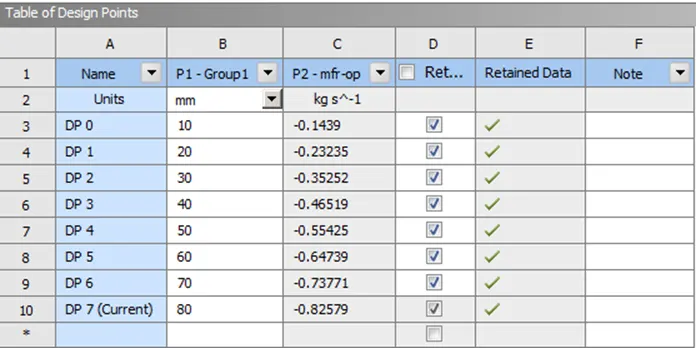
The mass flow rate is negative here since the mass is leaving the system at the outlet. Also, the mass flow rate is increasing as the gate lift value is increasing.
Conclusion-
The flow coefficient and flow factor of each cases of gate lift are shown in below table-
|
Sr. no. |
Gate lift (mm) |
Mass flow rate (kg/s) |
Mass flow rate (m3/hr.) |
Pressure – inlet (Pa) |
Pressure - output (Pa) |
Pressure drop (Pa) |
Kv |
Cv |
|
1. |
10 |
0.1439 |
0.51804 |
10 |
0.18404 |
9.81596 |
52.287 |
60.444 |
|
2. |
20 |
0.23235 |
0.83646 |
10 |
0.48473 |
9.51527 |
85.750 |
99.127 |
|
3. |
30 |
0.35252 |
1.26907 |
10 |
1.05790 |
8.94421 |
134.188 |
155.121 |
|
4. |
40 |
0.46519 |
1.67458 |
10 |
1.81587 |
8.18413 |
185.105 |
213.981 |
|
5. |
50 |
0.55425 |
1.99530 |
10 |
2.62190 |
7.37810 |
232.293 |
268.531 |
|
6. |
60 |
0.64739 |
2.33060 |
10 |
3.52522 |
6.47478 |
289.615 |
334.795 |
|
7. |
70 |
0.73771 |
2.65570 |
10 |
4.53609 |
5.46391 |
359.275 |
415.322 |
|
8. |
80 |
0.82579 |
2.97284 |
10 |
5.69127 |
4.08730 |
465.000 |
537.540 |
The graph showing flow coefficient and flow factor for each opening of gate valve is shown below-
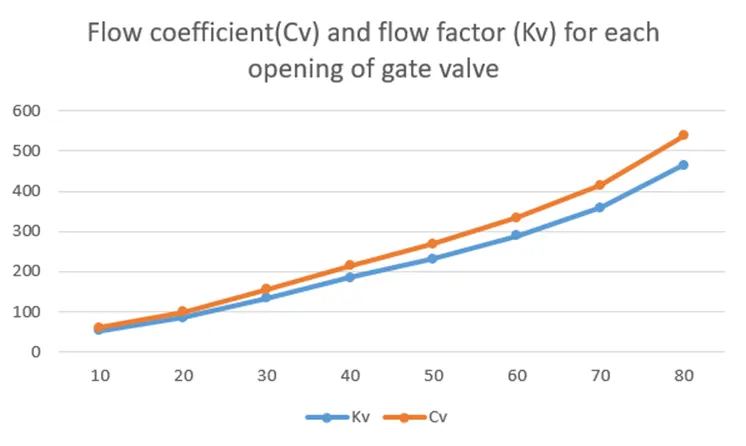
As you can see from the above table as well as the graph, as the valve is lifted gradually, the mass flow rate increases and due to that the flow coefficient and flow factor also increases.
Also, the pressure drop decreases as the valve opening increases due to the fact that the pressure increases at the outlet.