Week 9 - Parametric study on Gate valve.
Notice: - After the analysis, the size of the file is more, but in the challenge submission time it is not supported because of its large so I am sharing the google drive link please download from the link.
Link:
https://drive.google.com/file/d/1xTm4VgXQMlTNRikAhruTN-iT1ThwWR-R/view?usp=sharing
Aim: perform a parametric study on the gate valve simulation by setting the opening from 10 % to 80%
Objective:
- Obtain the mass flow rates at the outlet for each design point.
- Calculate the flow coefficient and flow factor for each opening and plot the graph.
- Discuss the results of the mass flow rate and flow coefficient.
Introduction
Instead of regulating flow, gate valves are applied to stop the flow of liquids. The ordinary gate valve has extremely little flow resistance since the flow route is unobstructed when it is fully open. As the gate is moved, the open flow path's size typically varies nonlinearly. As a result, the flow rate does not alter consistently as the stem moves. A partially open gate may shake from the fluid flow depending on the construction on the construction, and a partially open gate may shake from the fluid flow.
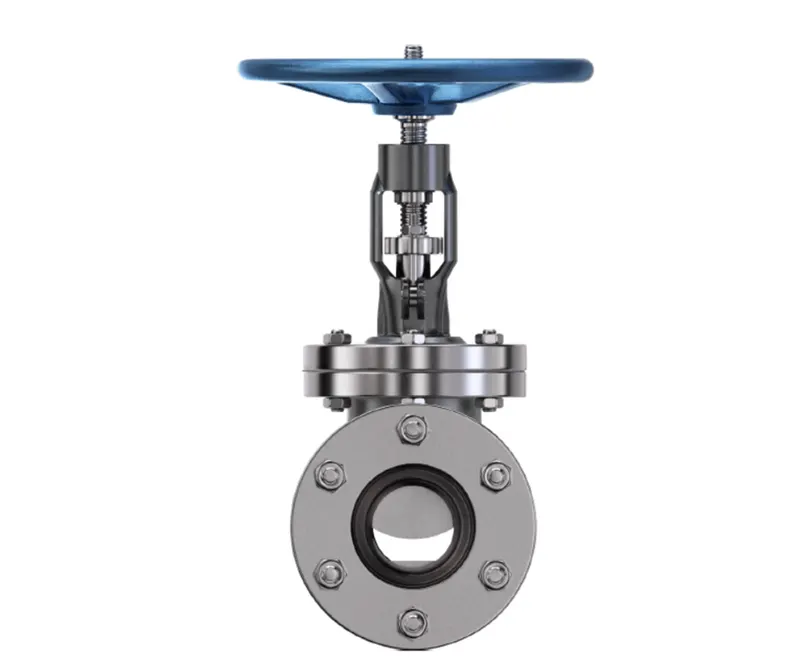
(Gate valve)
Gate valves are generally used to shut off the fluid flow inside a pipeline and also to control the fluid flow. When they are fully opened, they hardly restrict any fluid flow, thus offering very low flow resistance when fully opened. Gate valves are generally used for pipes of diameters larger than 2" to the largest pipes. They are simpler to construct in large sizes. The gate can vibrate if it is in a partially open state.
Solving and approach
In gate valve analysis we will go through some steps
- Modelling of geometry
- Meshing
- Setup and calculation
- Result
Modelling of geometry
In our geometry setup first, we have to extract the fluid volume which flows through the gate valve and we will do our calculation on this extracting volume.
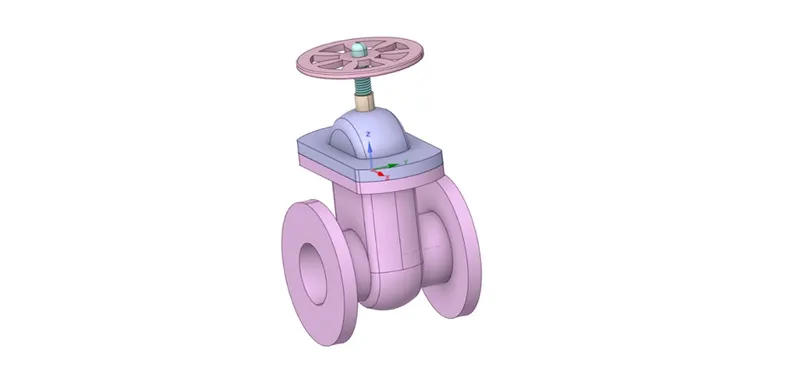
(Gate valve model)
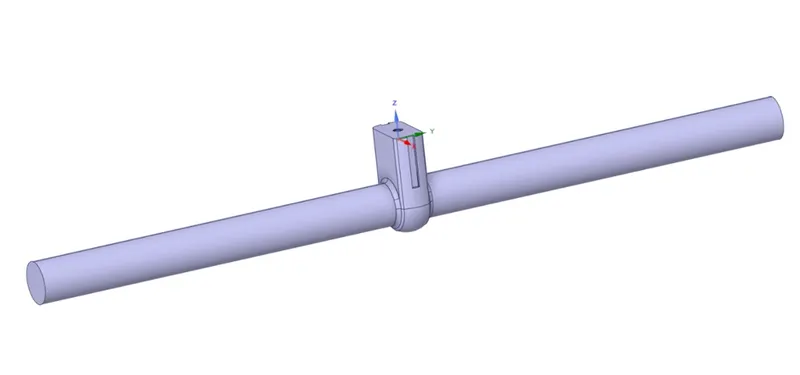
(After extracting fluid volume)
We have to calculate 8 cases where the displacement of the gate disc from 10mm to 80mm and have to check the mass transfer rate and calculate flow factor.
Meshing
After the geometry setup, we can do meshing where we take the element size of 6mm and generate the mesh and check the meshing quality. The 407493 number of element is created after that have to create the name section as inlet in one end and outlet in other end.
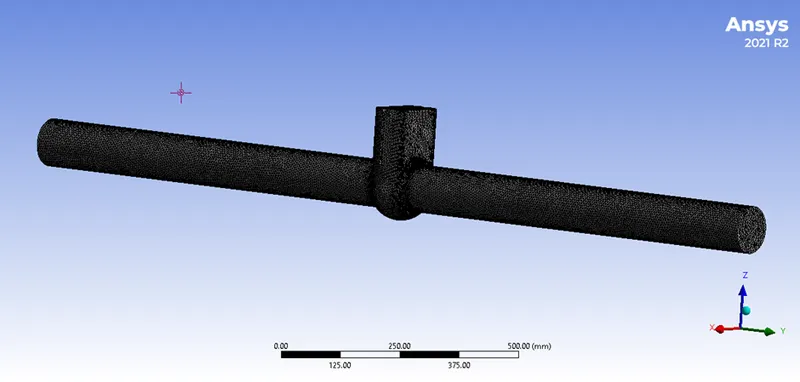
(Meshing of fluid element)
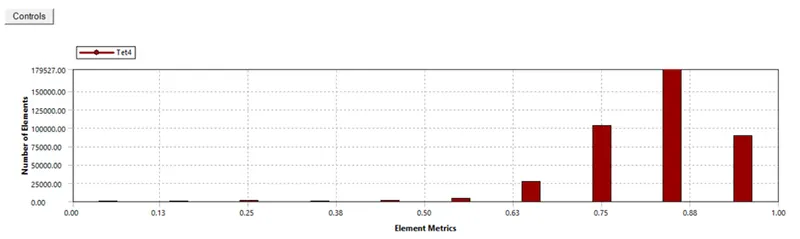
(Quality of mesh)
Setup and calculation
In our solving part, we use a pressure-based steady-state solver with a gravitational acceleration of -9.81m/s^2 in the z-direction. In the method section, we use the k-epsilon realisable scalable wall function model. In the material section use water and also in the cell zone we have to use water. In the boundary condition, we inlet as the pressure inlet of 10Pa and the outlet should pressure outlet.
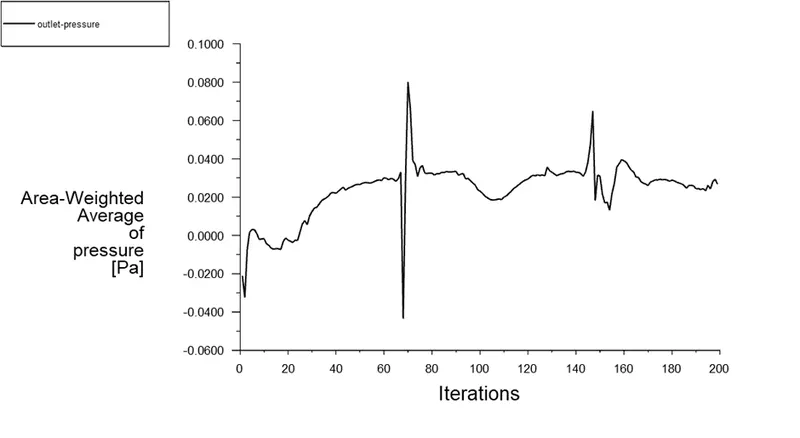
For all 8 cases, we use the same model of solution and the same boundary conditions. And take a plane near the outlet valve and tell the result of pressure at the outlet.
Result
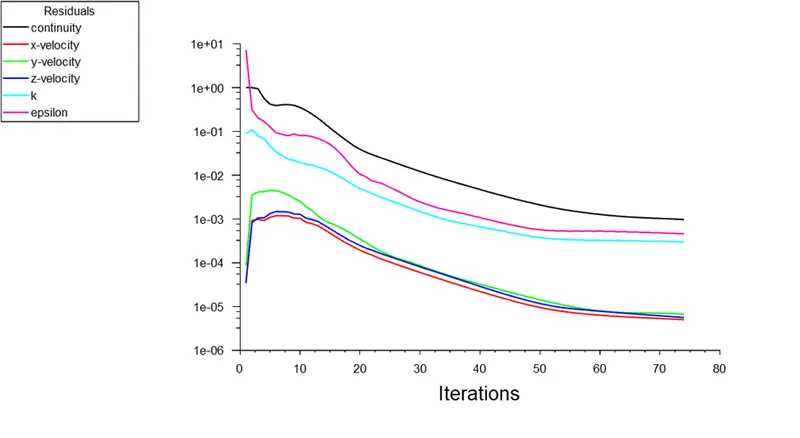
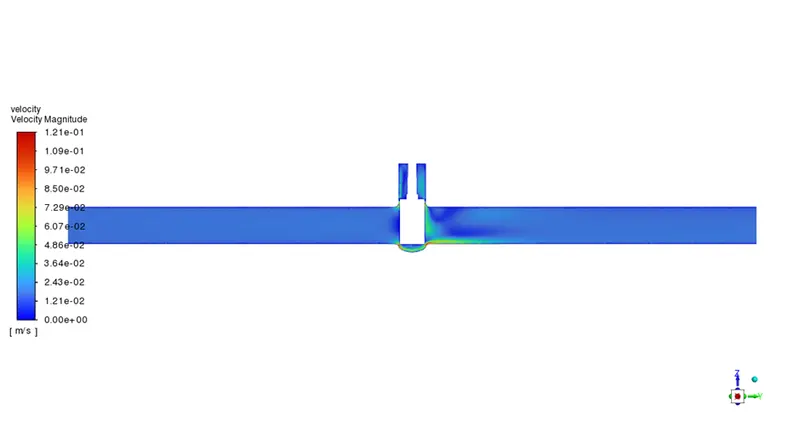
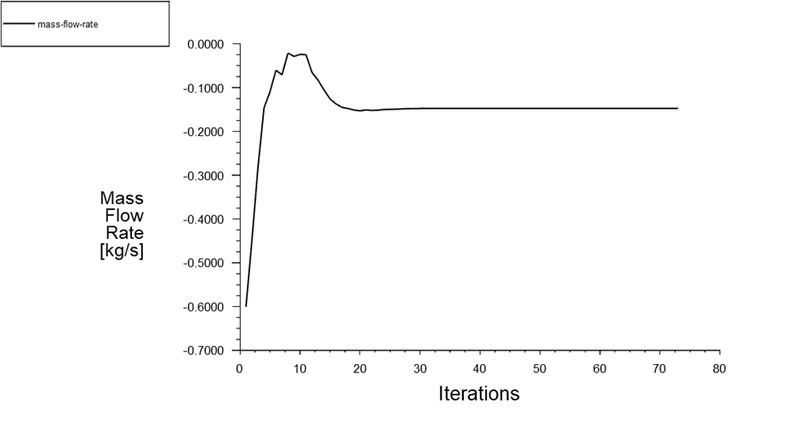
In the parametric study, we have to study after the displacement of the gate disc and plot the results below.
For 10mm displacement
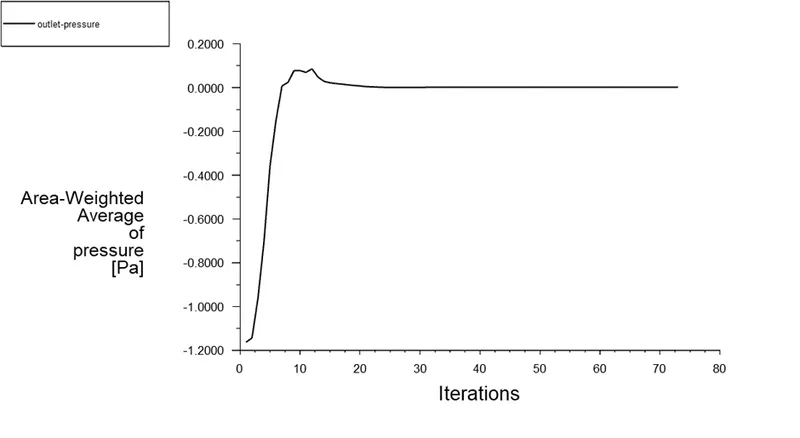
For 20mm displacement
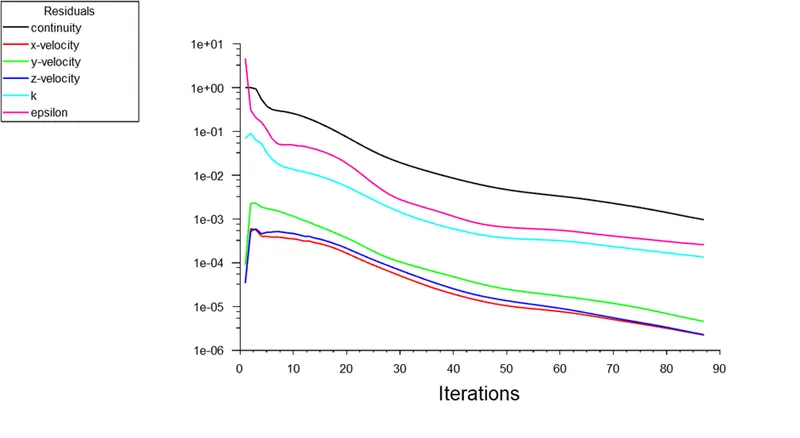
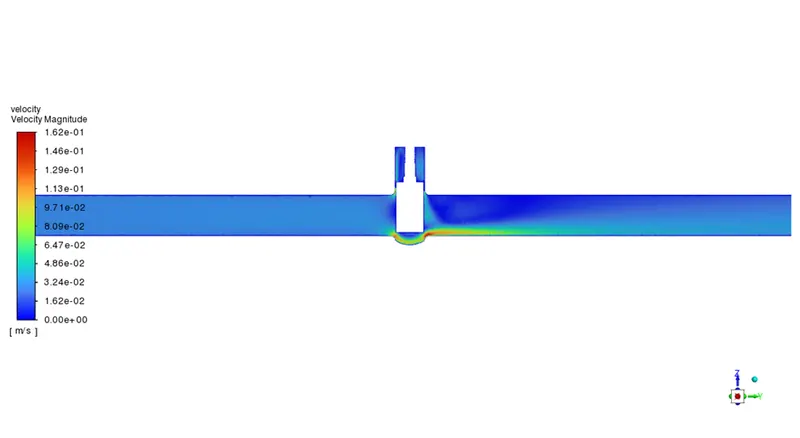
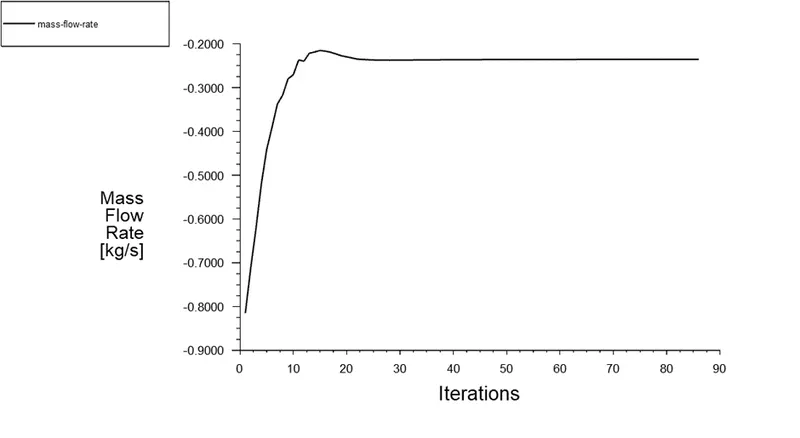
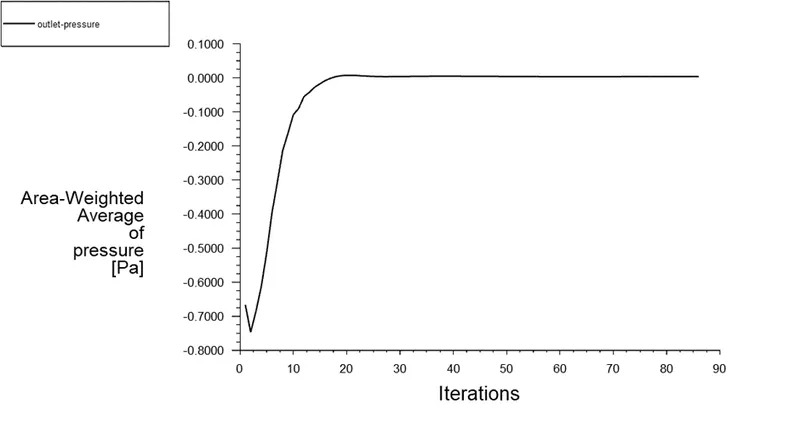
For 30mm displacement
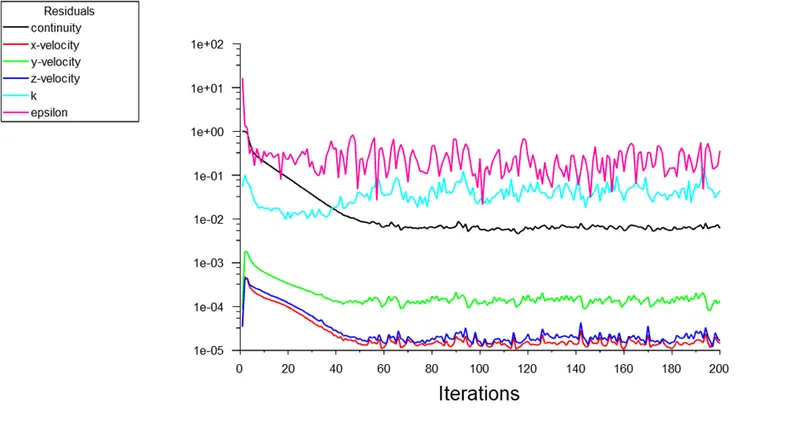
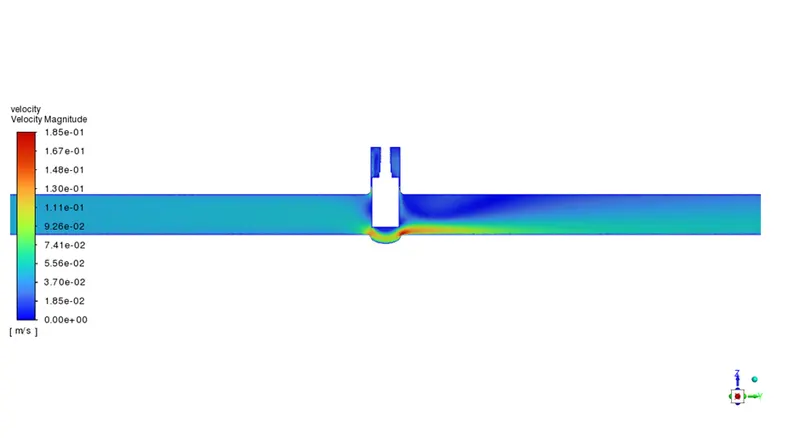
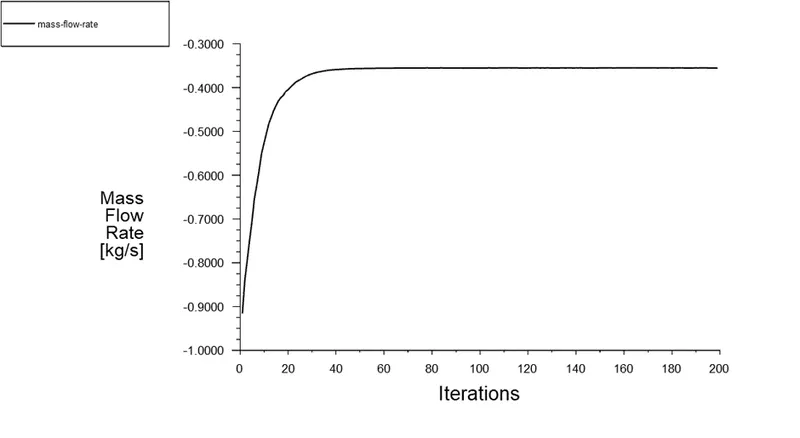
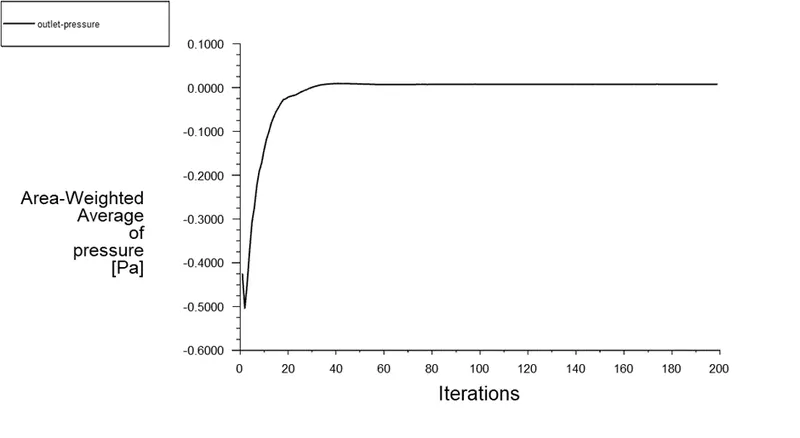
For 40mm displacement
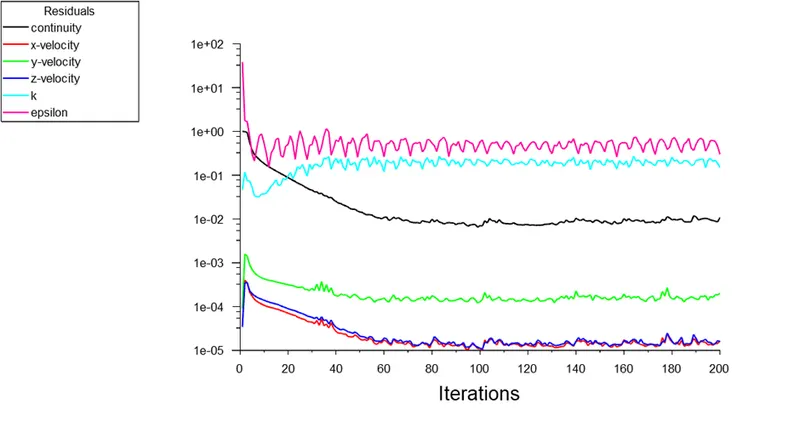
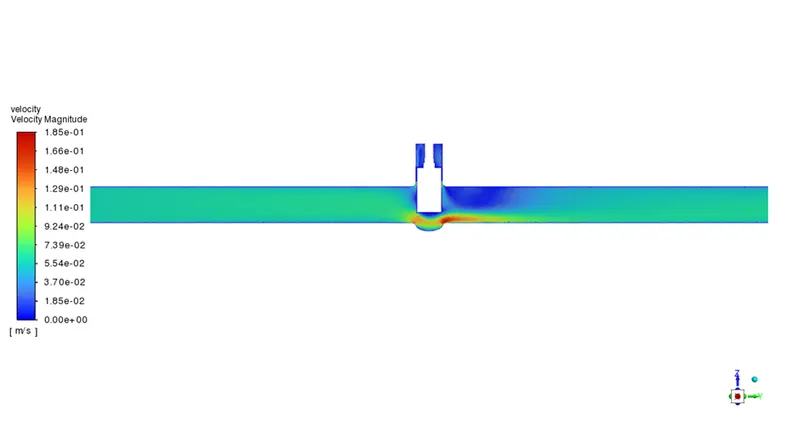
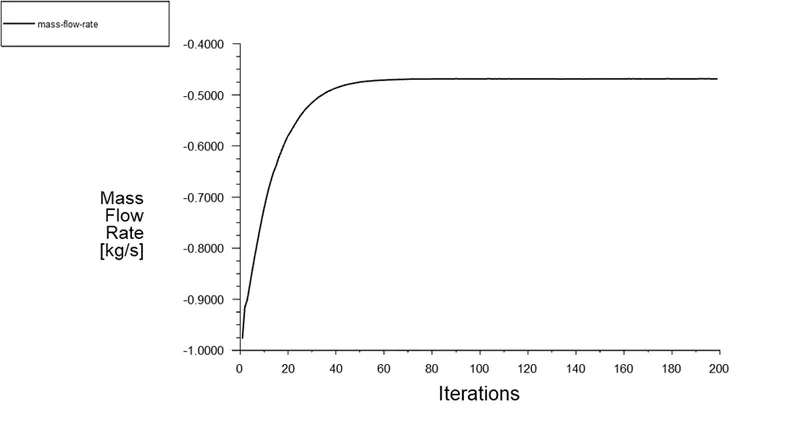
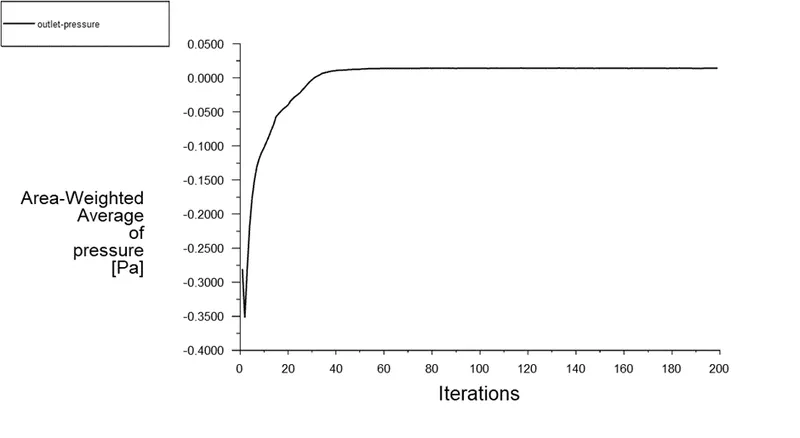
For 50mm displacement
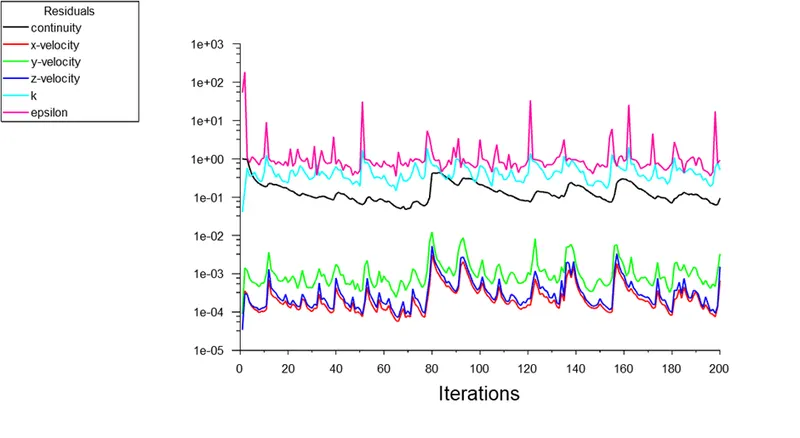
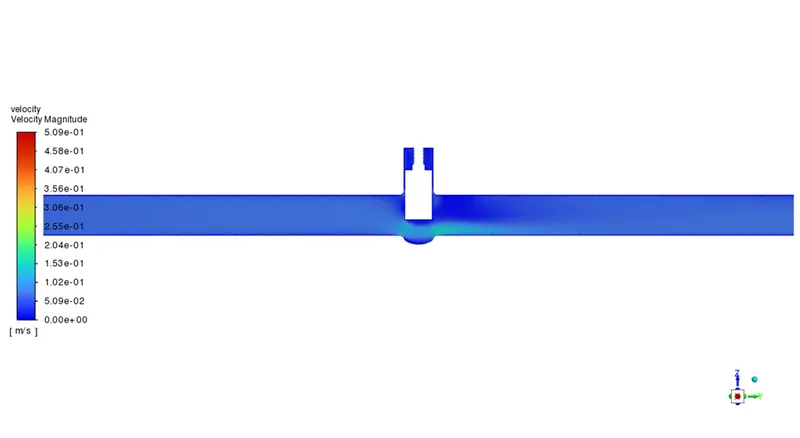
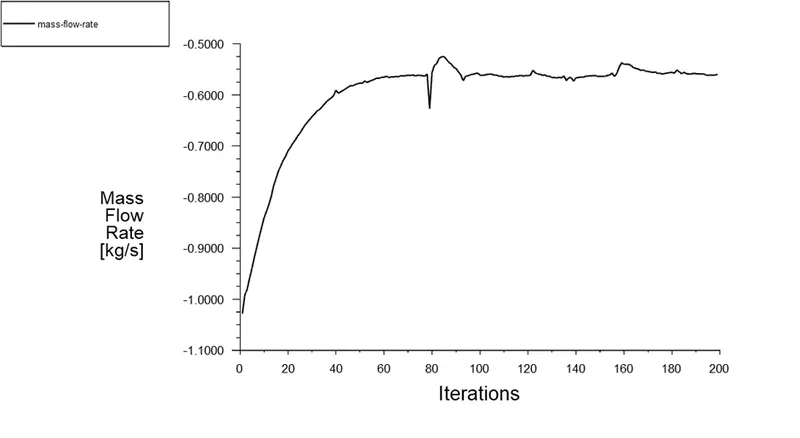
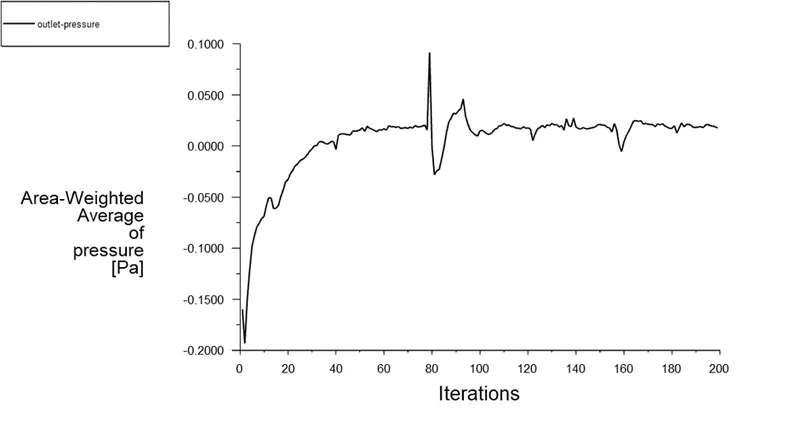
For 60mm displacement
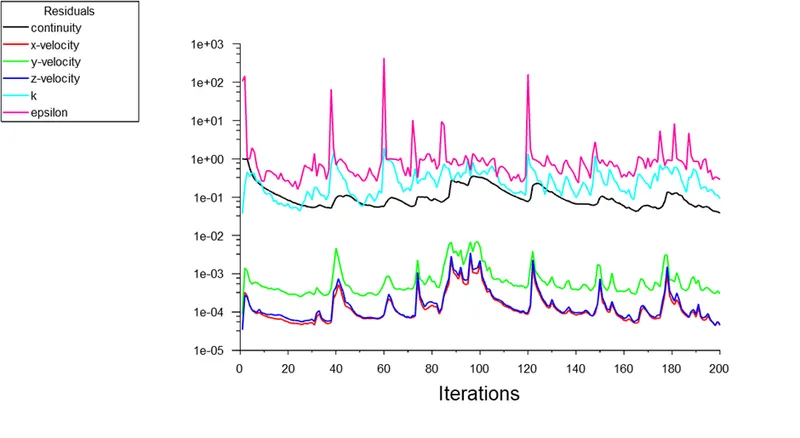
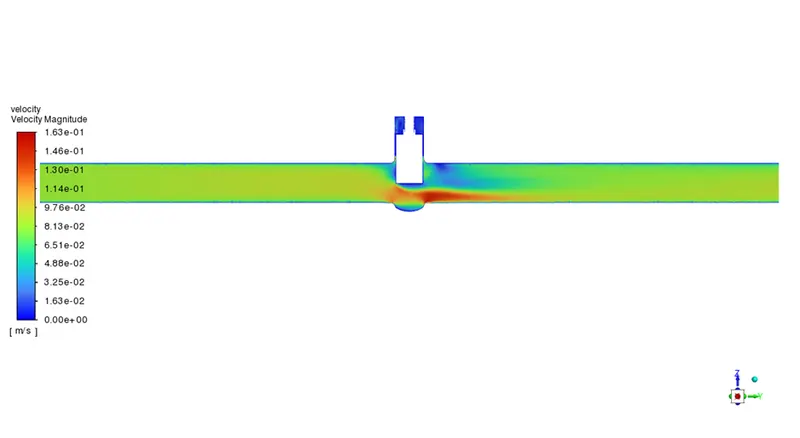
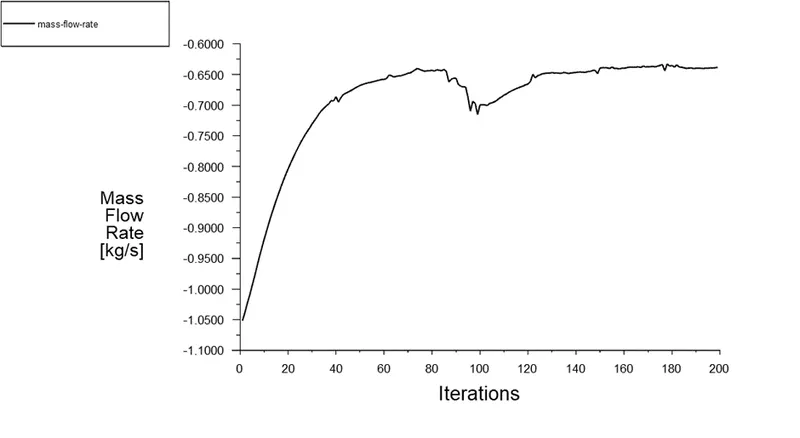
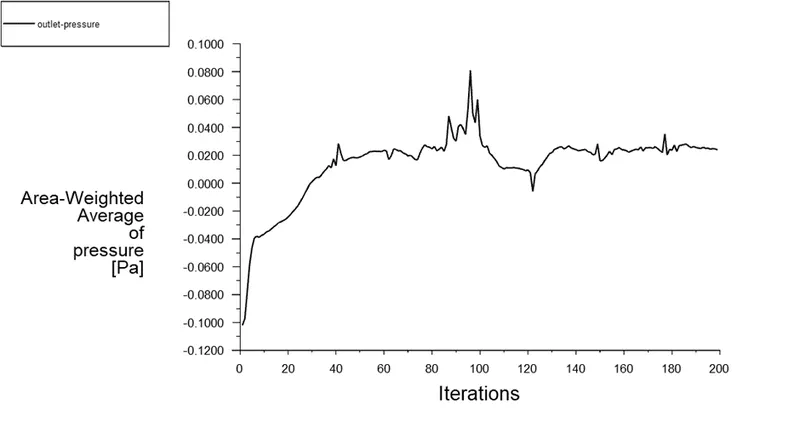
For 70mm displacement
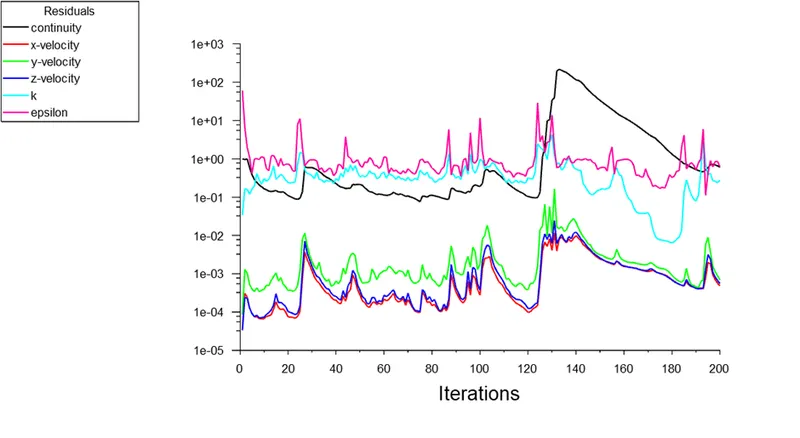
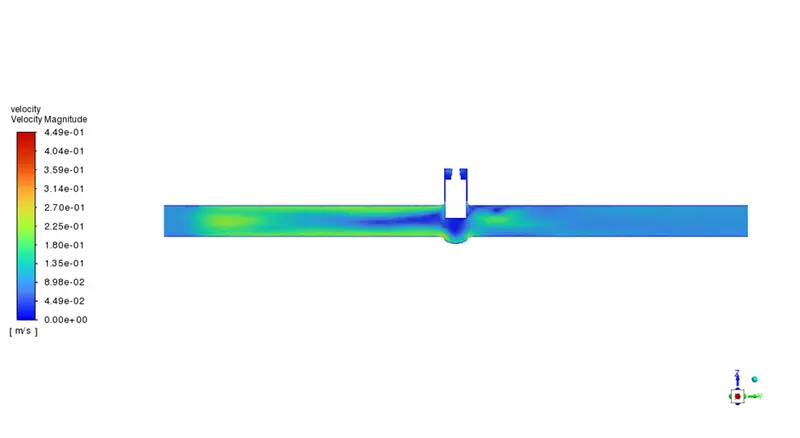
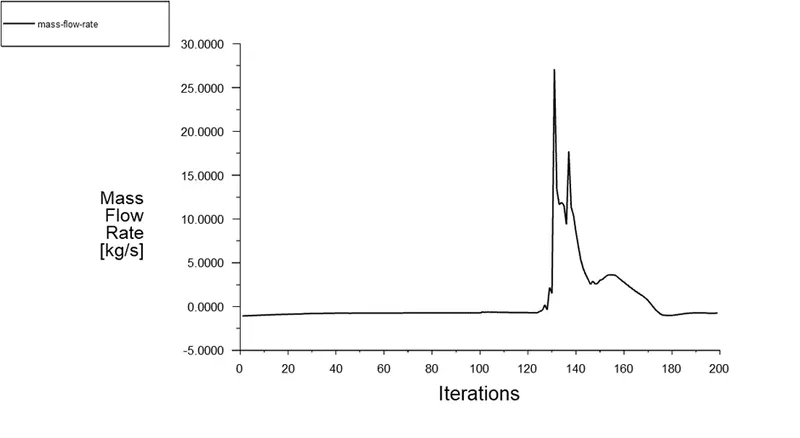
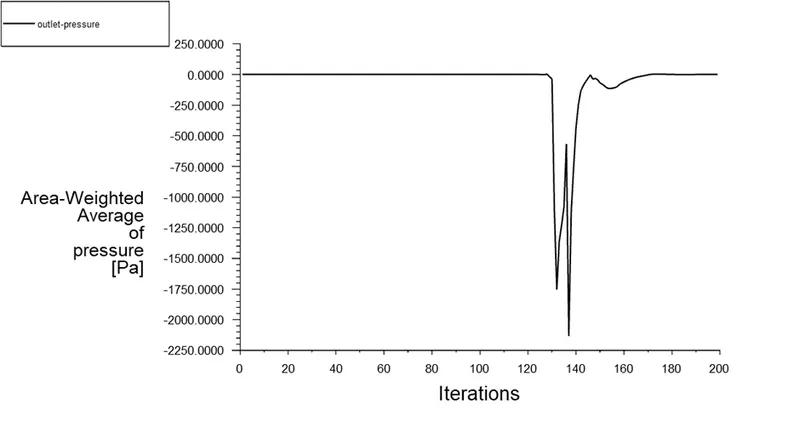
For 80mm displacement
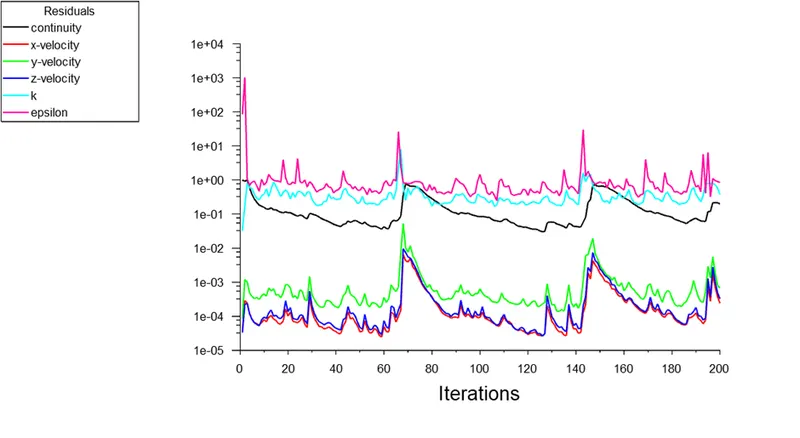
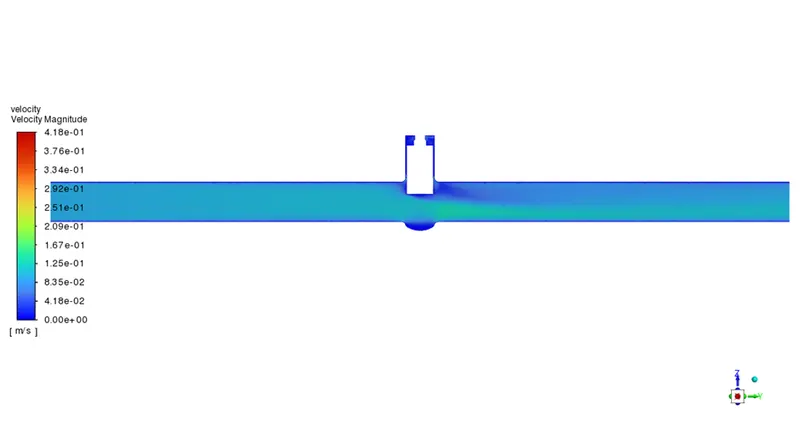
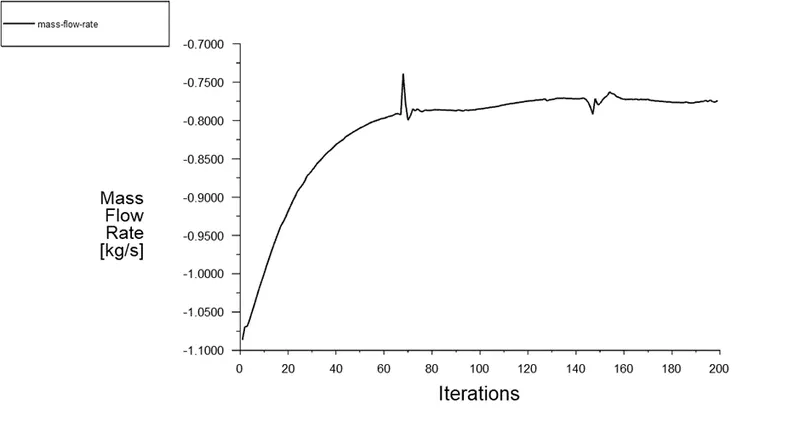
Flow coefficient (Cv)
The flow coefficient in imperial measurements is denoted by Cv. Basically, it is defined as the rate of water flow measured in US gallons per minute at a constant temperature of 60 degrees Fahrenheit and a pressure difference of 1 psi across the valve. It is used to choose the right valve for different purposes and to calculate the flow under different circumstances.
Q = the rate of flow (Expressed in US gallons per minute)
SG = specific gravity of water
P = pressure drop across the valve (psi units)
Flow factor(k)
The flow coefficient in metric units is the flow factor. Essentially, it is the volume of water flowing in cubic metres per hour at a constant temperature of 16 degrees Celsius with a 1 bar pressure drop across the valve. That flow factor and flow coefficient are correlated with each other, the relation is
k = 0.865Cv
Analysis table
|
Sl No |
Lift height |
Mass flow rate (Outlet) Kg/sec |
Mass flow rate (Outlet) US gallons per minute |
pressure inlet |
pressure outlet |
pressure drop |
Cv |
k |
|
1 |
10 |
0.14766 |
2.340411 |
10 |
0.00166 |
9.99834 |
806.962246 |
698.022343 |
|
2 |
20 |
0.2356 |
3.73426 |
10 |
0.00362 |
9.99638 |
1287.55455 |
1113.73469 |
|
3 |
30 |
0.35522 |
5.630237 |
10 |
0.00739 |
9.99261 |
1941.27813 |
1679.20558 |
|
4 |
40 |
0.46877 |
7.4300045 |
10 |
0.01429 |
9.98571 |
2561.82915 |
2215.98221 |
|
5 |
50 |
0.56291 |
8.9221235 |
10 |
0.02099 |
9.97901 |
3076.30447 |
2661.00337 |
|
6 |
60 |
0.63835 |
10.1178475 |
10 |
0.02406 |
9.97594 |
3488.58425 |
3017.62537 |
|
7 |
70 |
0.73935 |
11.7186975 |
10 |
0.00389 |
9.99611 |
4040.54948 |
3495.0753 |
|
8 |
80 |
0.7741 |
12.269485 |
10 |
0.02645 |
9.97355 |
4230.45831 |
3659.34644 |
As the flow coefficient increases, the pressure drop likewise reduces. Additionally, a high flow coefficient allows for lower frictional losses and high-pressure flow through the valve with a negligibly small pressure drop.
Conclusion
We can infer from the study above that a low lift height indicates a bigger pressure drop and hence a low flow rate through the valve. The mass leaving the outlet is the cause of the negative mass flow. The parameters allow for significant time and effort savings in solving problems. As the mass flow rate via the valve increases, the flow factor and coefficient rise as well.