Week 9 - Parametric study on Gate valve.
Aim: To perform a parametric study on the gate valve simulation by setting
the opening from10 % to 80%.
- To obtain the mass flow rates at the outlet for each design point.
- To calculate the flow coefficient and flow factor for each opening and to plot the graph.
- To discuss the results of the mass flow rate and flow coefficient.
Theory:
1) Flow Coefficient:
Valve Flow Coefficient (`C_v`) is a valve’s capacity for a liquid or gas to flow through it. It is technically defined as “the volume of water at 60°F (in US gallons) that will flow through a valve per minute with a pressure drop of 1 psi across the valve.”
In simpler terms, the larger the opening in a valve, the larger the `C_v`. As a valve is opening, the `C_v` increases until the valve is fully open, where it reaches its highest possible `C_v`.
`C_v` is given by empirical formula as follows:
`C_v = Q sqrt(frac{SG}{DeltaP}`
where
`C_v ` is flow coefficient;
`Q` is volumetric flow rate (US gallons per minute);
`SG` is specific gravity of fluid;
`DeltaP` is pressure drop across valve (psi) .
As above formula is empirical, it is dimensionally inconsistent. The general definition of the flow coefficient can be expanded into equations modelling the flow of liquids, gases and steam using the discharge coefficient`C_d`.
The flow coefficient of a device `C_v` is a relative measure of its efficiency. It describes the relationship between the pressure drop across a valve or other assembly and the corresponding fluid flow rate.
The use of the flow coefficient offers a standard method of comparing valve capacities and sizing valves for specific applications that is widely accepted by industry.
2) Flow Factor:
Valve Flow factor (`K_v`) is a metric version of the flow coefficient (`C_v`).
The flow factor `K_v` is defined with same formula as of flow coefficient `C_v` but flow rate and pressure drops are expressed in units of `frac{m^3}{hr}` and `bar` respectively. i.e.
`K_v = Q sqrt(frac{SG}{DeltaP}`
where
`K_v ` is flow factor;
`Q` is volumetric flow rate ( `frac{m^3}{hr}`);
`SG` is specific gravity of fluid;
`DeltaP` is pressure drop across valve (bar) .
The `C_v ` and `K_v` are interconverted with the equation `K_v = 0.865 xx C_v`.
Workflow:
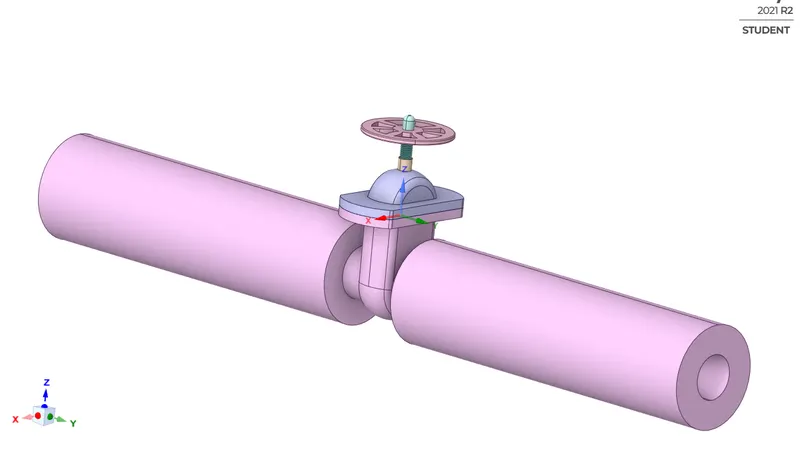
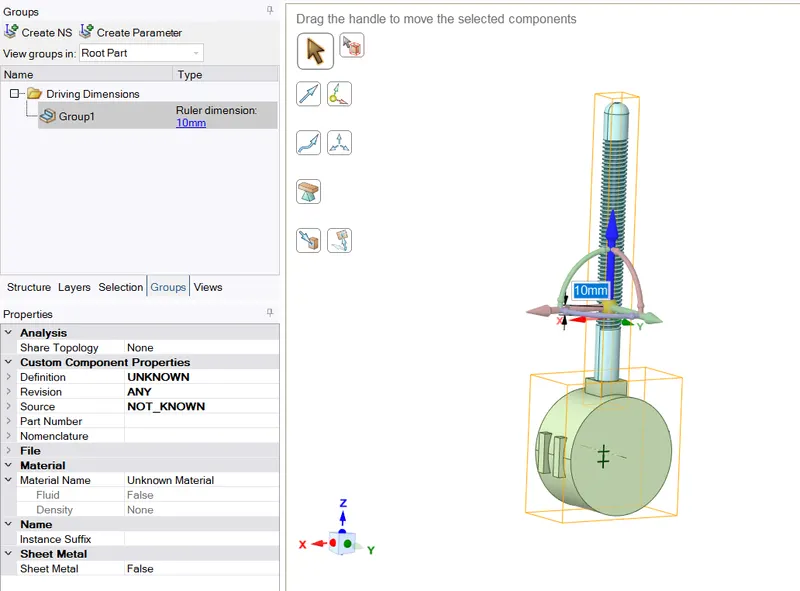
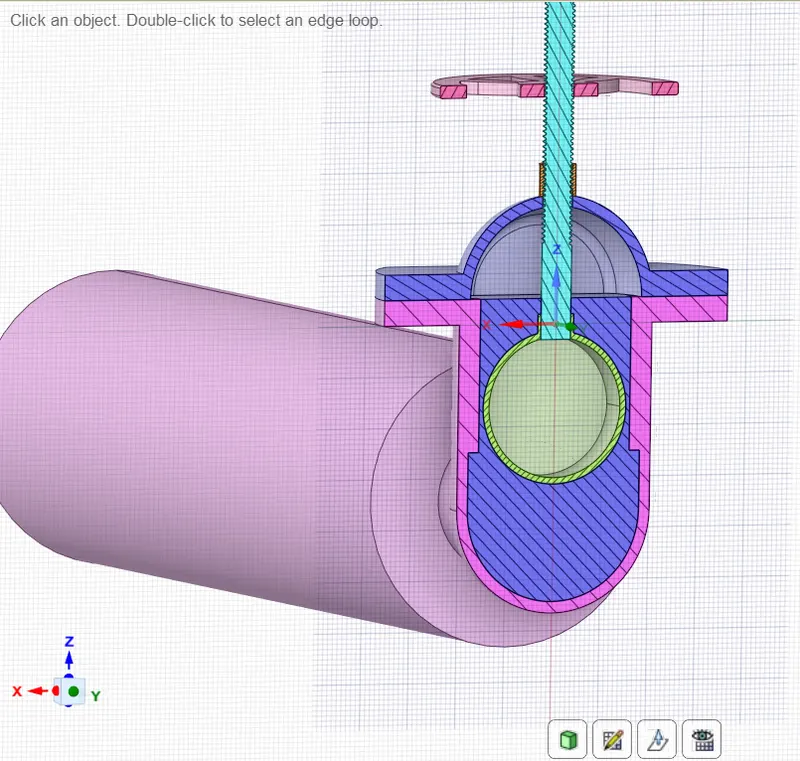
- Geometry: The flanges of the existing valve geometry have been extruded 800 mm on either sides to take account for the inlet and outlet pipe volumes. The valve and spindle lift value has been parameterised under groups.Then the required fluid volume has been extracted from the provided gate valve geometry. The geometry change settings are set to change with context.
Original Valve Geometry Modified Valve geometry 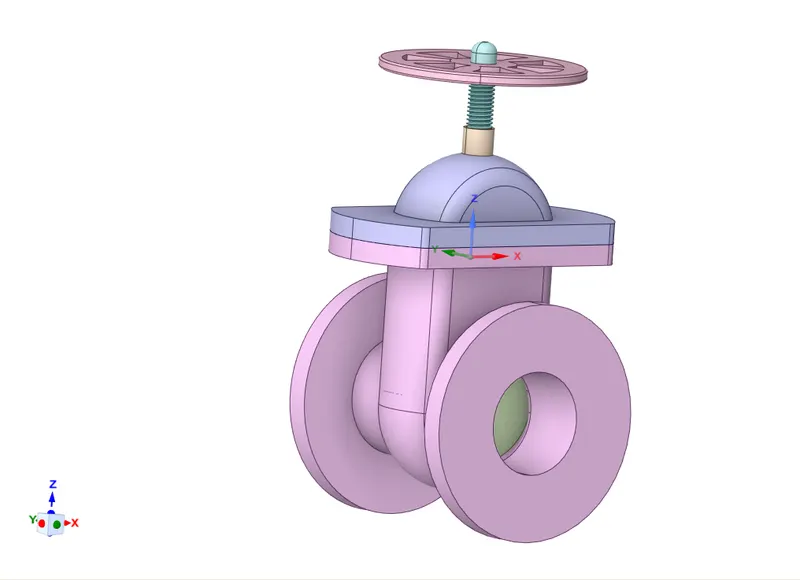
Edge selection for Volume extraction Extracted Volume 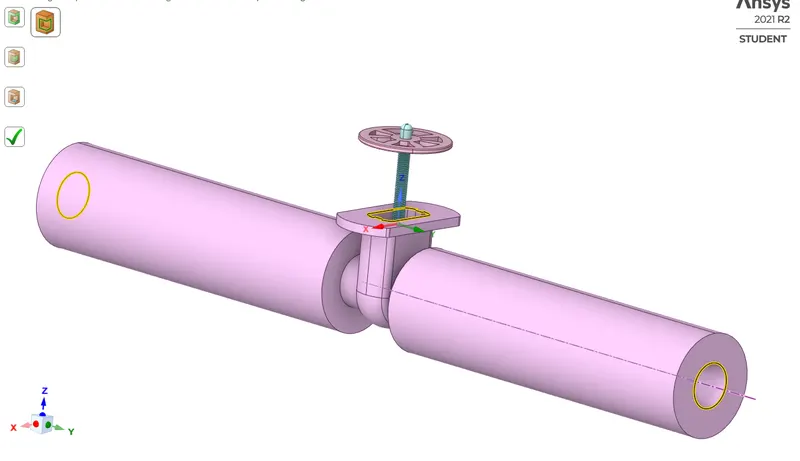
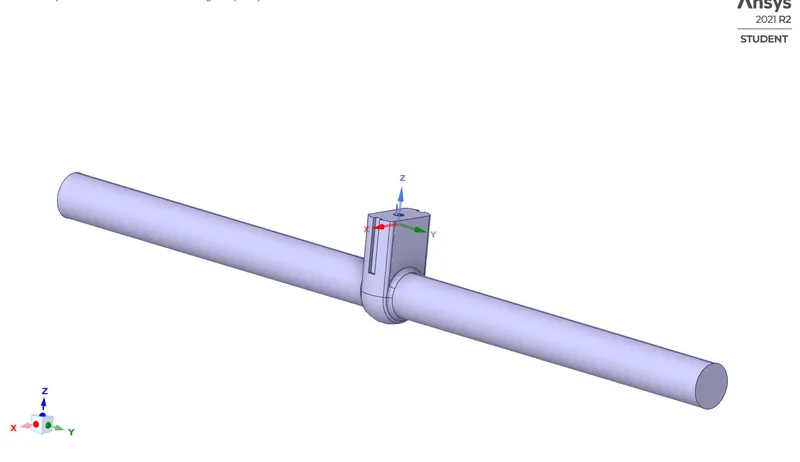
Cross section of extracted volume and valve Input Parameter Group 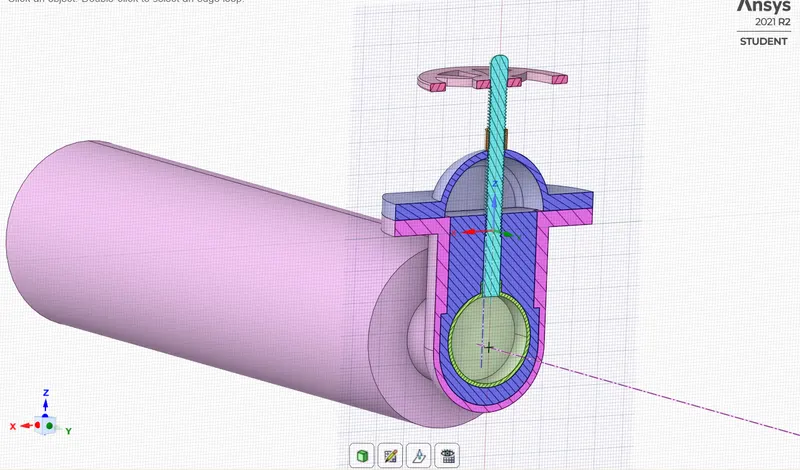
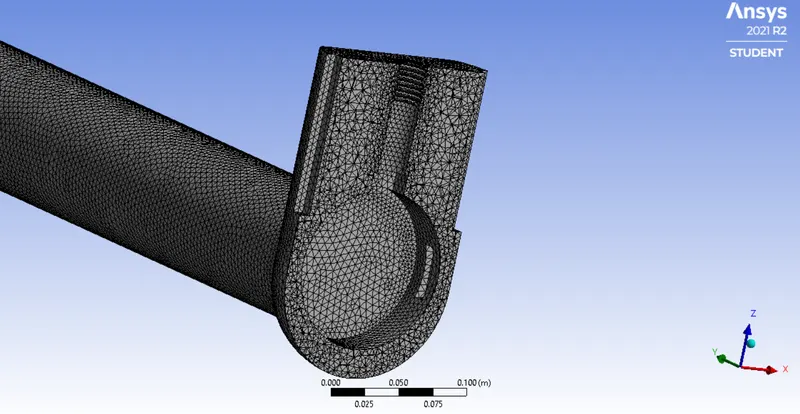
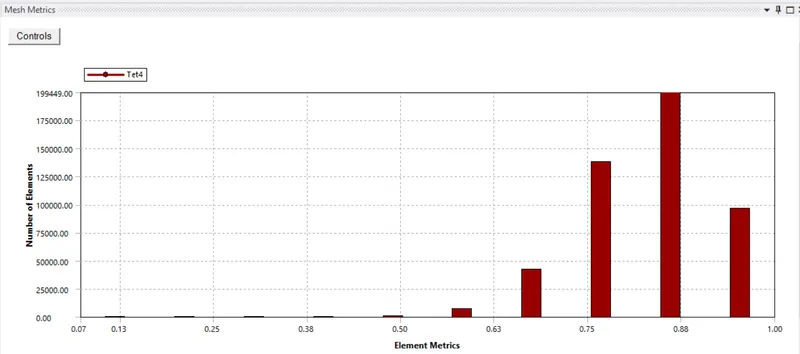
- Meshing: The named selections for inlet and outlet of the extracted fluid volume have been assigned. The fluid volume has been meshed with the finer mesh of the minimum size of 5.5 mm. The quality of the mesh is checked with mesh metrics and found in the acceptable range.
Closer Mesh View Cross Sectional Mesh View 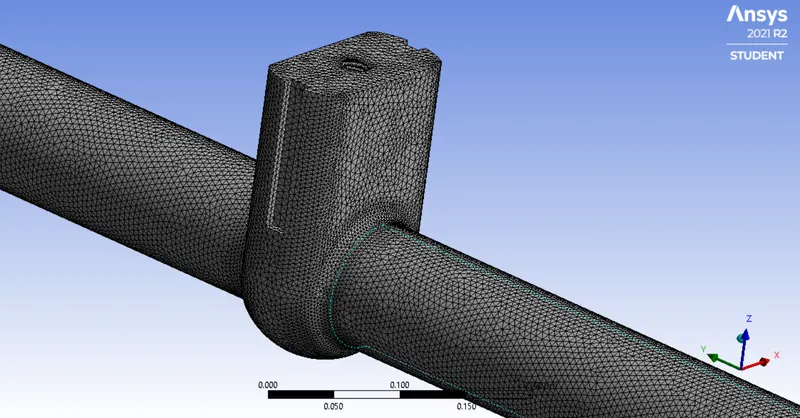
- Case setup:
Pressure based steady state solver
Gravity - Turned on in negative Z direction.
Turbulence Model- Realisable k-epsilon Turbulence model with scalable wall function turned on.
Pressure velocity coupling with Coupled scheme.
Cell zone condition:
Fluid- Water.
Specific Gravity of water = 1.
Boundary condition:
Inlet - pressure inlet with 10 Pa pressure.
Outlet - pressure outlet with exit to atmospheric pressure.
Report- The report for mass flow rate at the outlet has been set under solution reports.
Standard initialisation with the inlet parameters has been done and simulation is calculated for the 250 number of iterations.
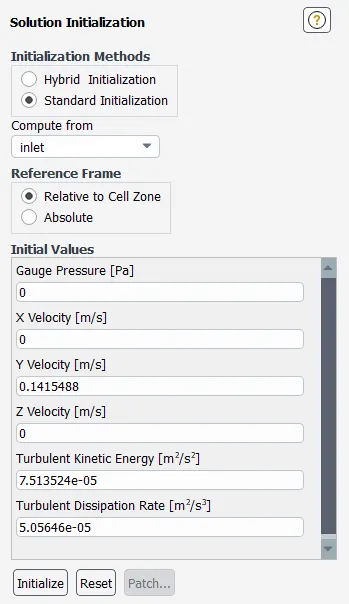
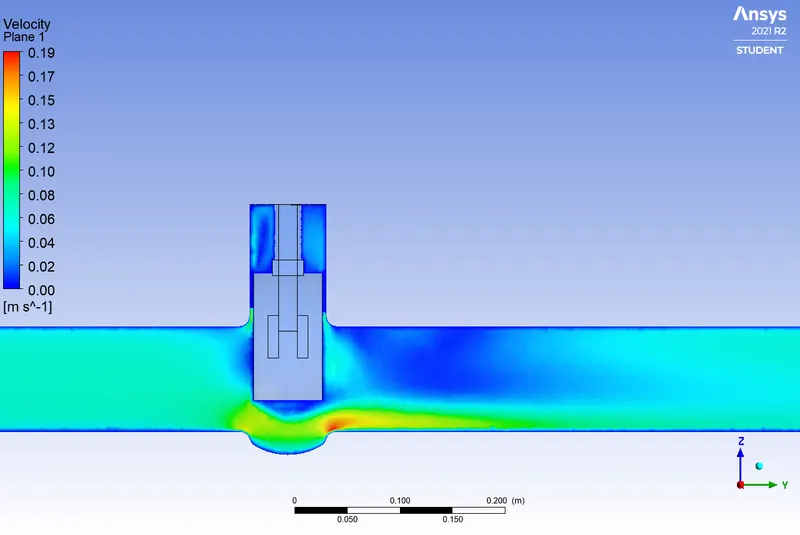
As the computed value of inlet velocity at inlet (Y velocity) is 0.1415488 m/s , the flow Reynolds Number is higher and thus flow is fully turbulent. That is why the k-epsilon turbulence model is selected earlier for turbulence modelling.
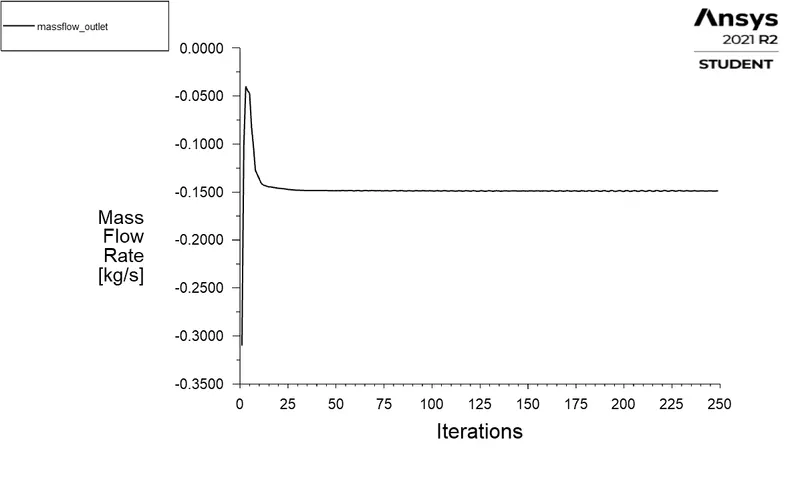
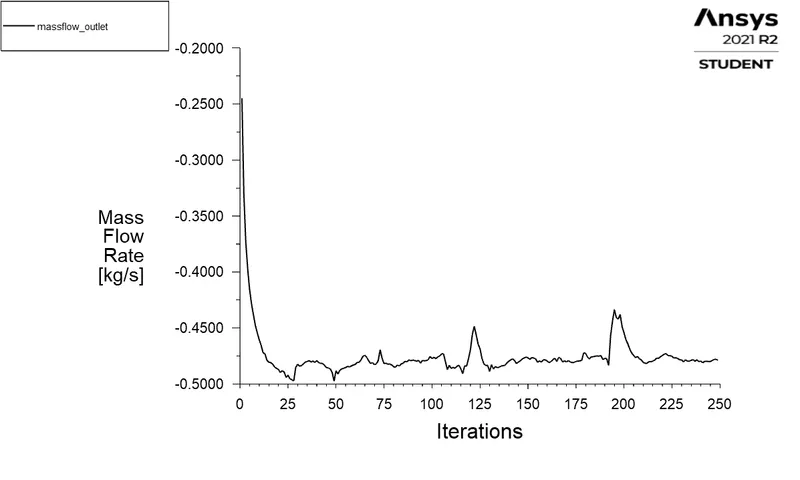
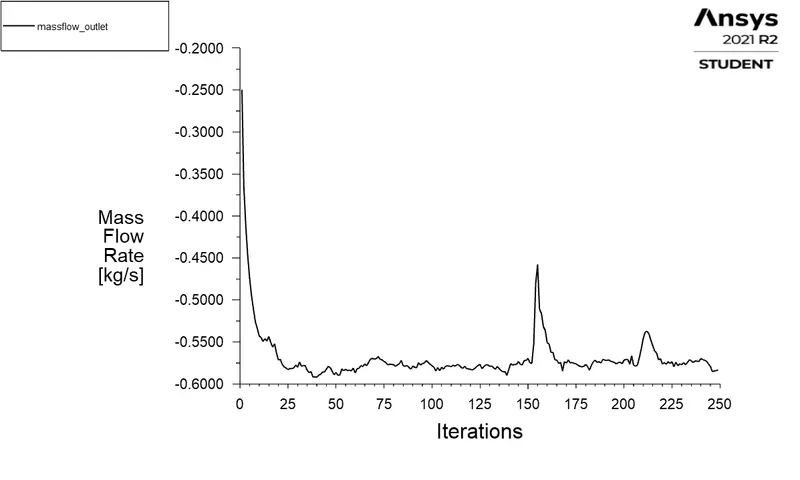
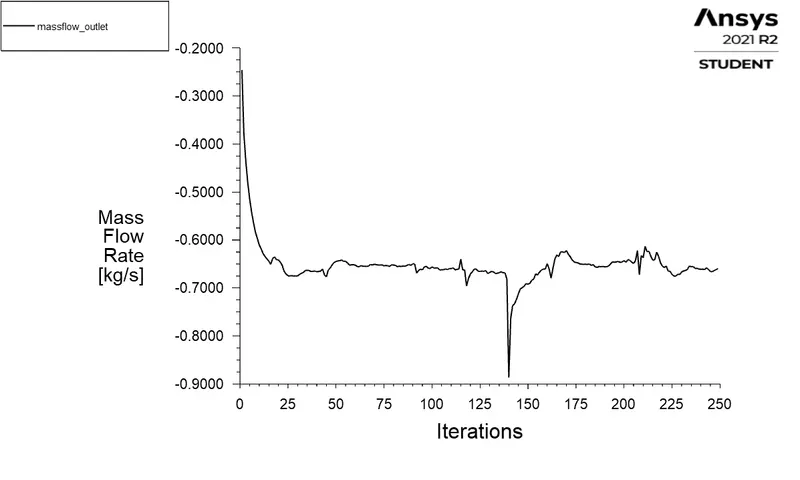
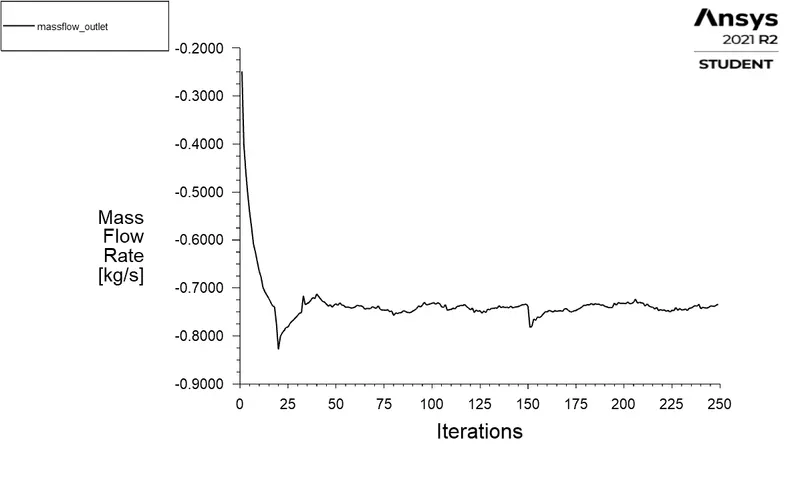
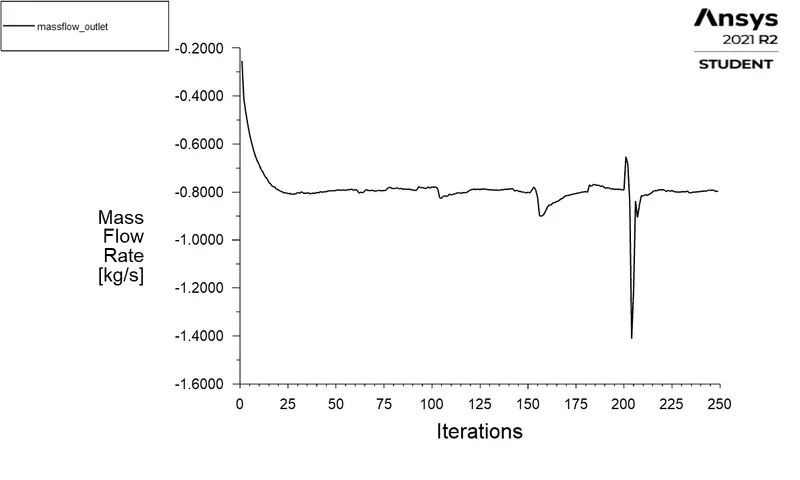
Flux report- The flux report for mass flow through the computational volume is generated using the flux report. This is one of the indications of a converged solution.The value of mass flow at the outlet is negative in the monitoring report as well as in the flux balance report as the mass flow is leaving the outlet surface.
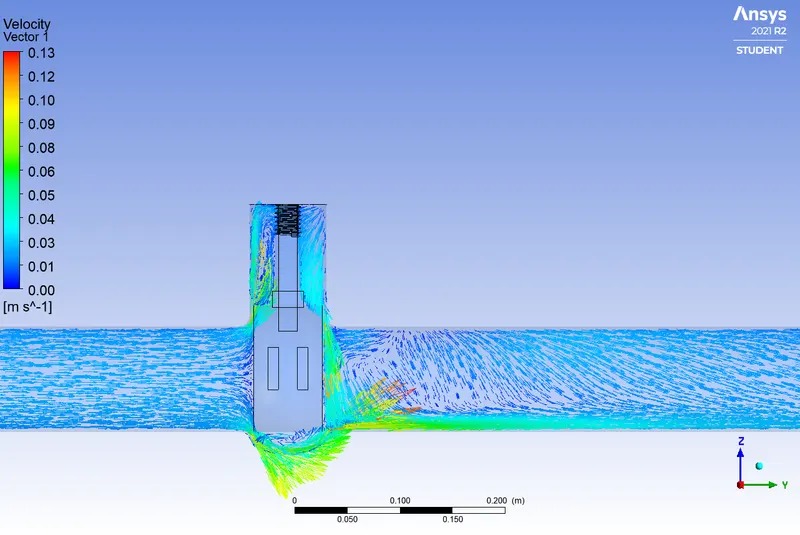
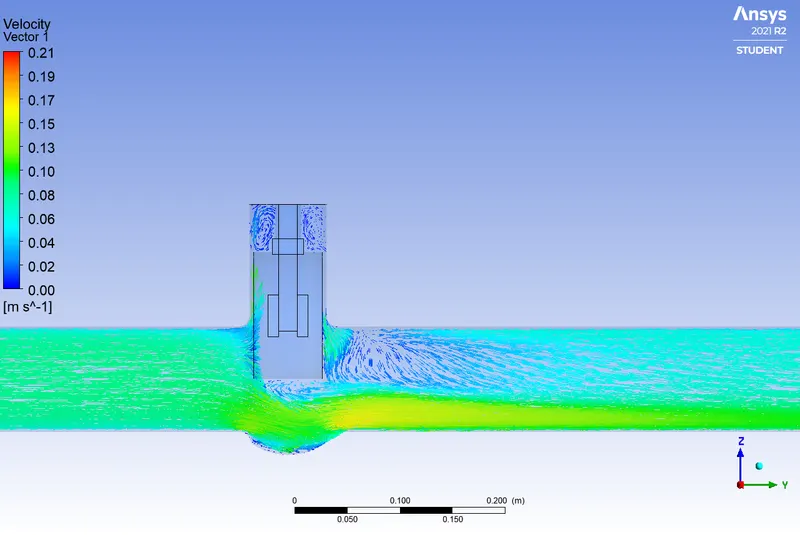
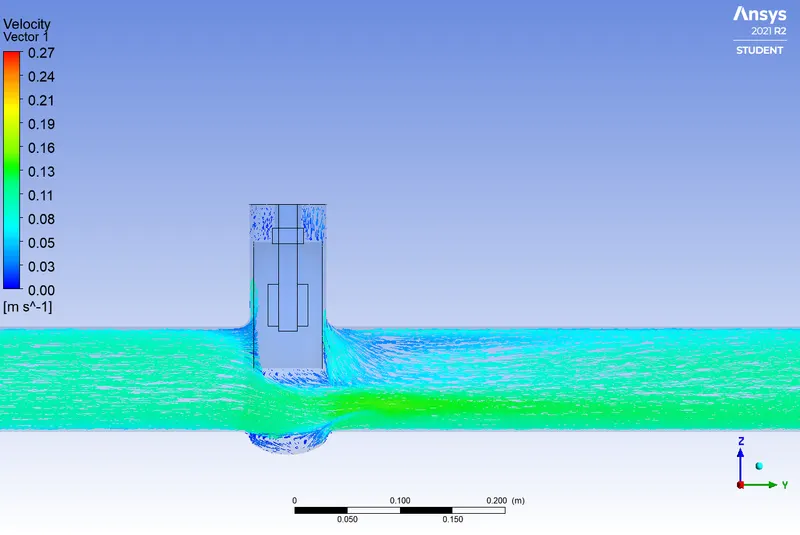
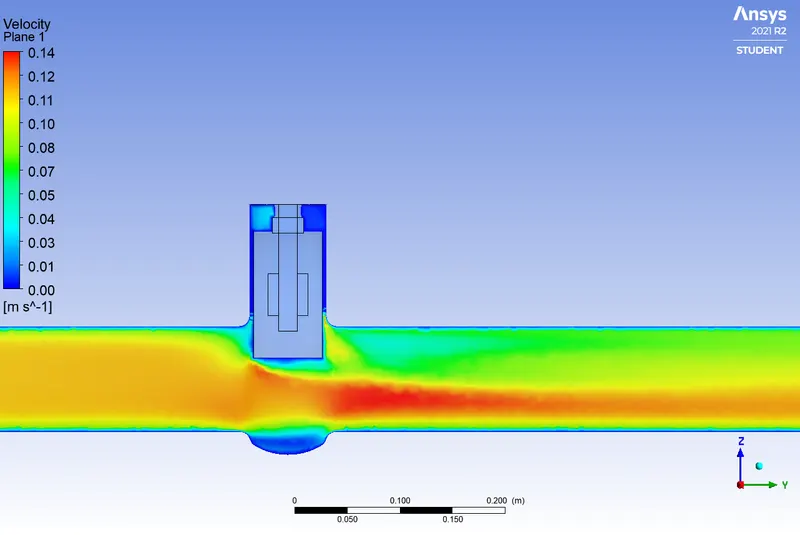
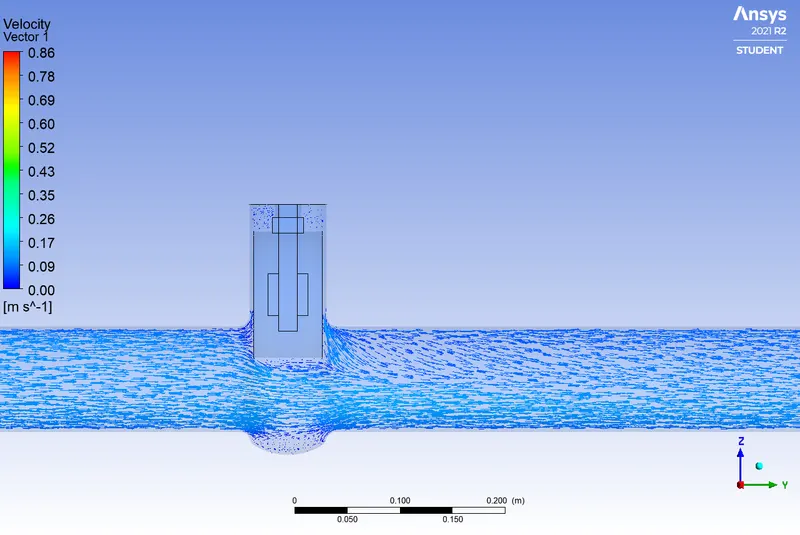
- Post Processing: The results of the simulation have been post processed in the CFD Post. The Pressure and Velocity contours generated along with velocity vector plots.
- To perform the parametric study of the effect of valve lift on the mass flow rate at the outlet. The design points are created into parameters section of the Project Schematics in the workbench with different values of valve lift. Then the solution has been obtained for all design points in the parameters.
Project Schematic 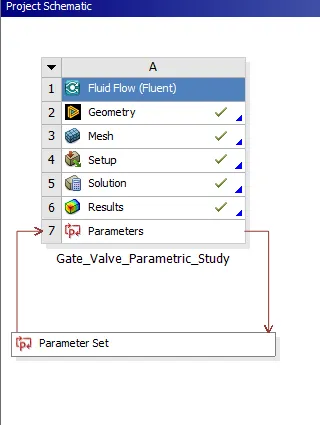
Parameters - Outline of Schematic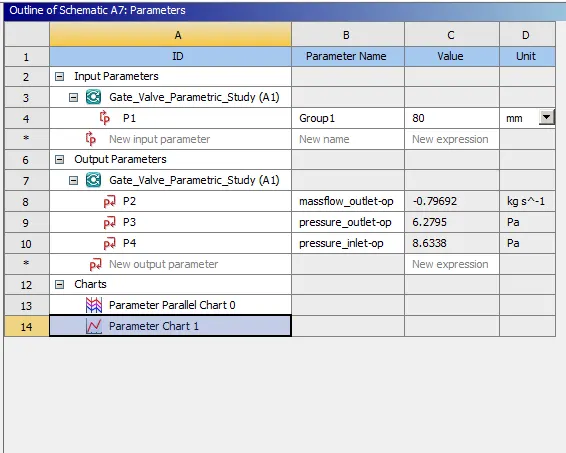
Table of Design Points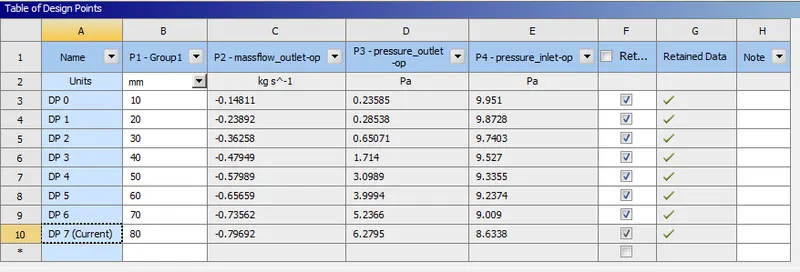
Output Parameters:
P2: Mass flow rate at Outlet;
P3:Pressure at Downstream of the valve at 125 mm;
P3:Pressure at Upstream of the valve at 125 mm;
Parameter Chart: Mass Flow rate at Outlet Vs Valve Lift (Design Point)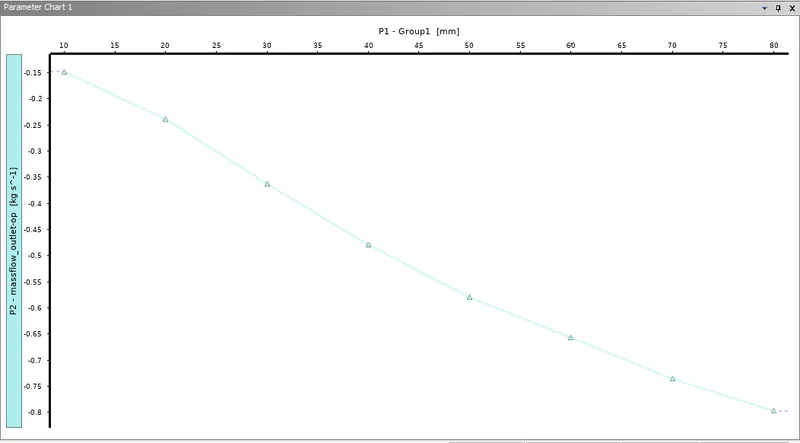
- The results of the parametric study are analysed and the conclusions are drawn.
- dp_0:(10 mm valve lift)
Geometry Cross section- Front View
(Without Fluid Volume)Geometry Cross section-
(With Fluid Volume)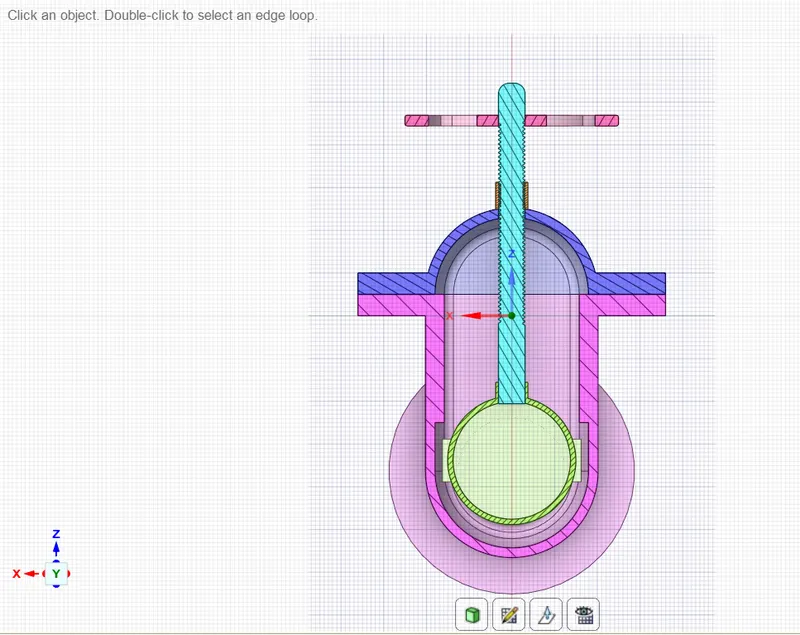
Mesh: Mesh:Cross Sectional View Mesh Details Mesh Metrics 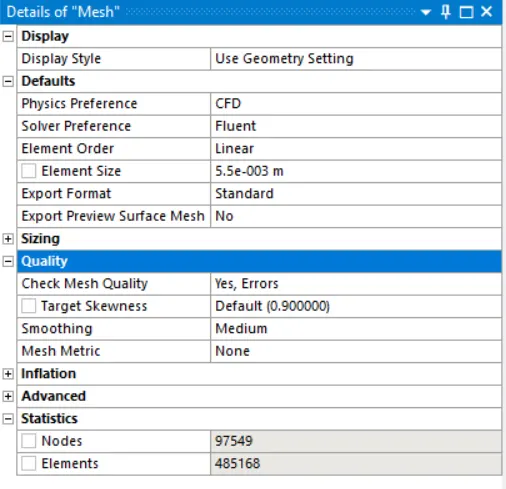
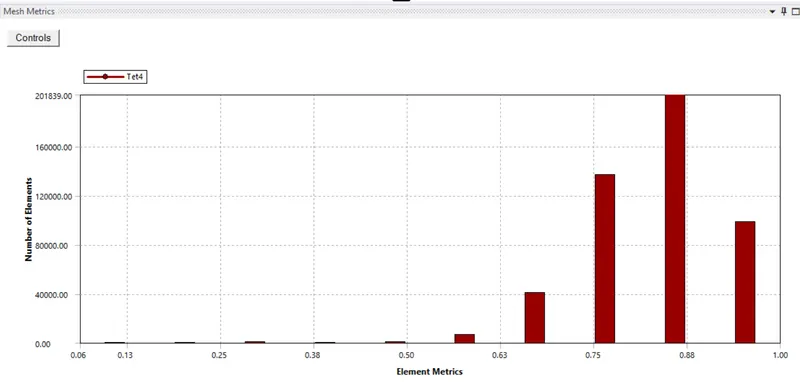
Residuals Graph Monitor Report: Mass flowrate at Outlet 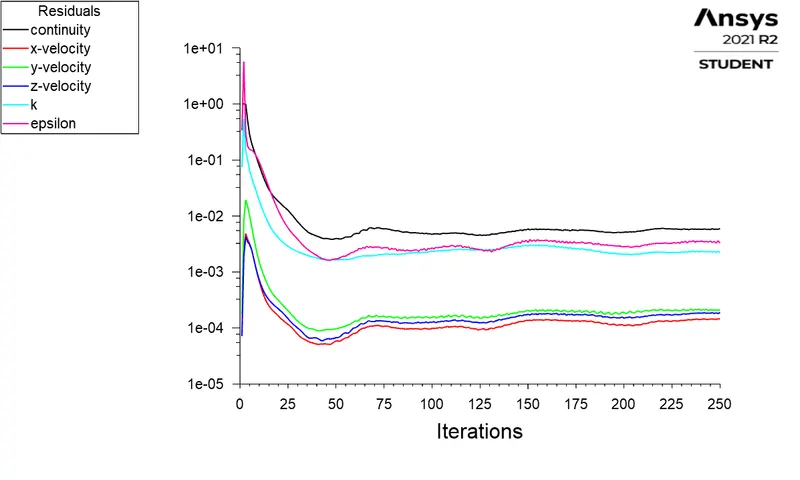
Pressure Contours Velocity Contours 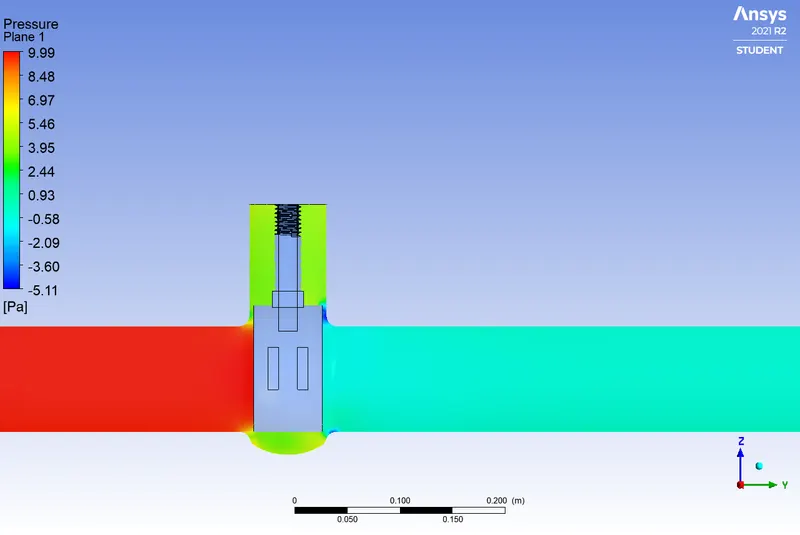
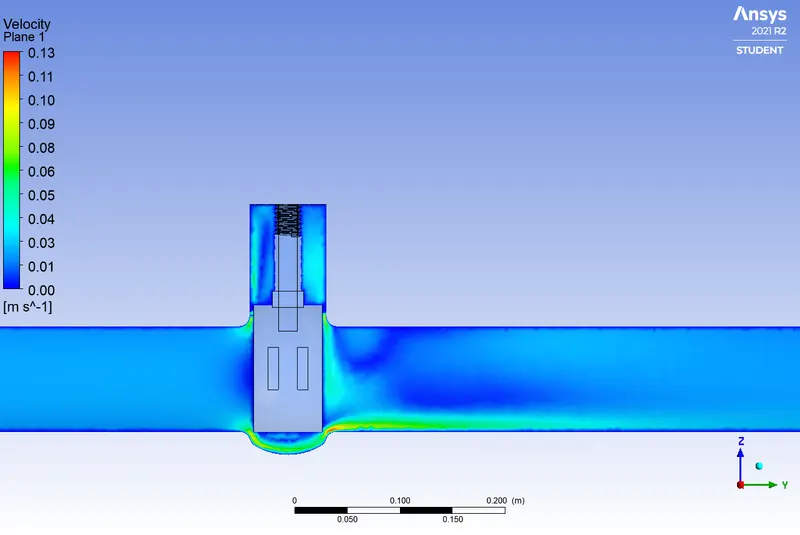
Mass flux balance report Velocity Vector plot 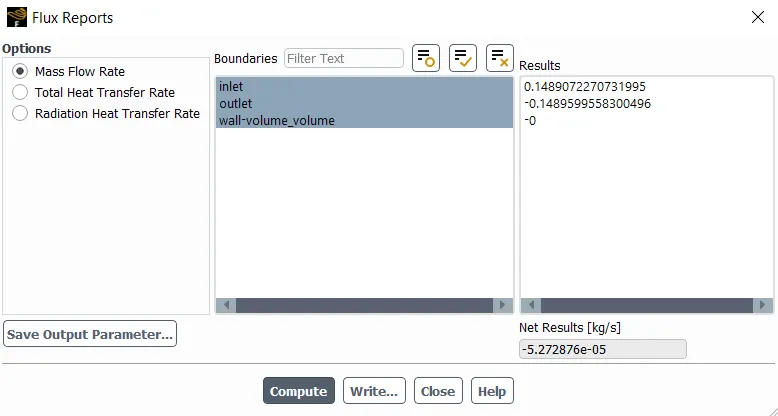
- dp_1:(20 mm valve lift)
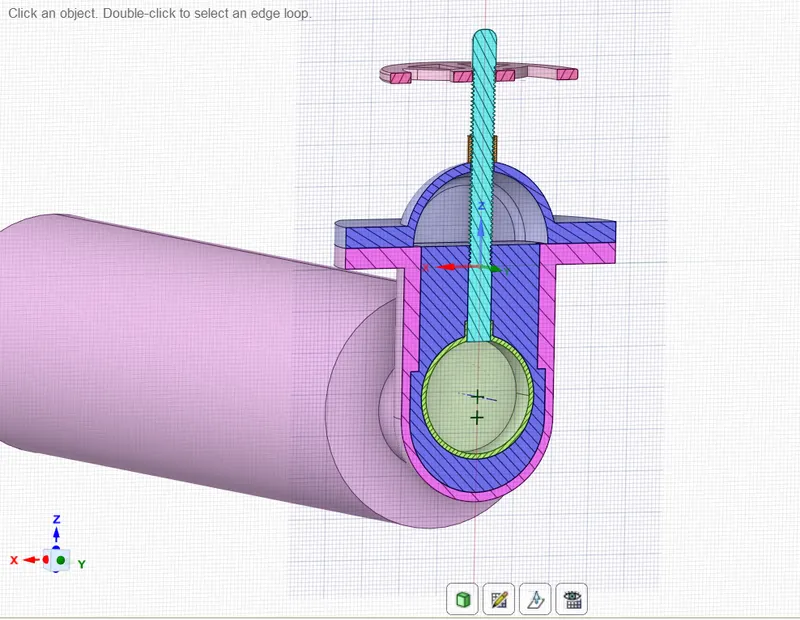
Geometry Cross section- Front View
(Without Fluid Volume)Geometry Cross section-
(With Fluid Volume)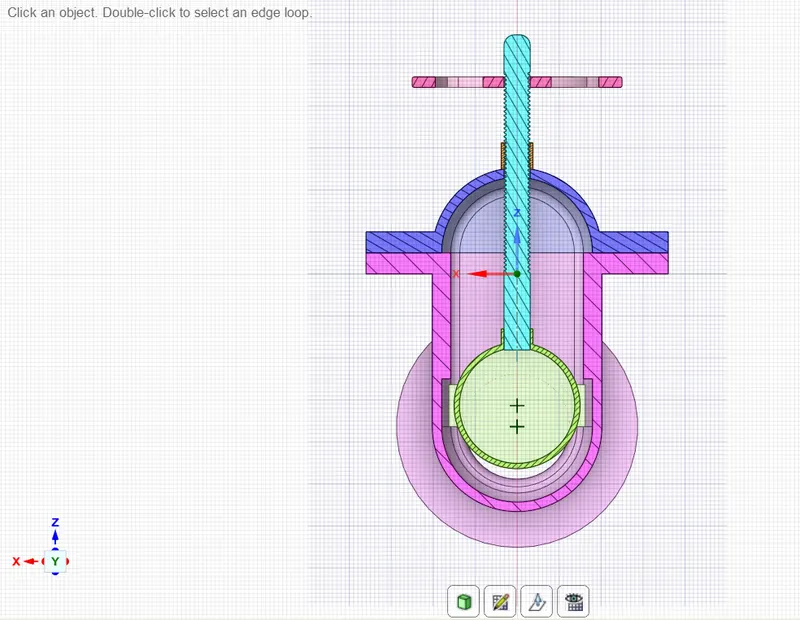
Mesh: Mesh:Cross Sectional View 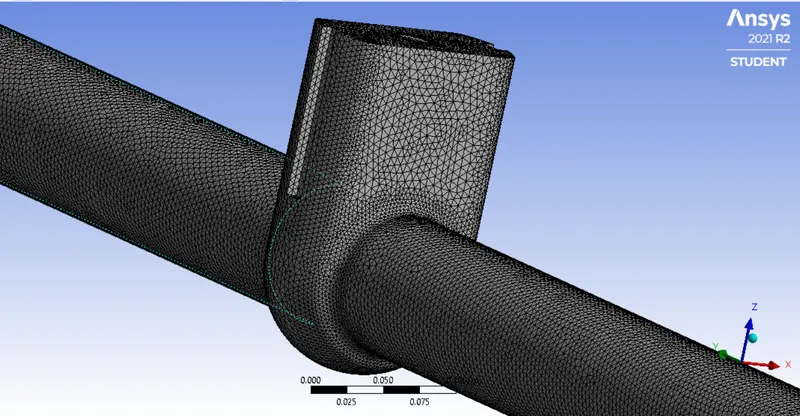
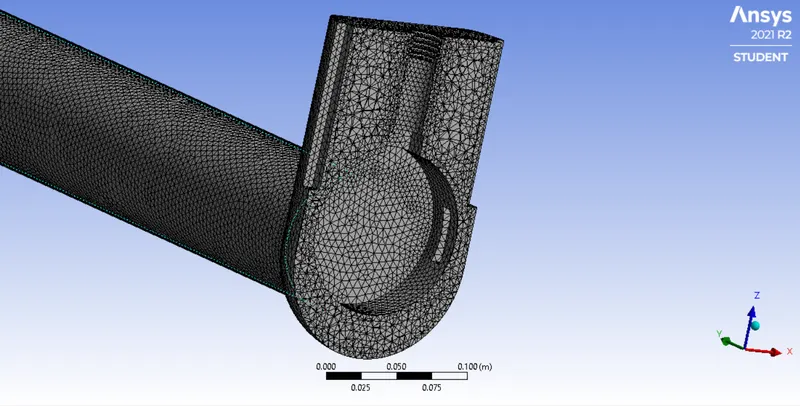
Mesh Details Mesh Metrics 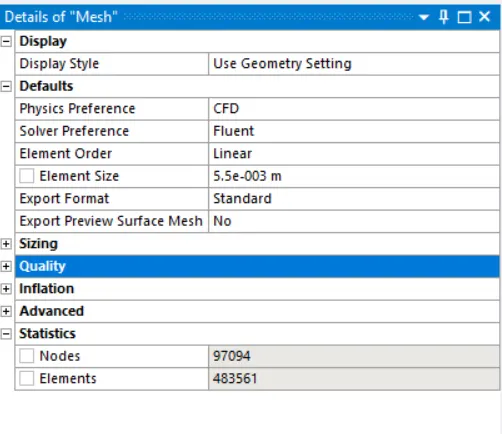
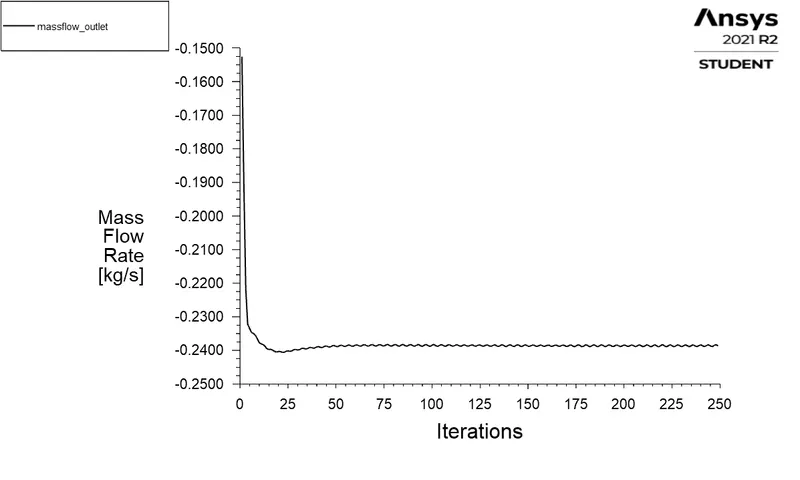
Residuals Graph Monitor Report: Mass flowrate at Outlet 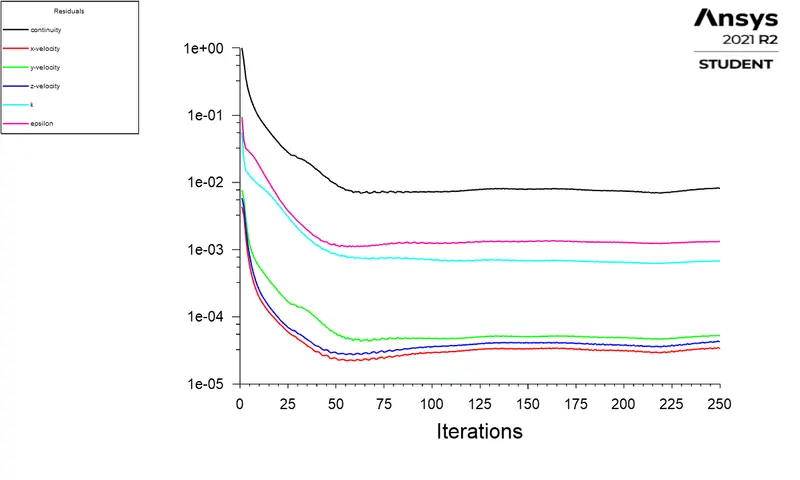
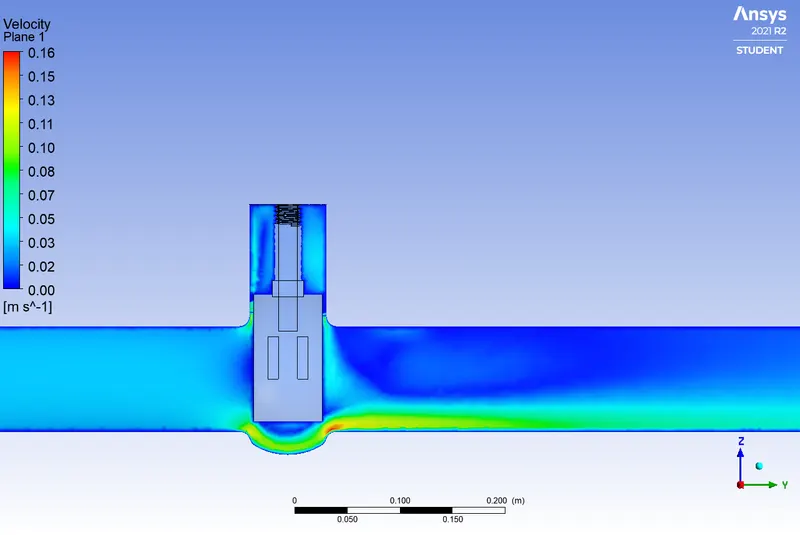
Pressure Contours Velocity Contours 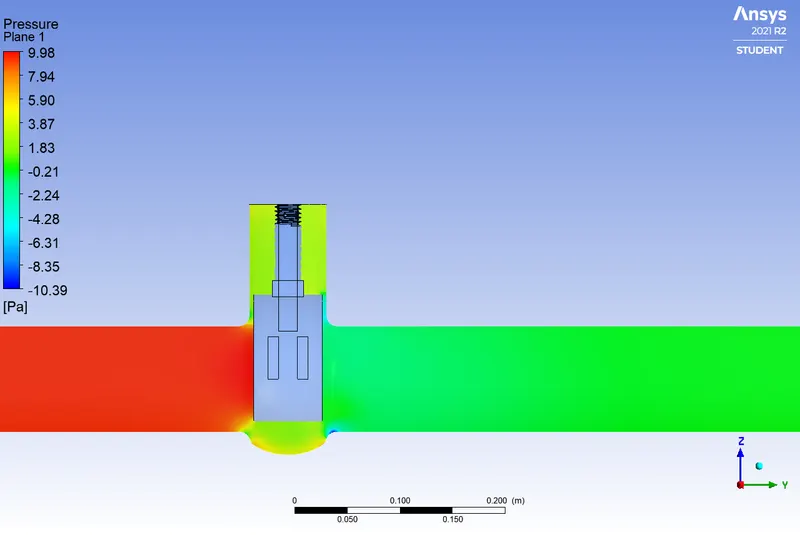
Mass flux balance report Velocity Vector plot 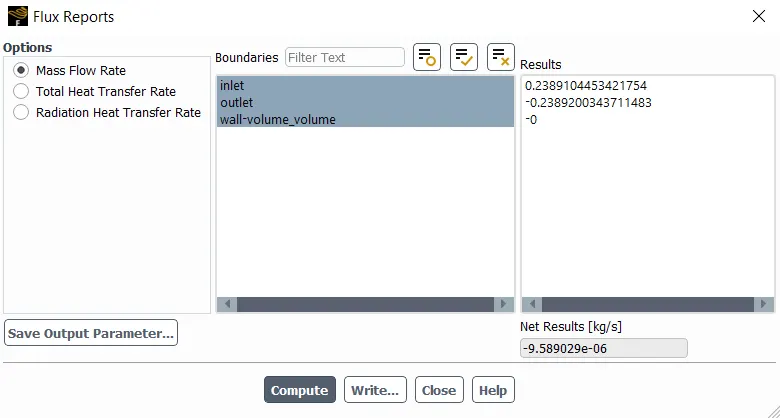
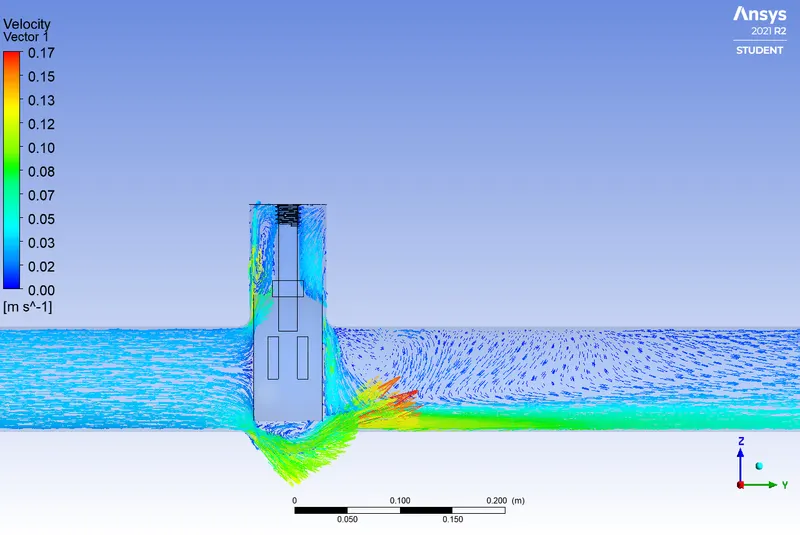
- dp_2:(30 mm valve lift)
Geometry Cross section- Front View
(Without Fluid Volume)Geometry Cross section-
(With Fluid Volume)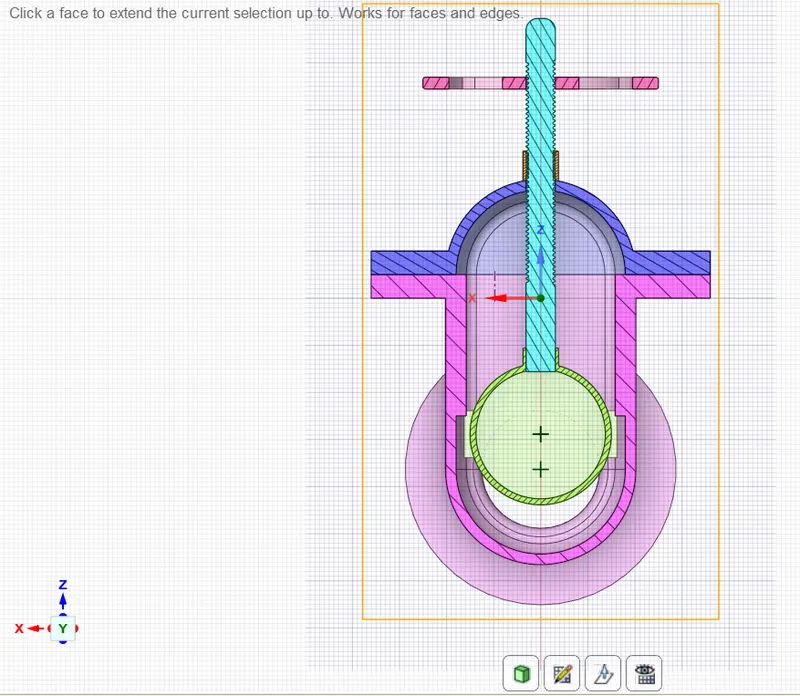
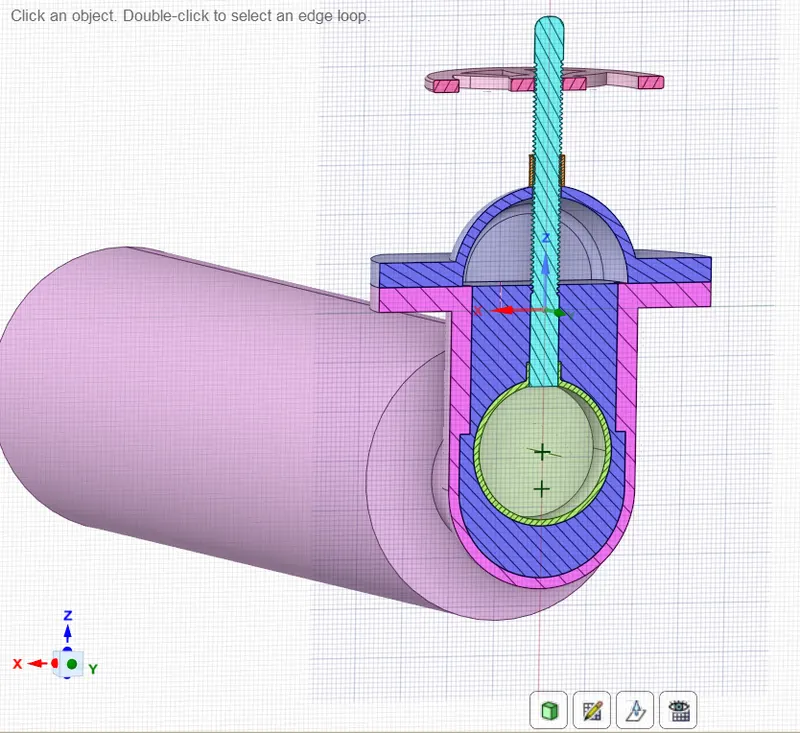
Mesh: Mesh:Cross Sectional View 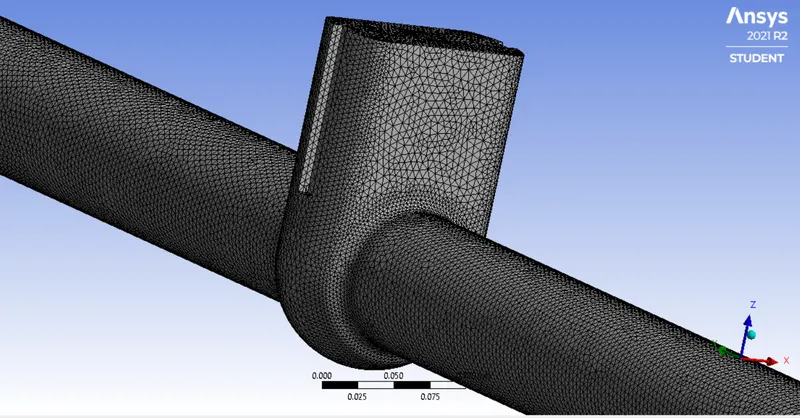
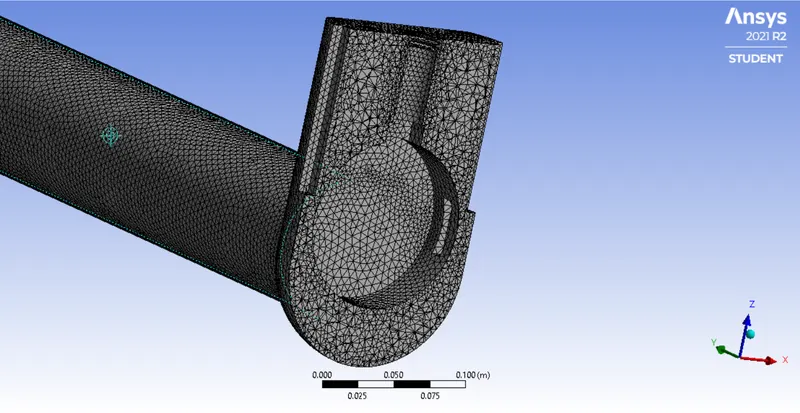
Mesh Details Mesh Metrics 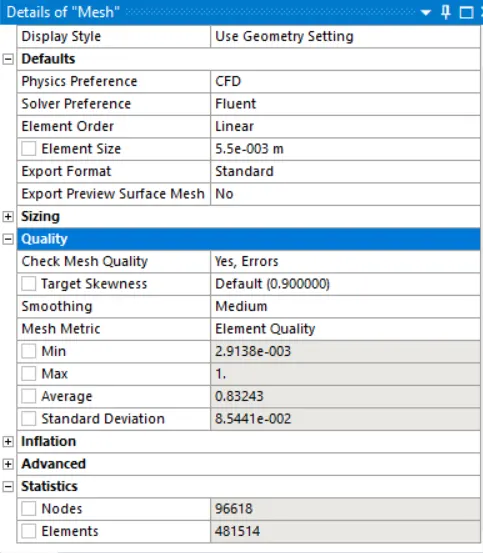
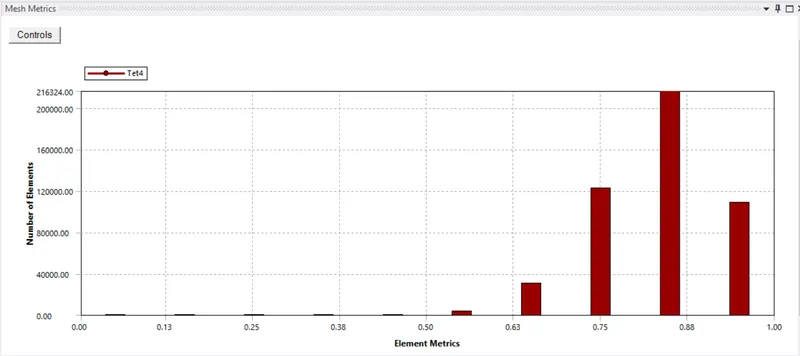
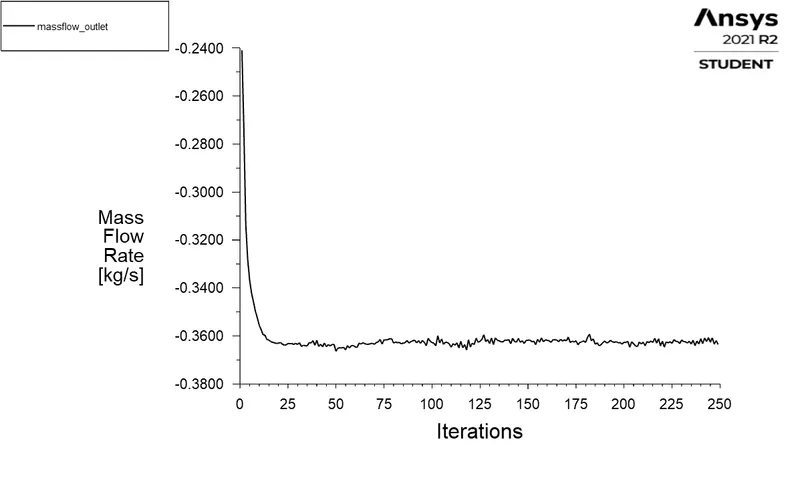
Residuals Graph Monitor Report: Mass flowrate at Outlet 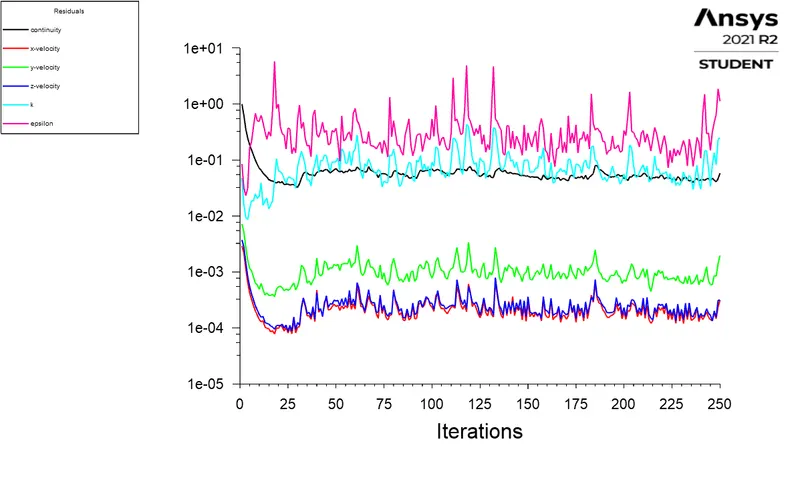
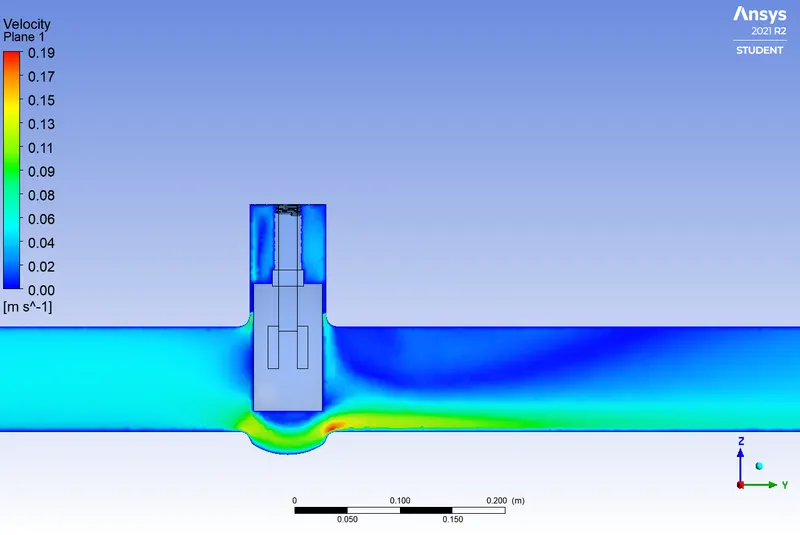
Pressure Contours Velocity Contours 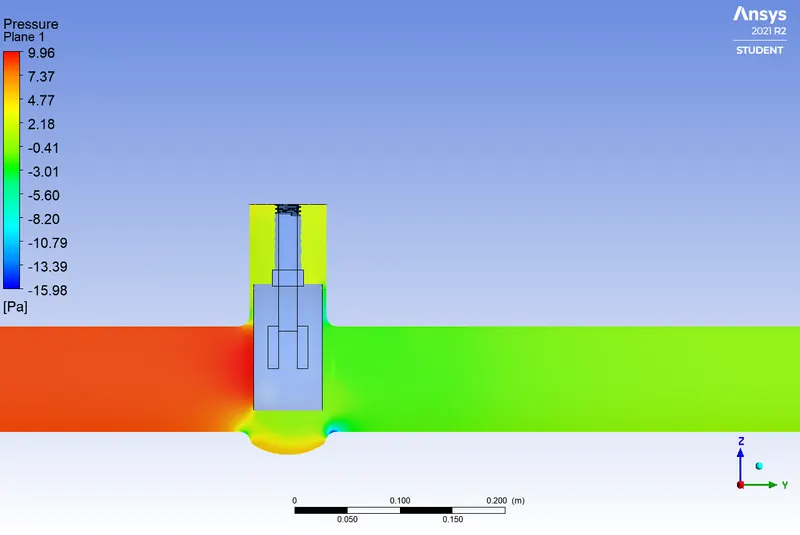
Mass flux balance report Velocity Vector plot 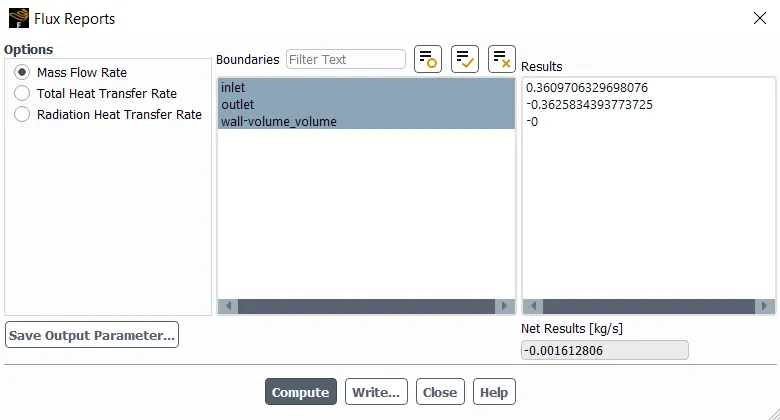
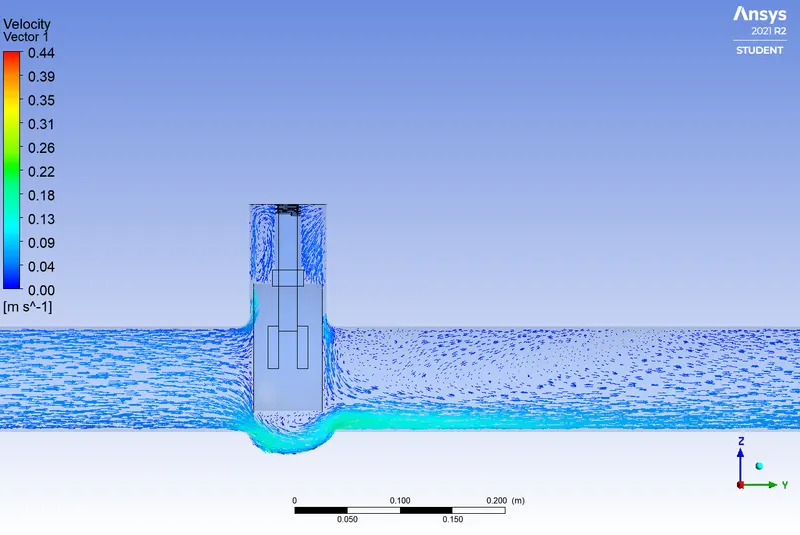
- dp_3:(40 mm valve lift)
Geometry Cross section- Front View
(Without Fluid Volume)Geometry Cross section-
(With Fluid Volume)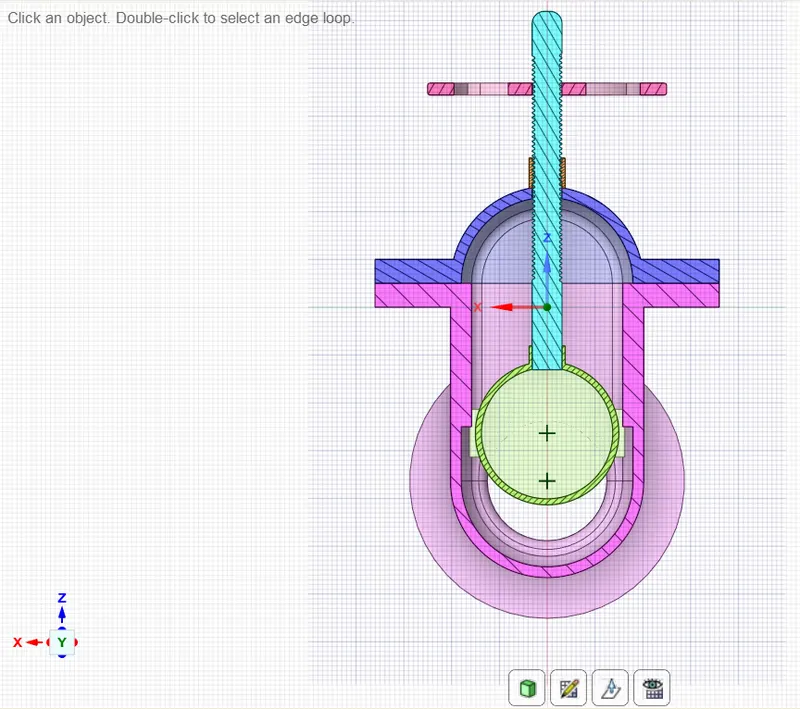
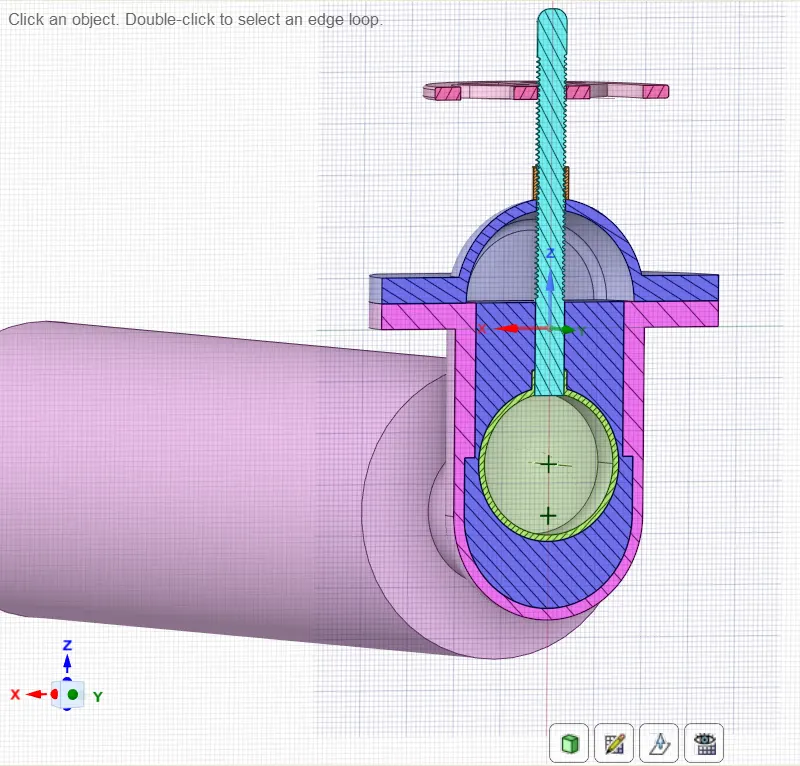
Mesh: Mesh:Cross Sectional View 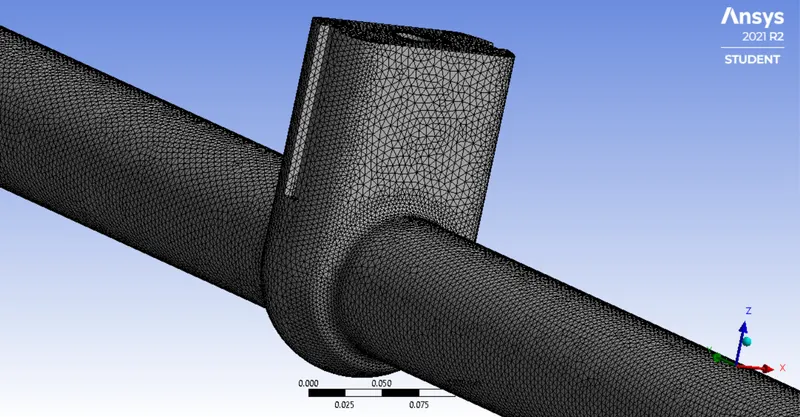
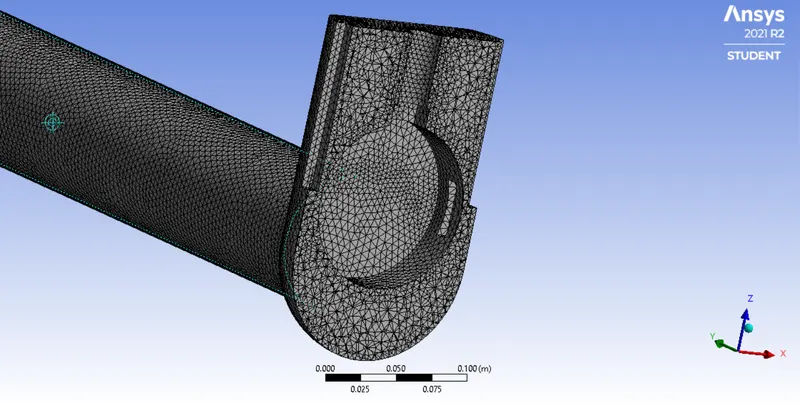
Mesh Details Mesh Metrics 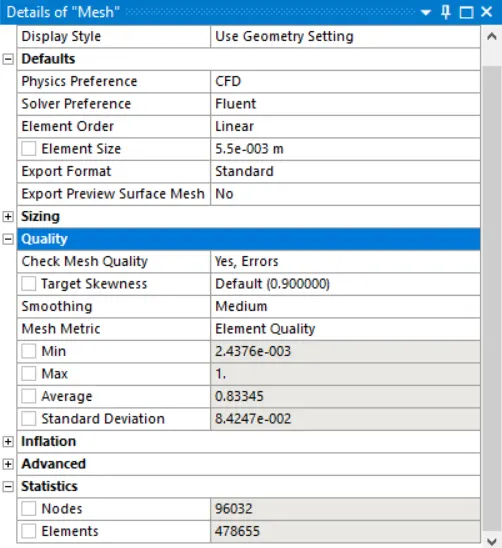
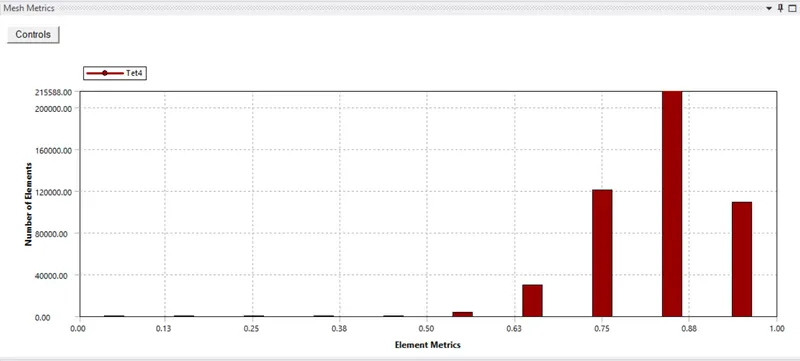
Residuals Graph Monitor Report: Mass flowrate at Outlet 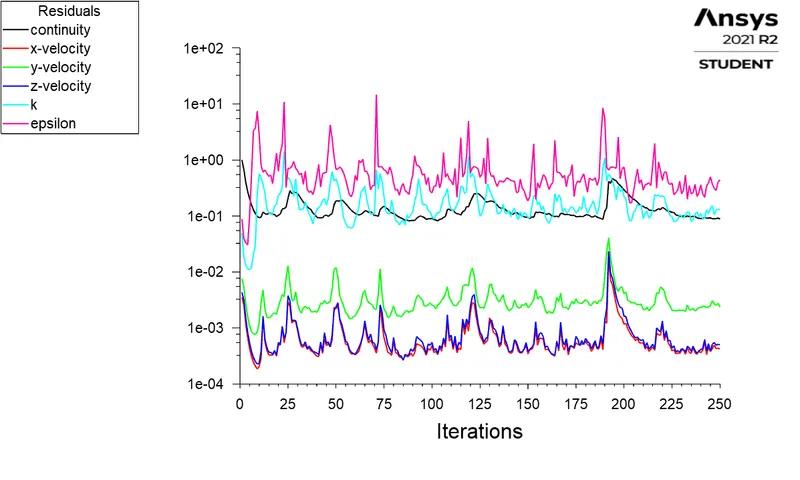
Pressure Contours Velocity Contours 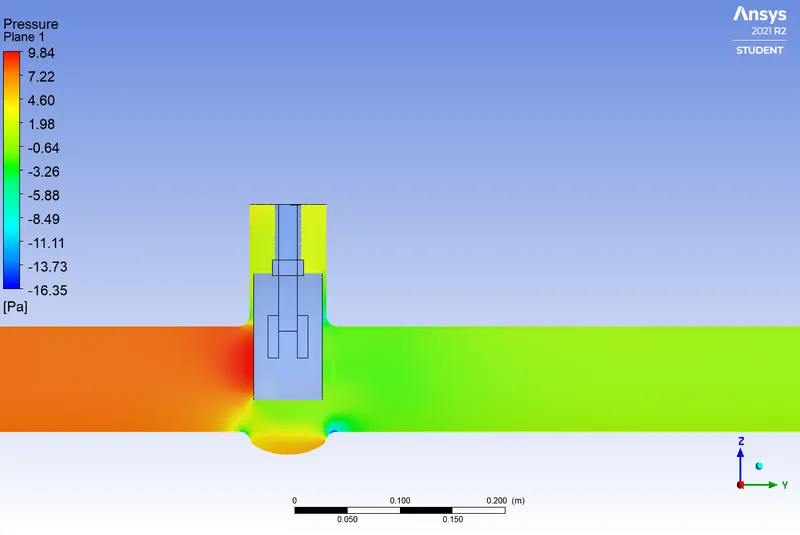
Mass flux balance report Velocity Vector plot 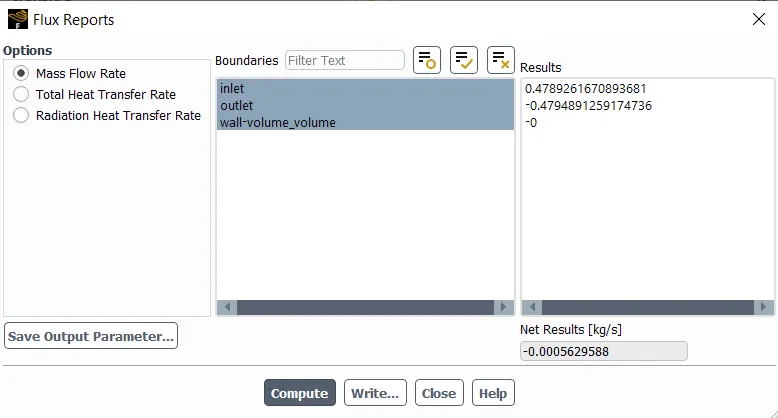
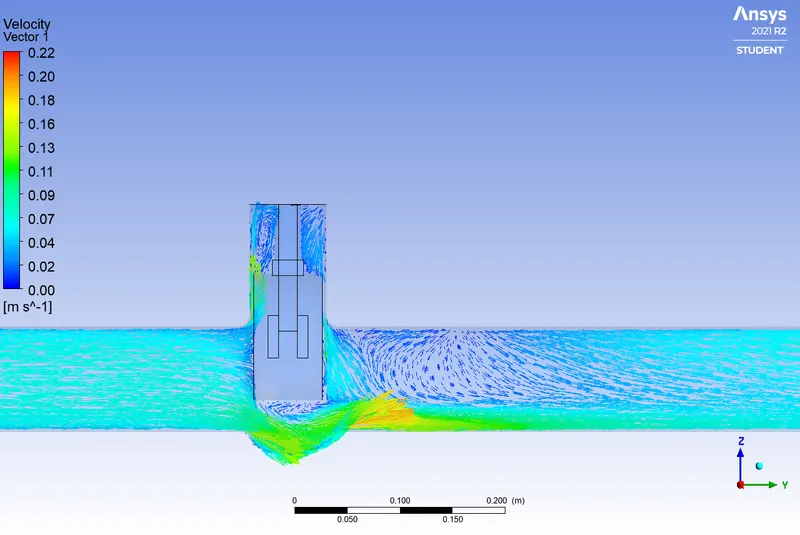
- dp_4:(50 mm valve lift)
Geometry Cross section- Front View
(Without Fluid Volume)Geometry Cross section-
(With Fluid Volume)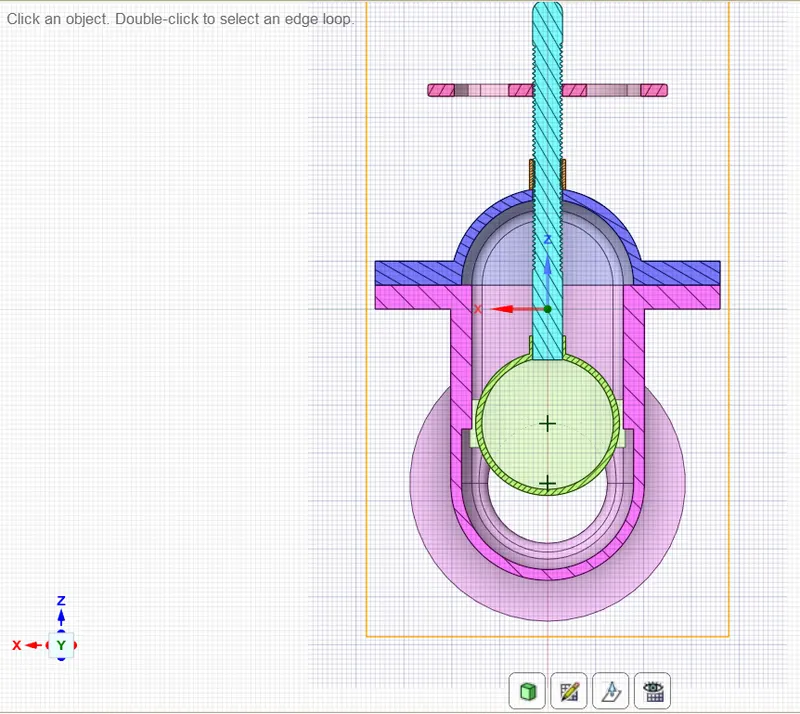
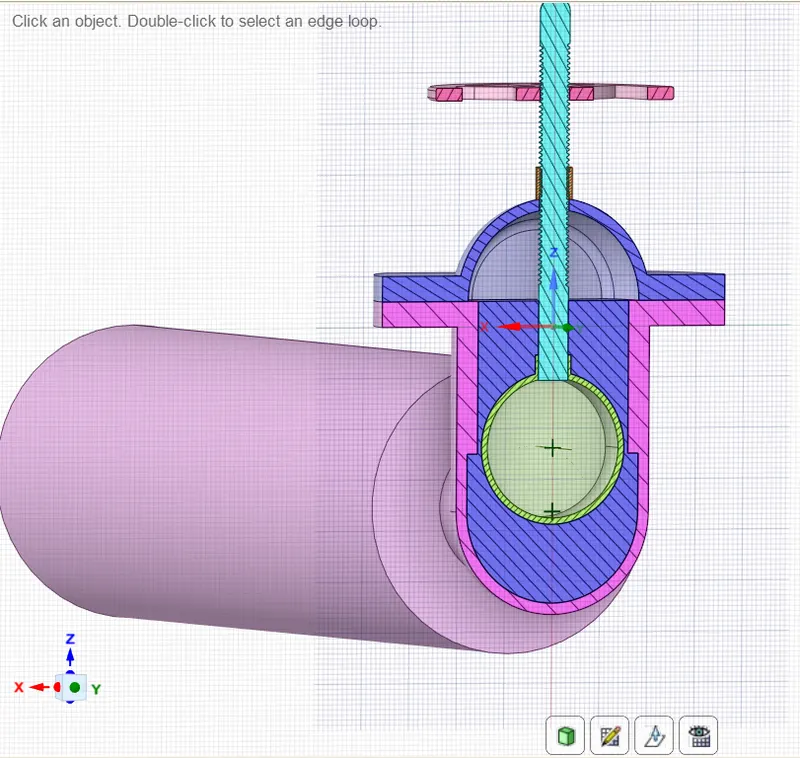
Mesh: Mesh:Cross Sectional View 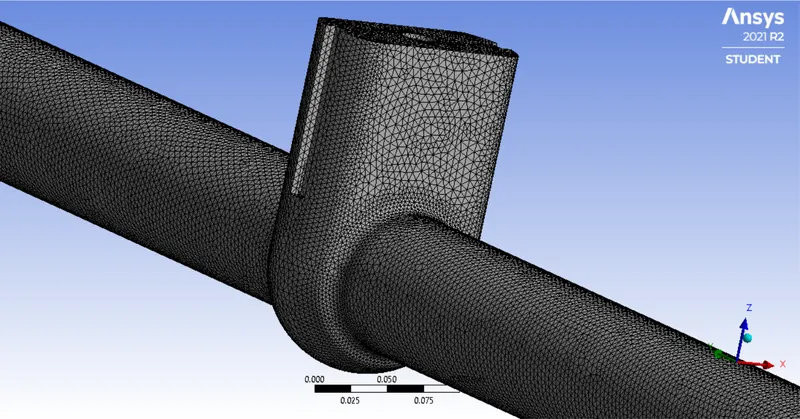
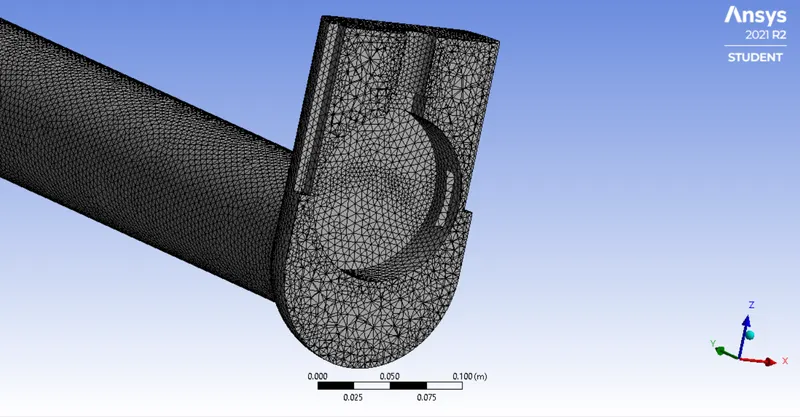
Mesh Details Mesh Metrics 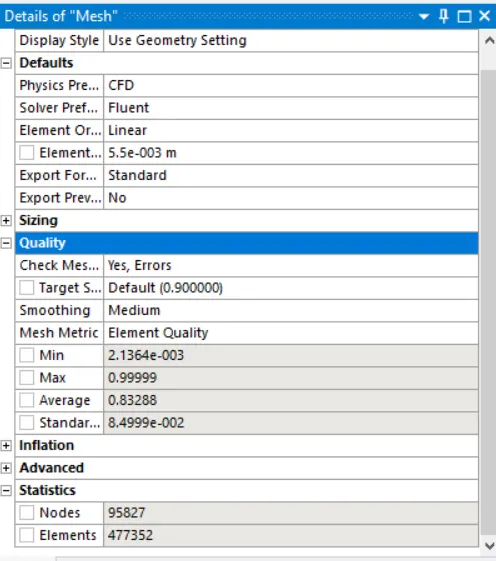
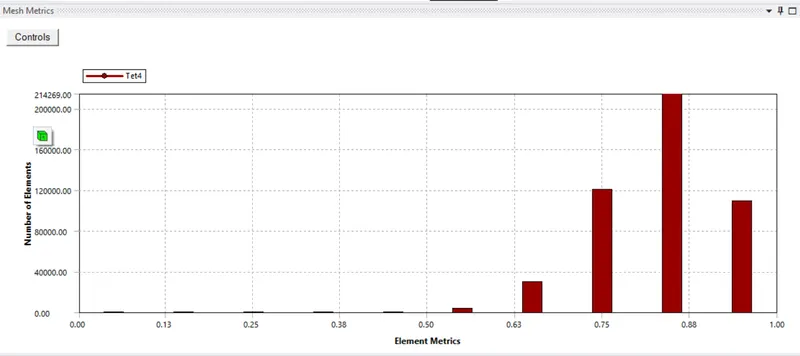
Residuals Graph Monitor Report: Mass flowrate at Outlet 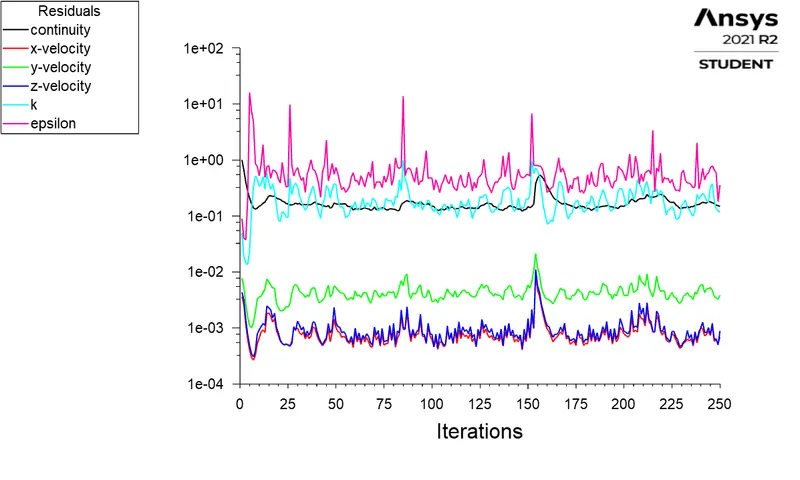
Pressure Contours Velocity Contours 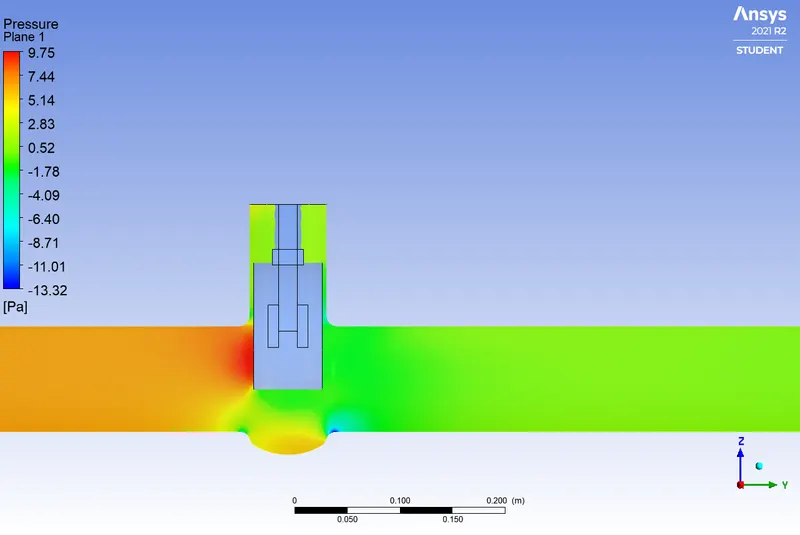
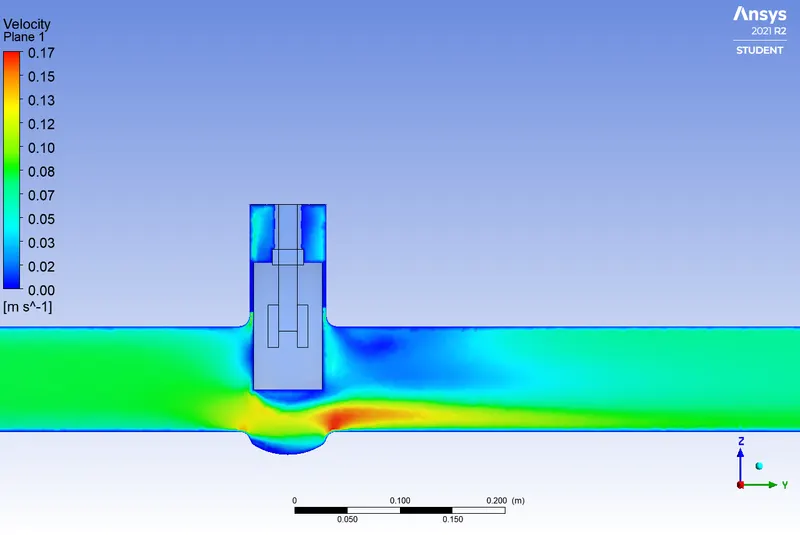
Mass flux balance report Velocity Vector plot 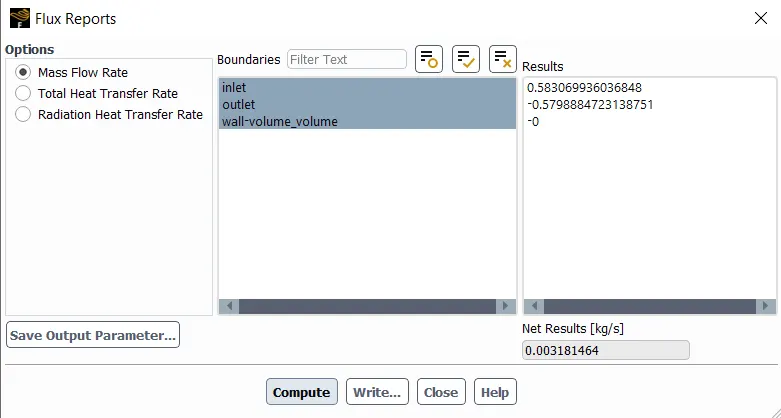
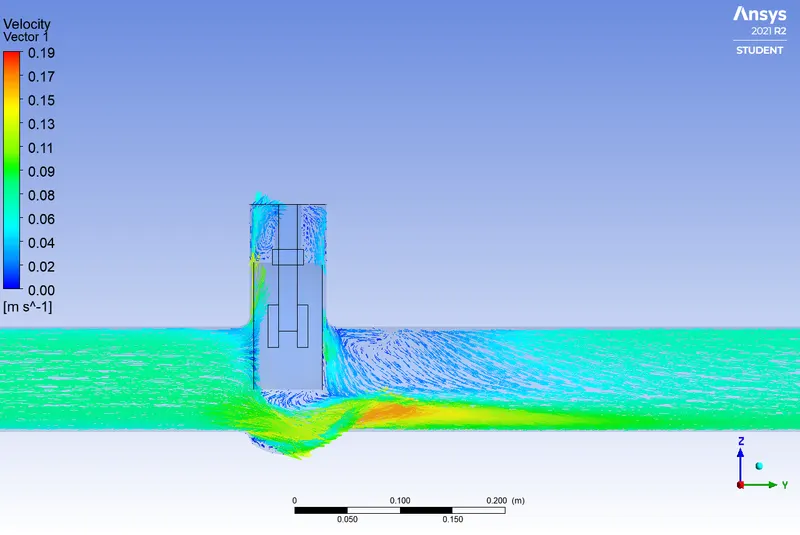
- dp_5:(60 mm valve lift)
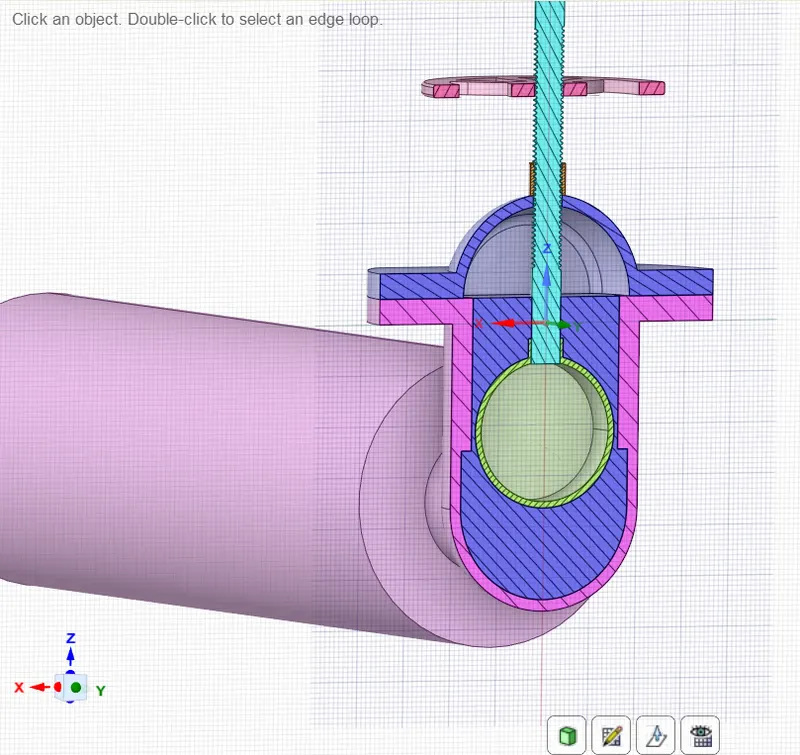
Geometry Cross section- Front View
(Without Fluid Volume)Geometry Cross section-
(With Fluid Volume)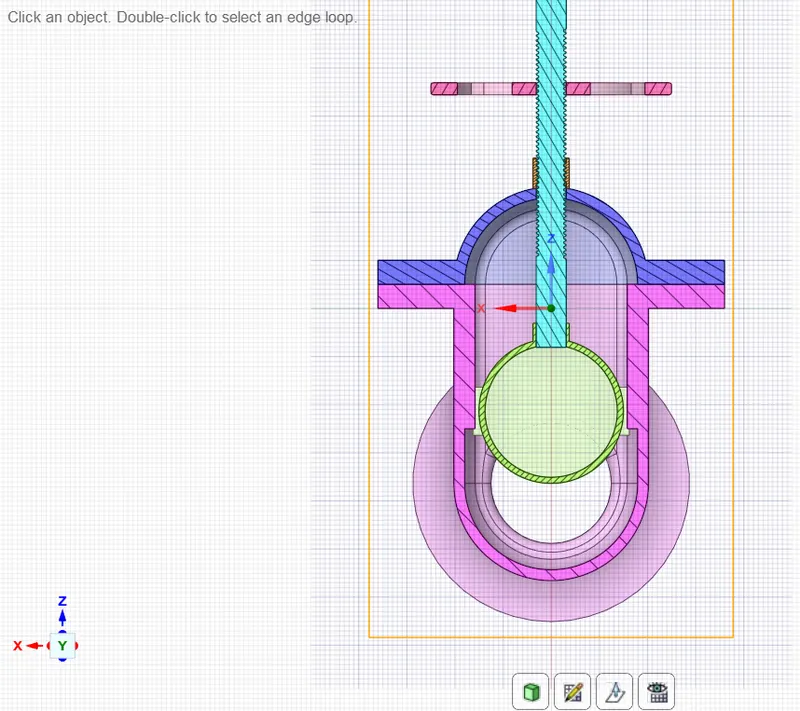
Mesh: Mesh:Cross Sectional View 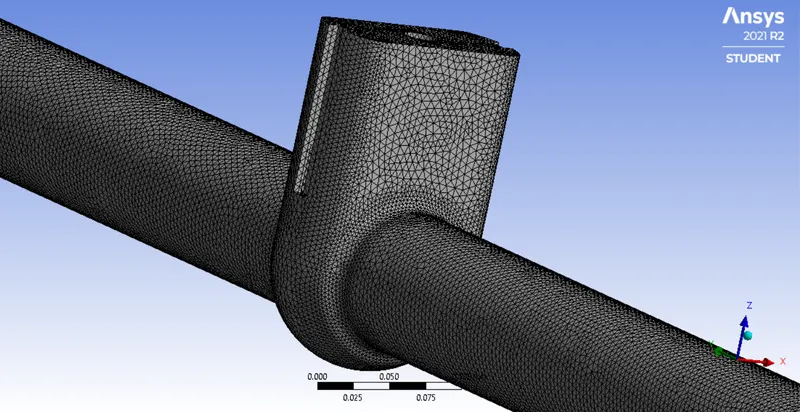
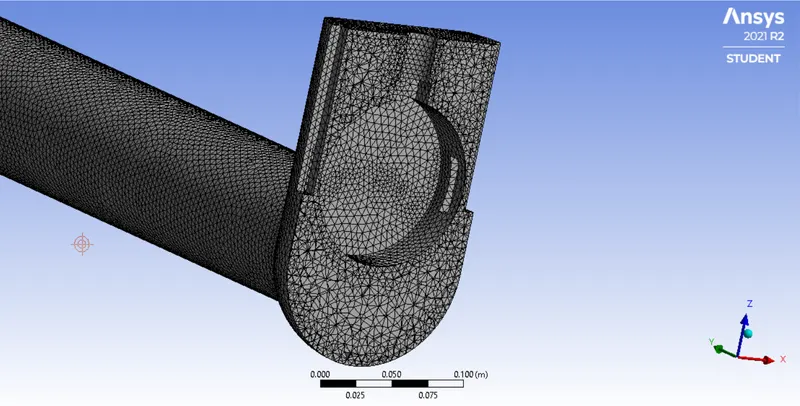
Mesh Details Mesh Metrics 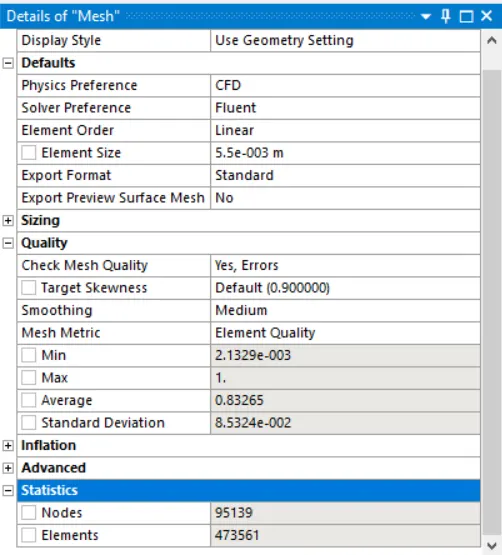
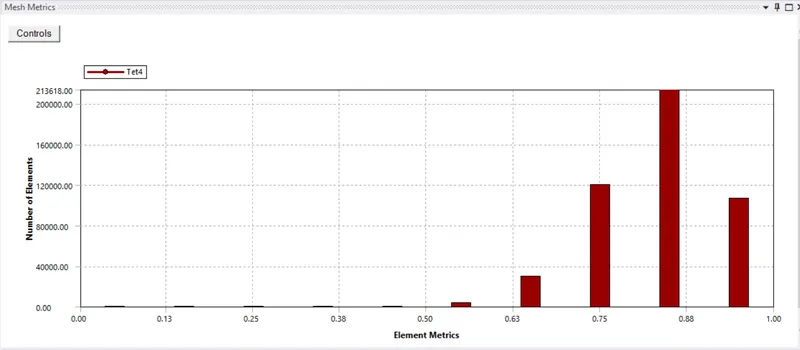
Residuals Graph Monitor Report: Mass flowrate at Outlet 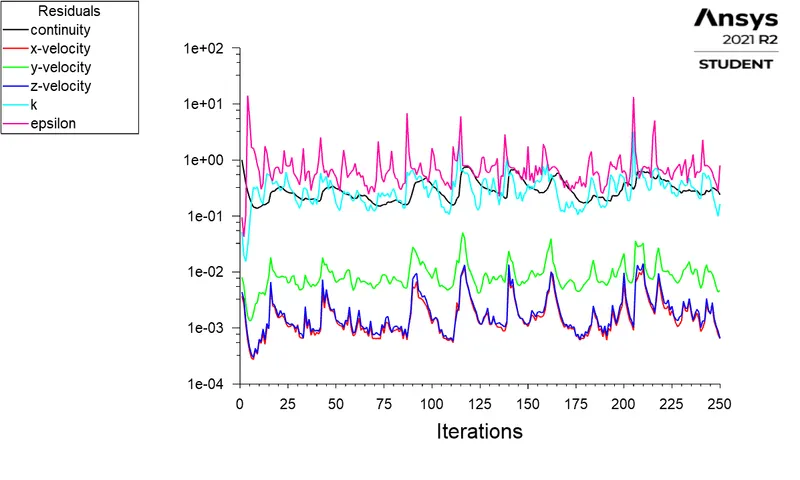
Pressure Contours Velocity Contours 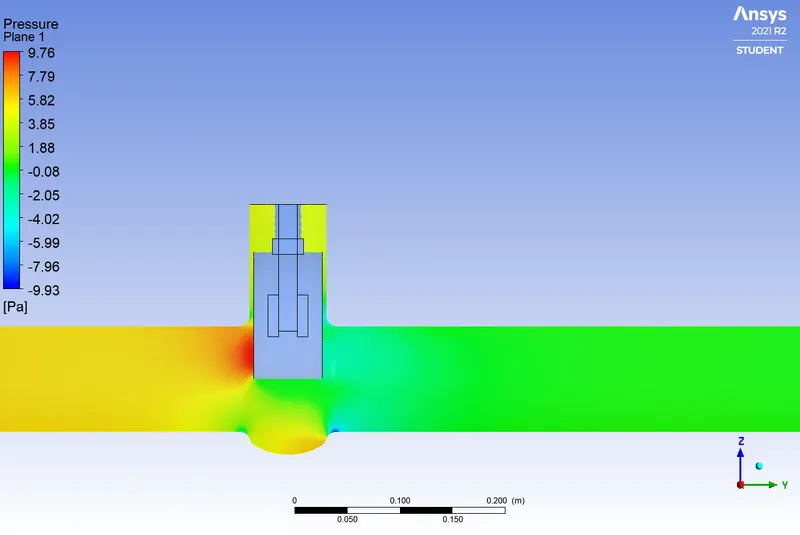
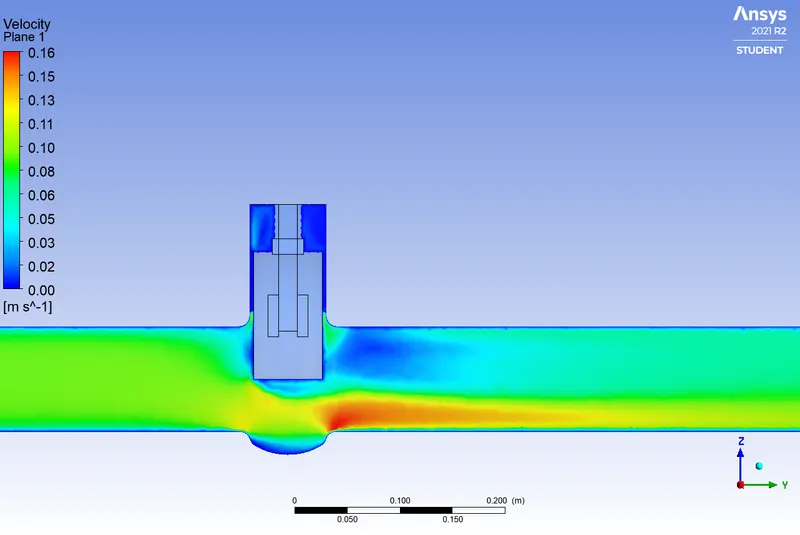
Mass flux balance report Velocity Vector plot 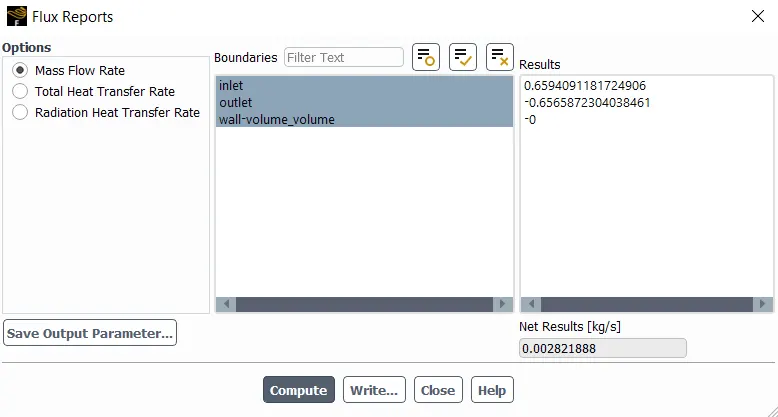
- dp_6:(70 mm valve lift)
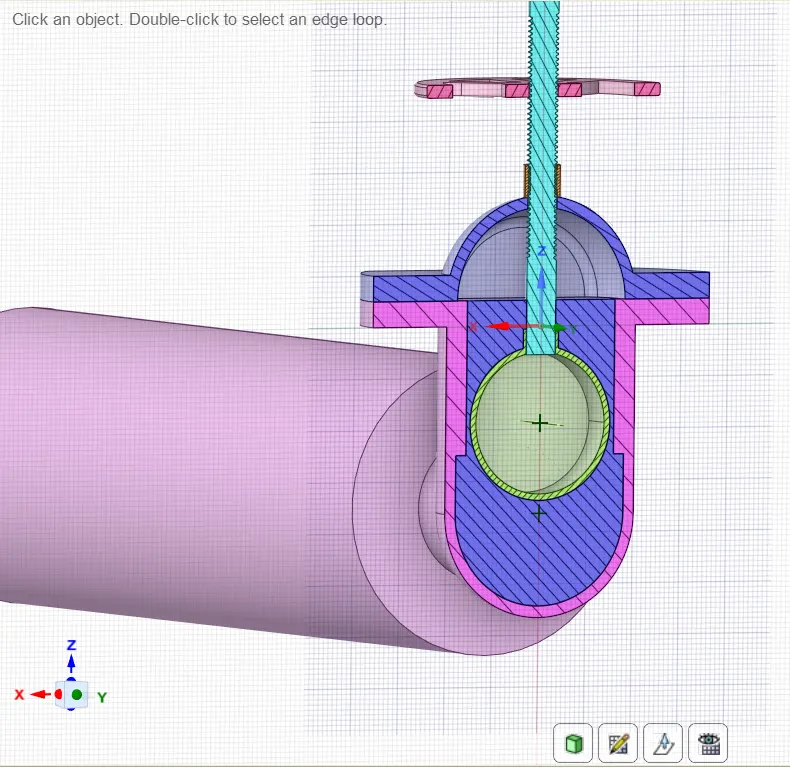
Geometry Cross section- Front View
(Without Fluid Volume)Geometry Cross section-
(With Fluid Volume)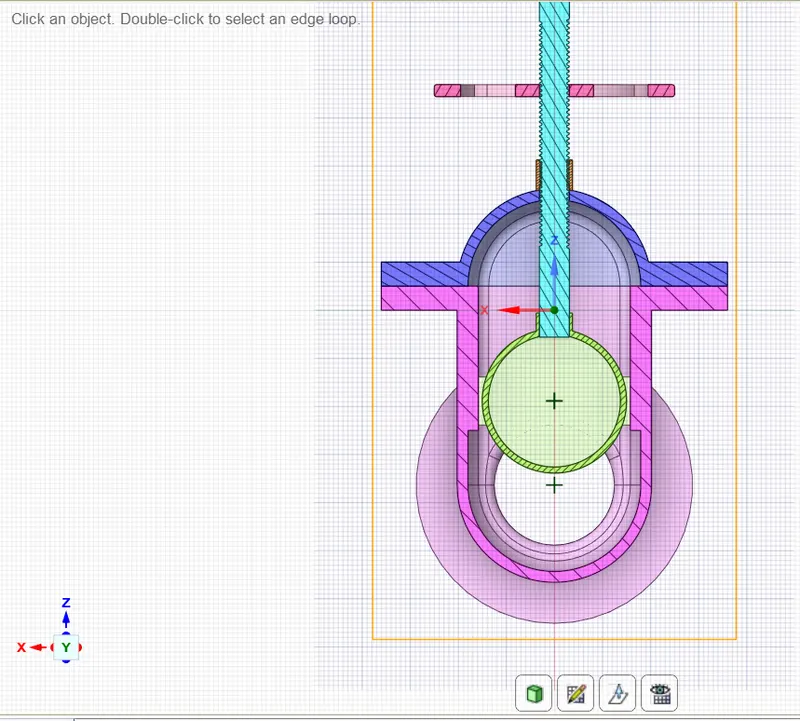
Mesh: Mesh:Cross Sectional View 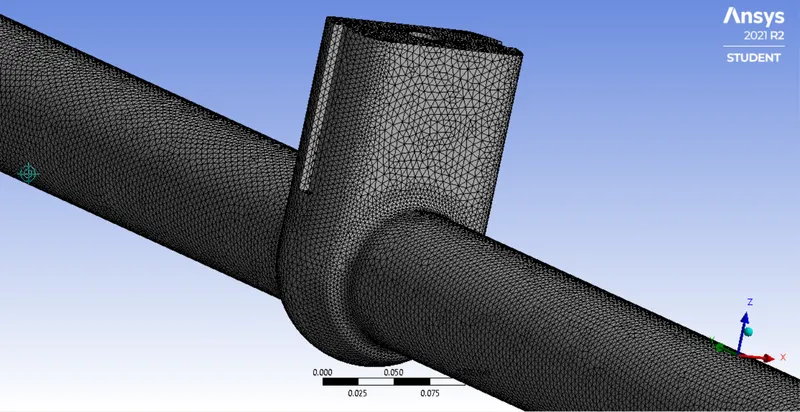
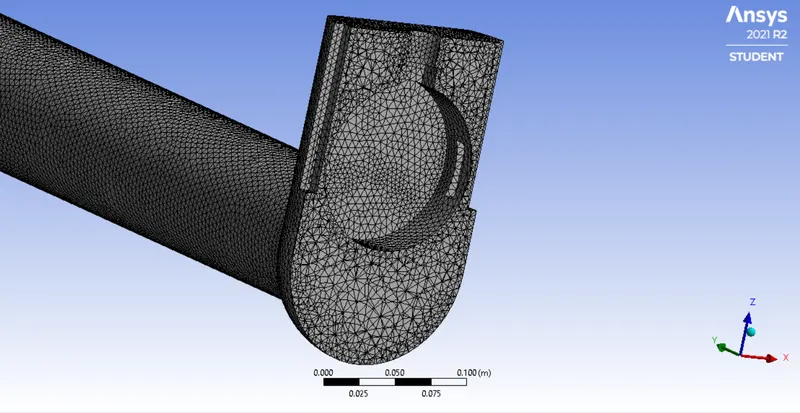
Mesh Details Mesh Metrics 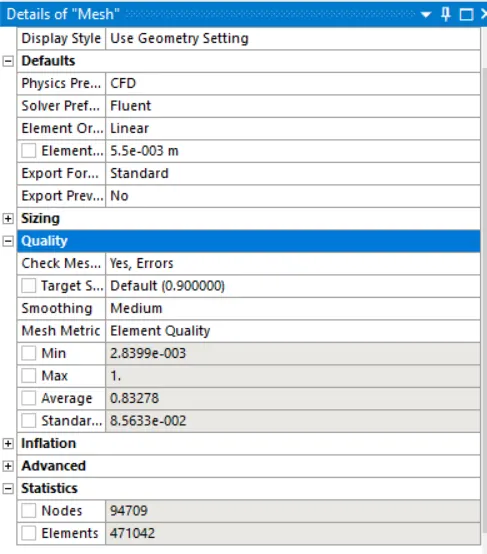
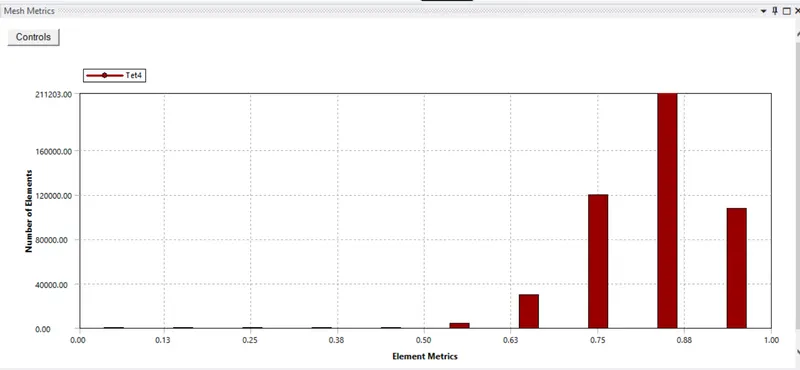
Residuals Graph Monitor Report: Mass flowrate at Outlet 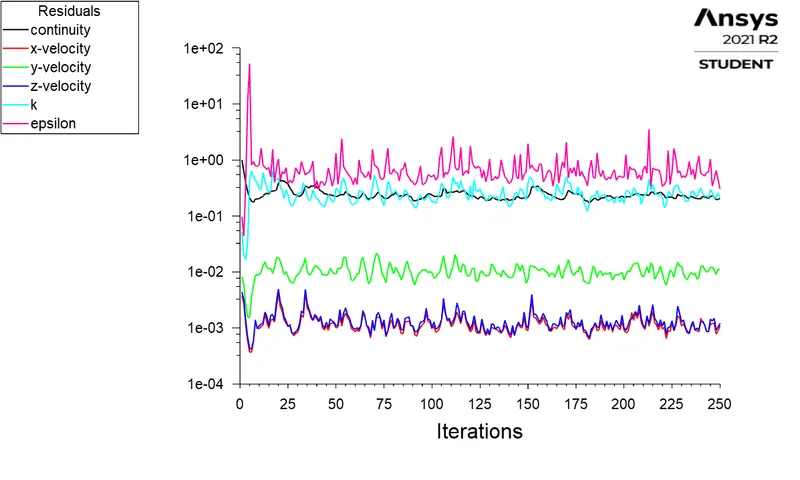
Pressure Contours Velocity Contours 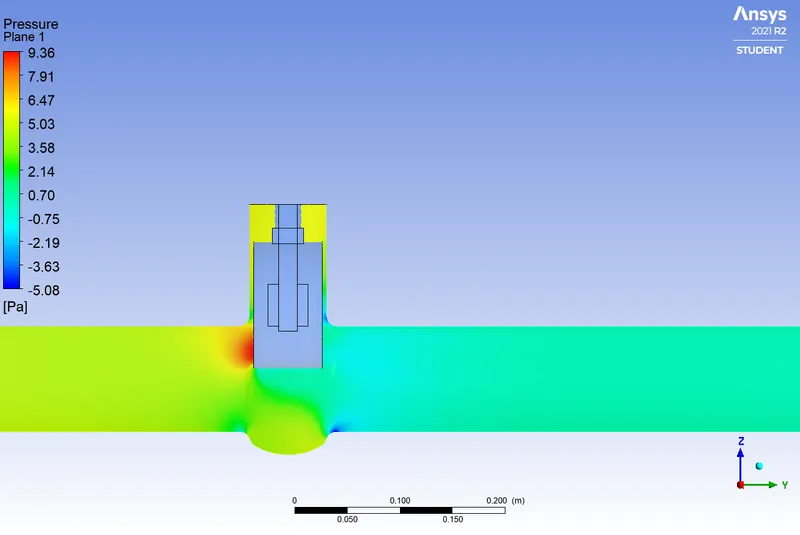
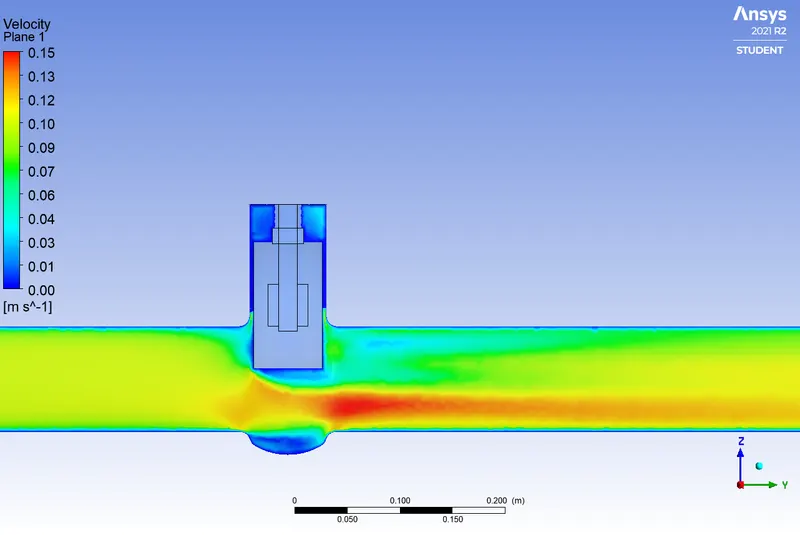
Mass flux balance report Velocity Vector plot 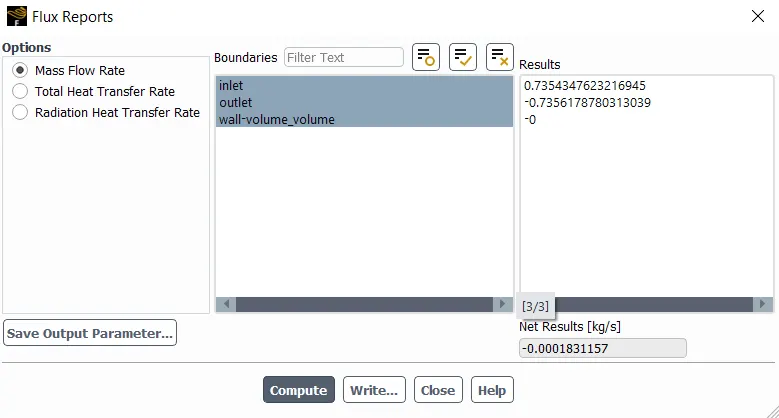
- dp_7:(80 mm valve lift)
Geometry Cross section- Front View
(Without Fluid Volume)Geometry Cross section-
(With Fluid Volume)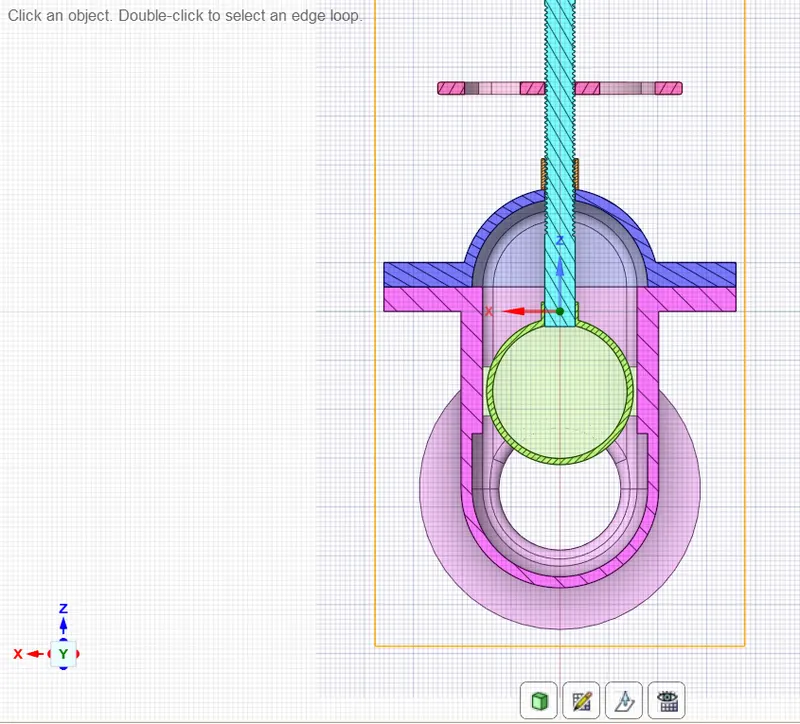
Mesh: Mesh:Cross Sectional View 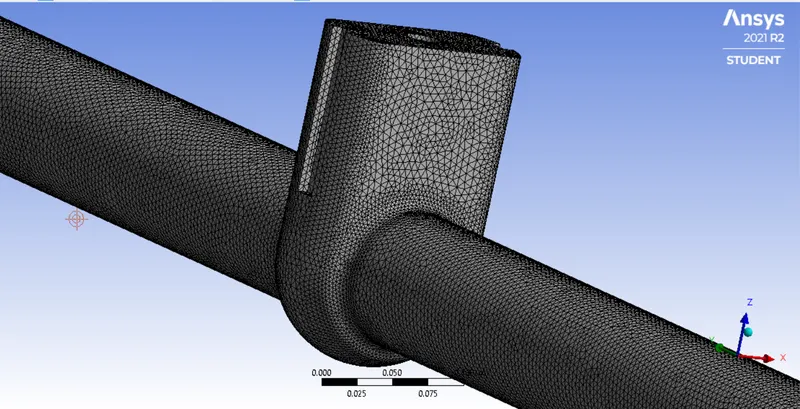
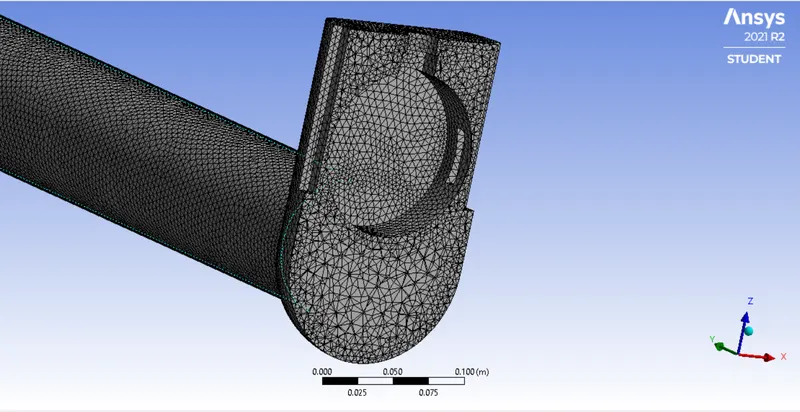
Mesh Details Mesh Metrics 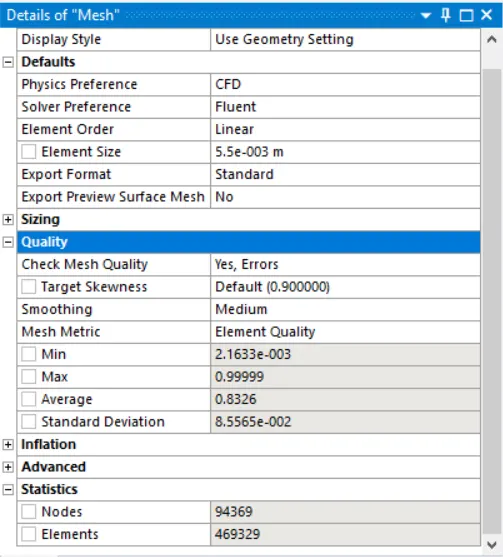
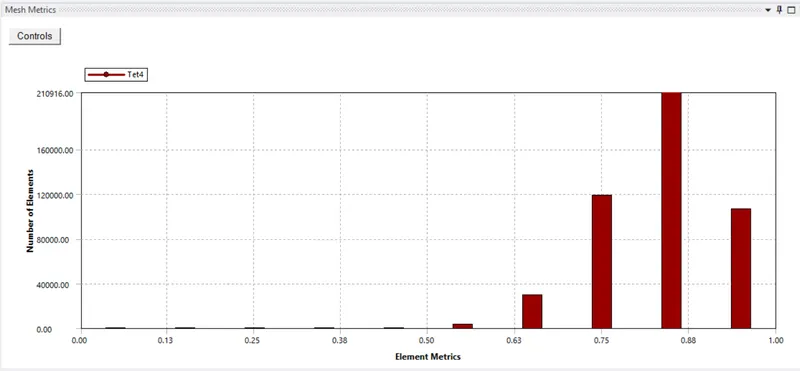
Residuals Graph Monitor Report: Mass flowrate at Outlet 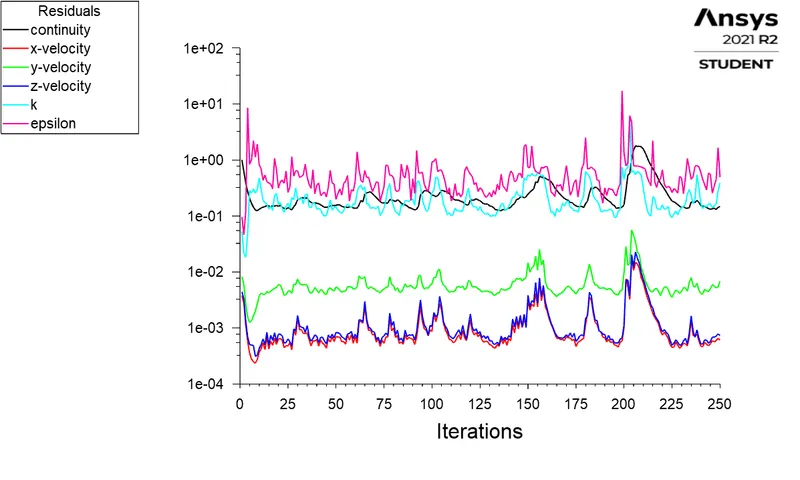
Pressure Contours Velocity Contours 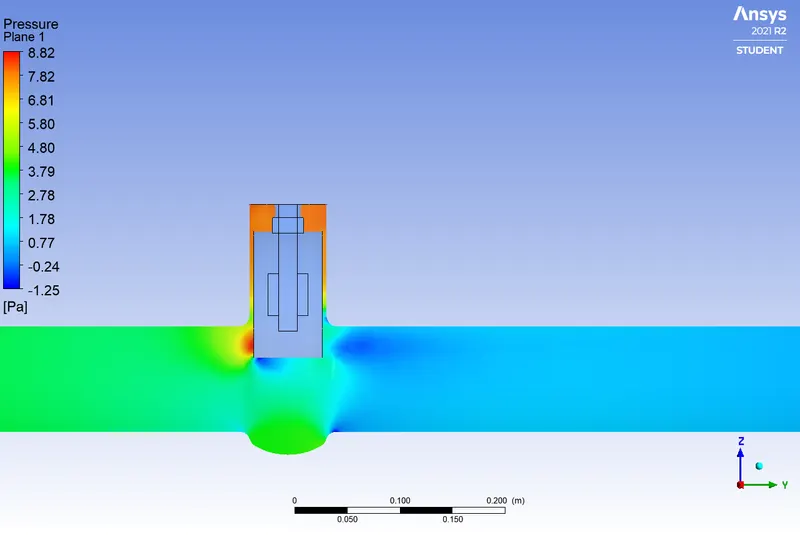
Mass flux balance report Velocity Vector plot 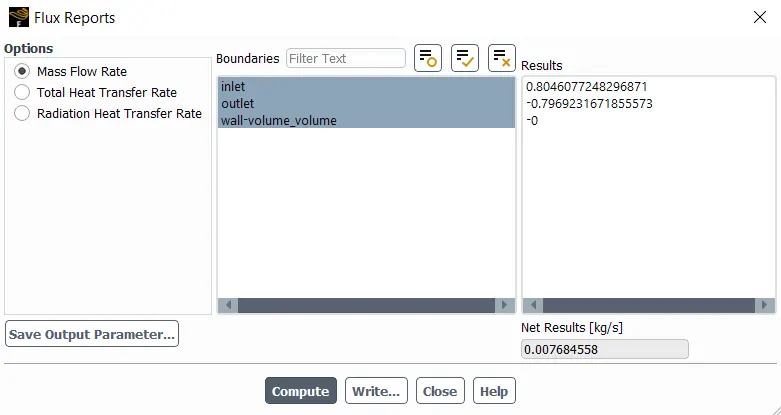
Observation Table:
From the design point table the data has been extracted in the .csv format. Using that data the respective values of flow coefficient (`C_v`) and the flow factor(`K_v`) have been calculated. Same data is tabulated as follows: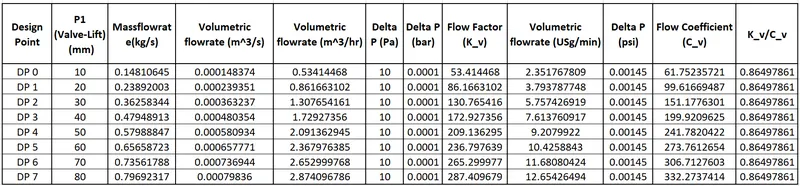
The graph of Mass Flow rate at Outlet (kg/s) Vs Valve lift (mm):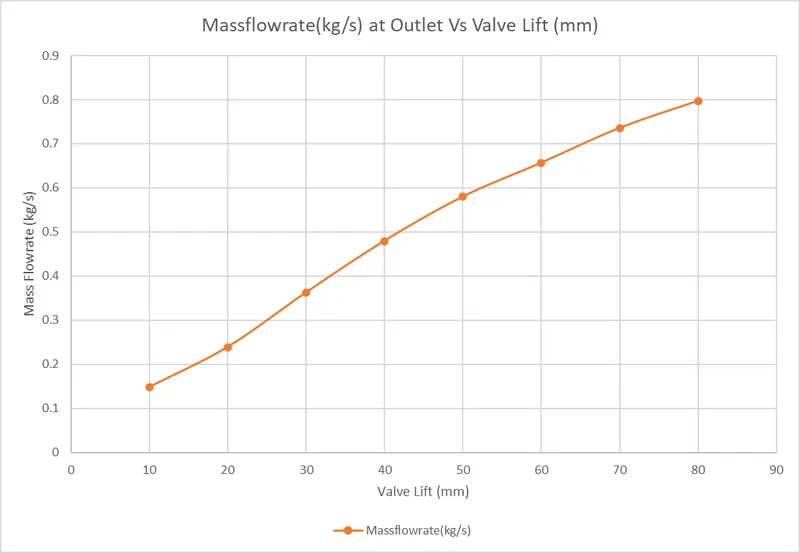
The graph Flow Coefficient (`C_v`) & Flow Factor(`K_v`)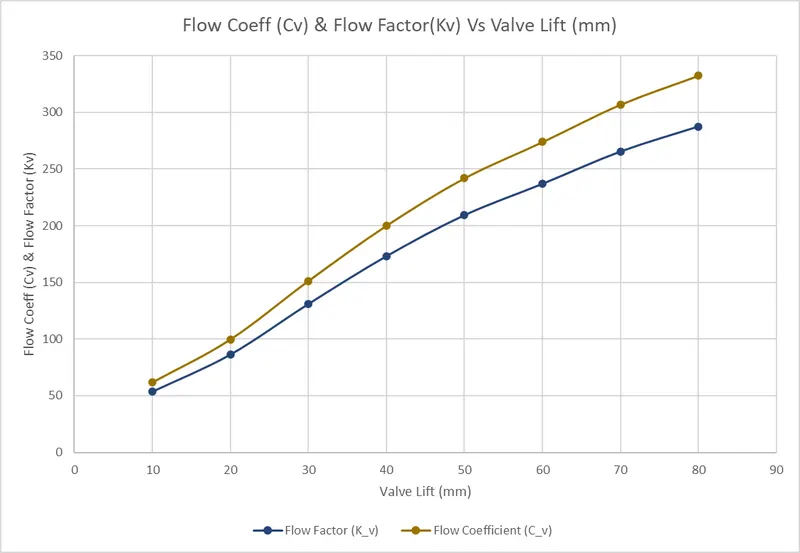
Conclusions:
- From the Pressure contours it can be observed that at lower valve lift the higher resistance has been offered by the valve to the flow thus the pressure on valve upstream is slightly higher.
- From the Observation table and the graph of mass flow rate Vs valve lift, it is clear that the mass flow rate increases linearly as the valve lift increases.
- The value of flow coefficient (`C_v`) and flow factor (`K_v`) have increased linearly as the valve lift increased.
- The values from flux balance reports show that the solution has converged with the acceptable tolerance.
- Thus the parametric study of the gate valve has been done.