Week 9 - Parametric study on Gate valve.
Aim : In this simulation we control the flow through a pipe by a gate valve , and we observe the variation of flow though different opening levels of gate valve disc. The coefficient of flow is calculated and a parametric study is undergone by using the opening level as the input parameter,The simulation was conducted in the Ansys Fluent.
Introduction:
The purpose of gate valve is used to control the flow rate . The simulation work was done in the following steps,
Firstly simulating for the varying opening levels of the gate disc smaller to higher. And calculating the flow rates and comparing the velocity contours for various opening of the gate disc;
Methodology
The gate opening is varied from 10 % to 80 % and the simulations were carried out
Geometry: A step file is uploaded into the SPACE CLAIM and
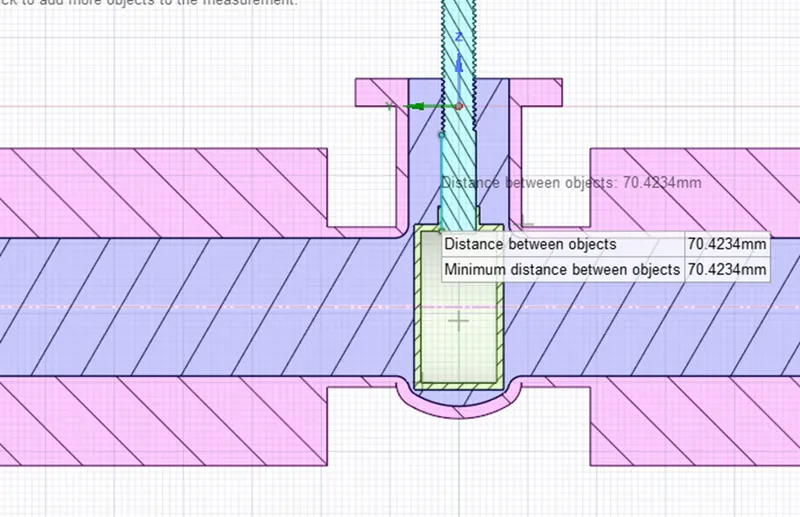
we adjust the gate disc height from the bottom by using the groups parameter option , and the maximum size is limited 70.4234 mm and 80% of the opening is 56.34 mm.
Hence we control our simulation for 6 values in between 10% and 80 % .
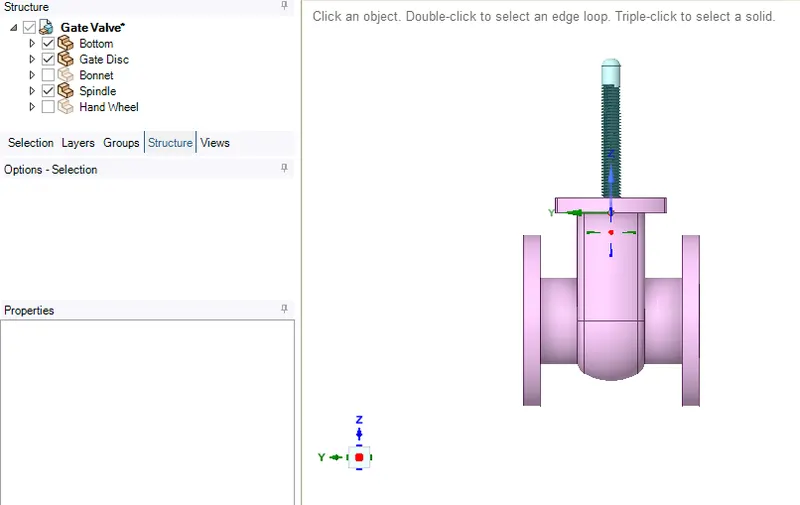
The spindle was included to avoid the fluid volume to be present inside the gate disc, and this acts as a separation.
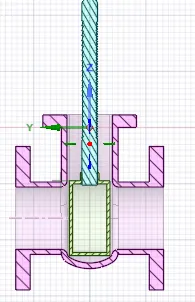
for raising the gate disc move command was used from the design
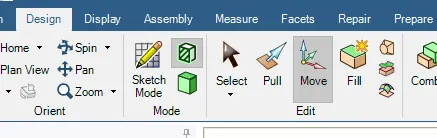
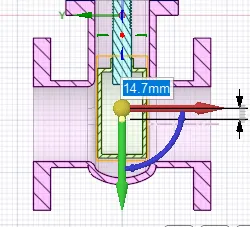
gate disc is selected and desired value is entered,
By selecting the create parameter
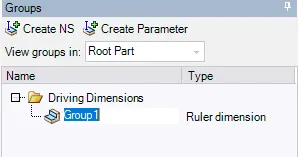
this value is stored in parameter
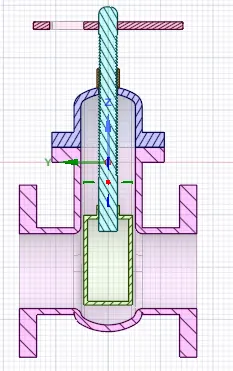
figure shows rise in the gate disc
now for generating the fluid volume ,
The volume was created by using the following components,
1.Bottom
2.Spindle
3.Gate disc
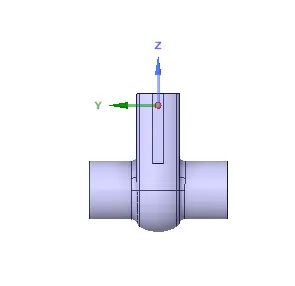
After this we select generate volume in context, so that it can automtically adapt to the changes for various design points
the design points for which we calculate the flow coefficient are .
| Design point | Percentage of opening |
| 8.048 | 11 |
| 16.096 | 23 |
| 24.144 | 34 |
| 32.192 | 46 |
| 40.24 | 57 |
| 56.33 | 80 |
Meshing
We close the spaceClaim and open the meshing window, with default configurations we mesh the fluid domain and keep inlet and outlet named selections accordingly.
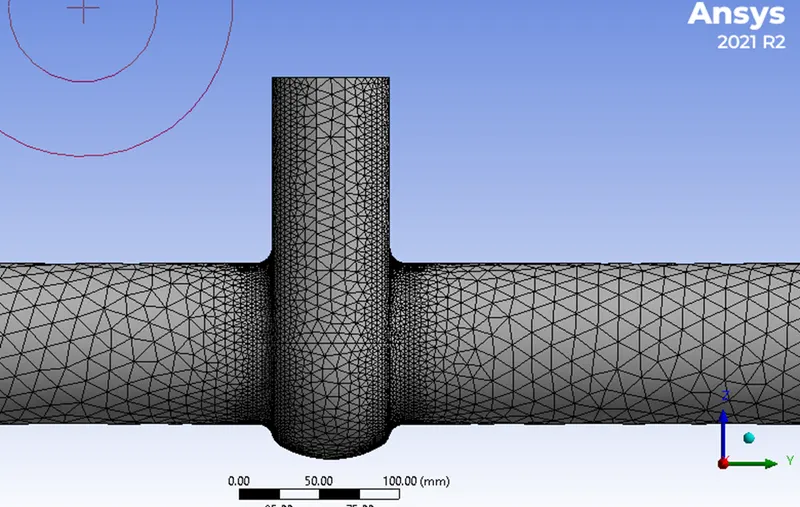
The number of nodes and elements are below

Setup
For the simulation we use a Pressure based, steady state and considering the gravitational forces, A turbulence model of k - epsilon is selected with scalable wall functions.
The inlet of the named selections given by the following boundary conditions
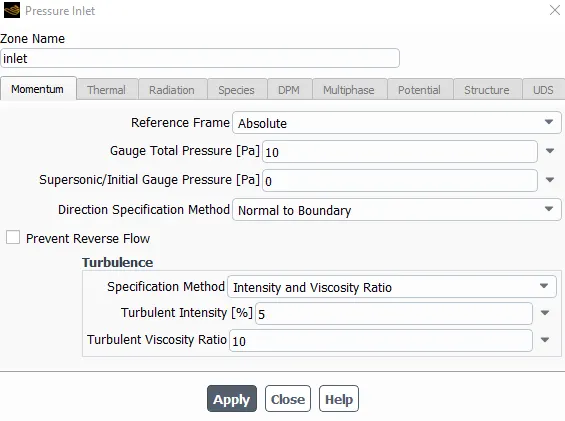
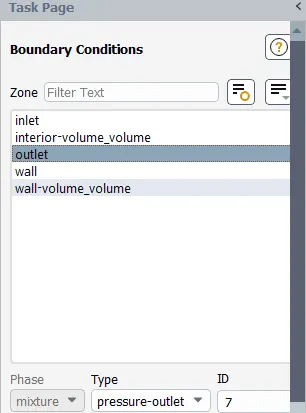
outlet as pressure outlet
and the solutions is initiliazed using standard initilization
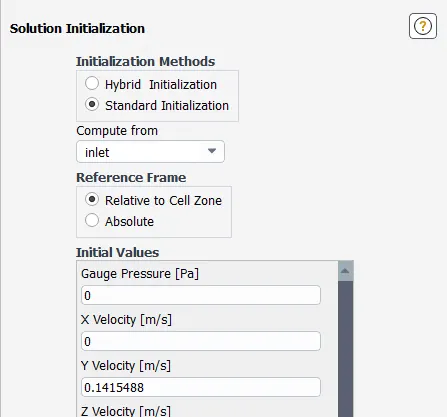
and initialized from inlet
and reports like mass flow rate and static pressure at inlet and outlet were calcultaed as parameter output
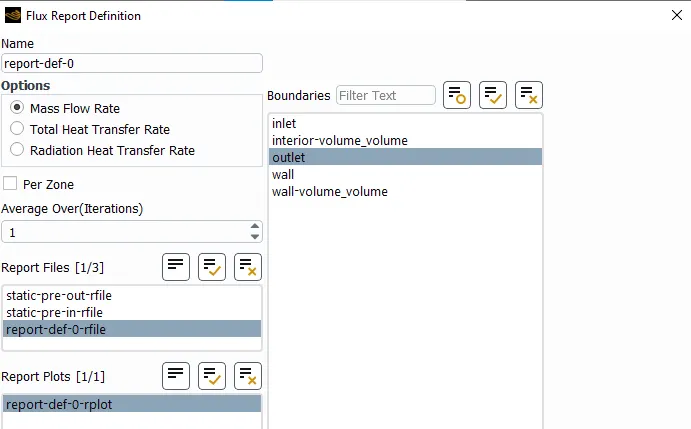
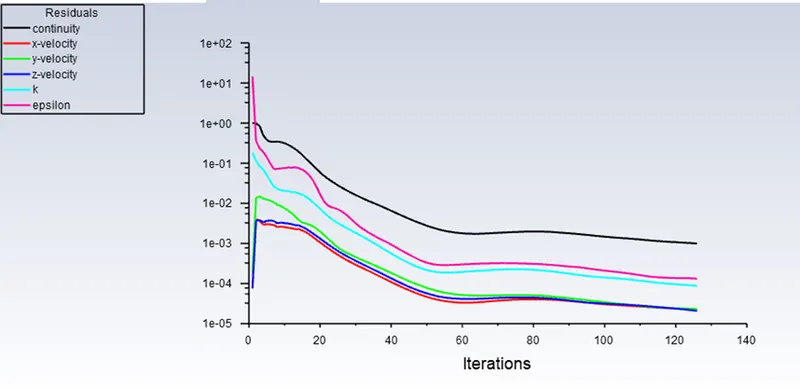
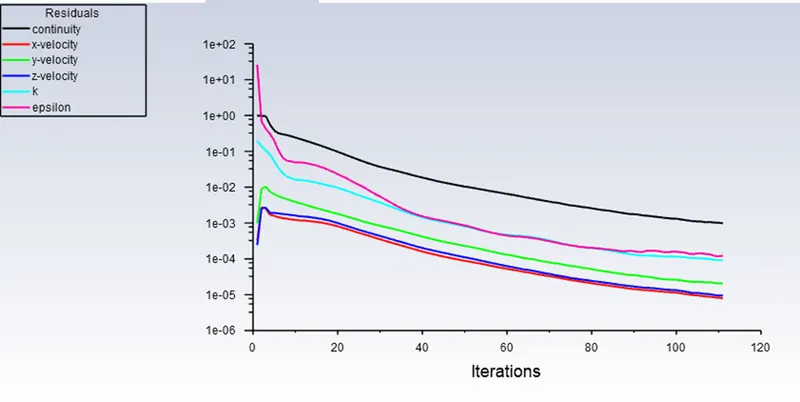
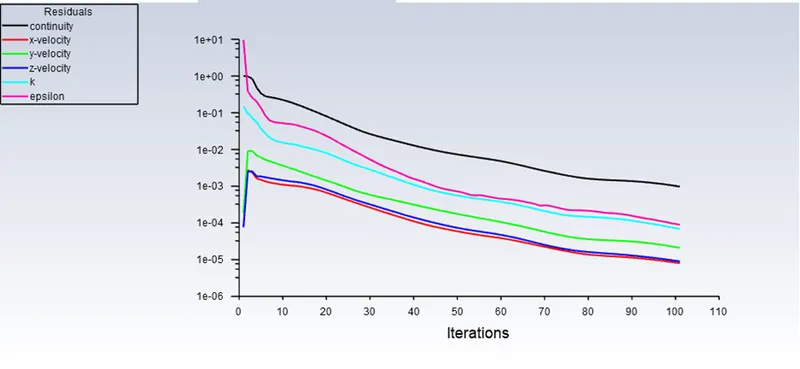
For all the design points a parametric analysis was done and solved for convergence for 0.0001
The following are the residuals for the
for DP 1 for DP 2
for DP 3 for DP 4
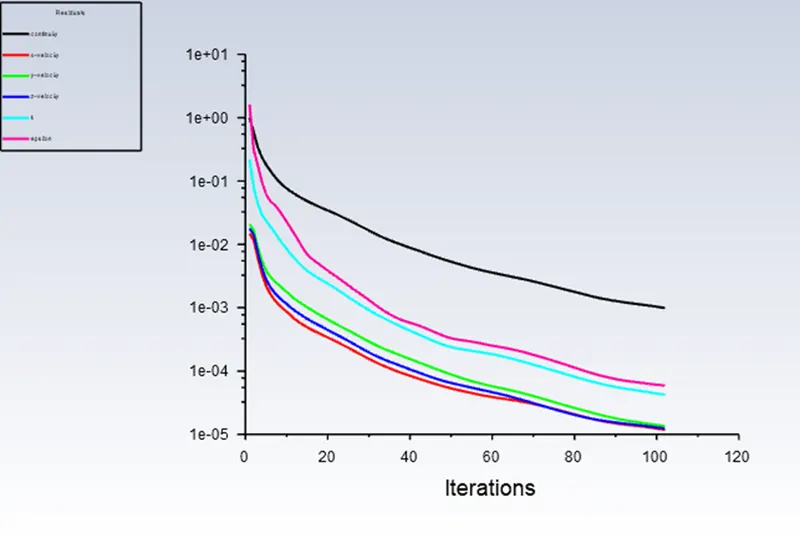
for DP 5 for DP 6
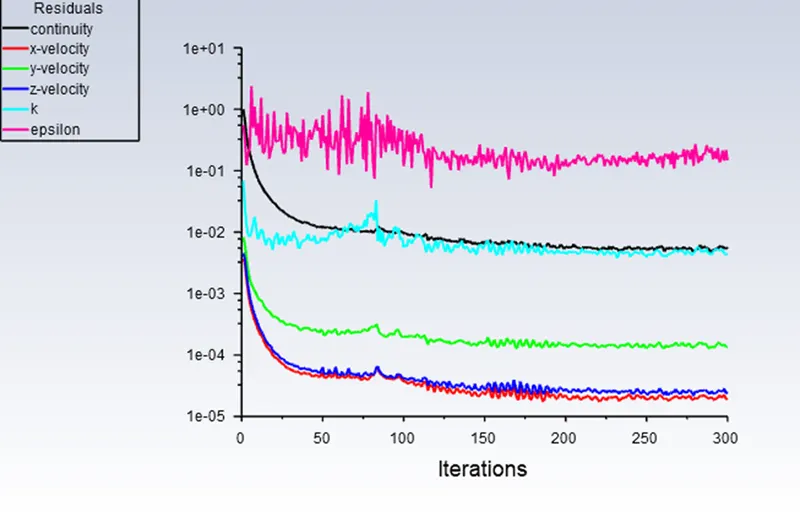
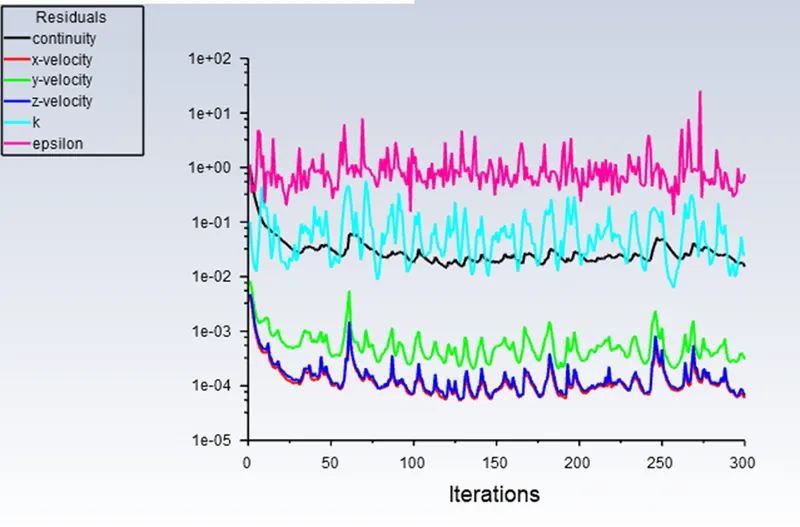
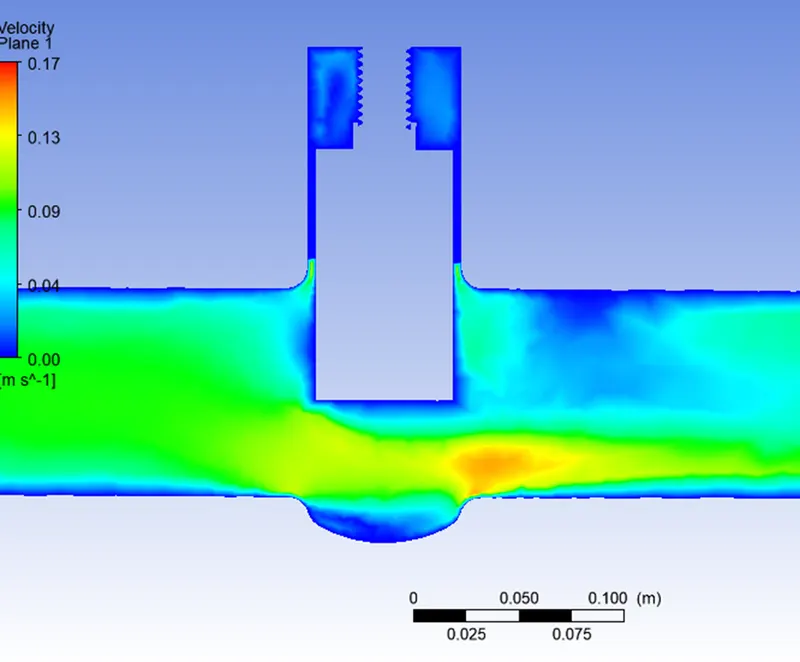
The contours of the velocity
for DP 1
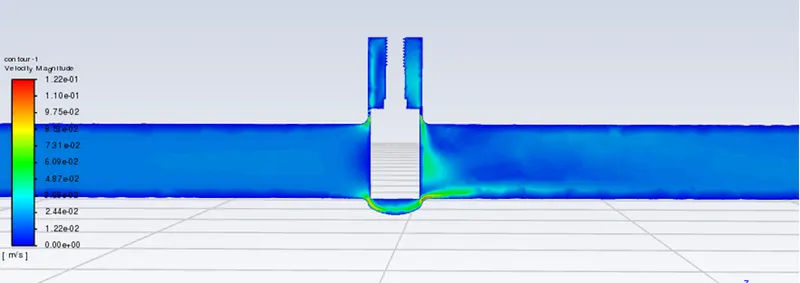
for DP 2
for DP 3
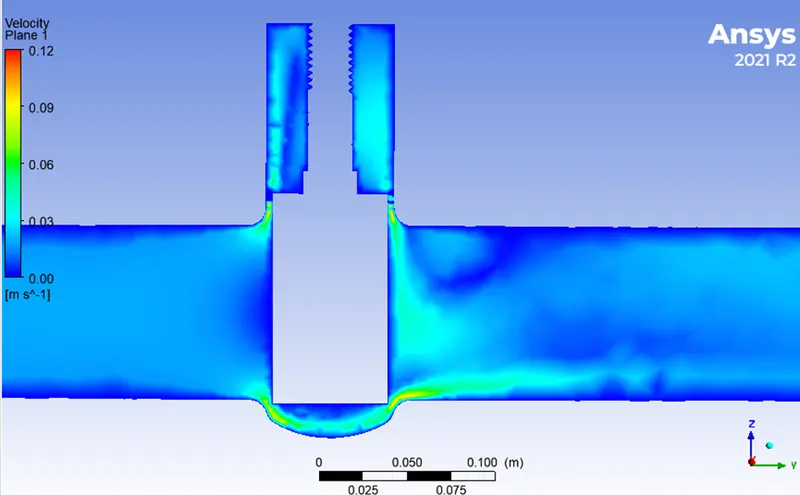
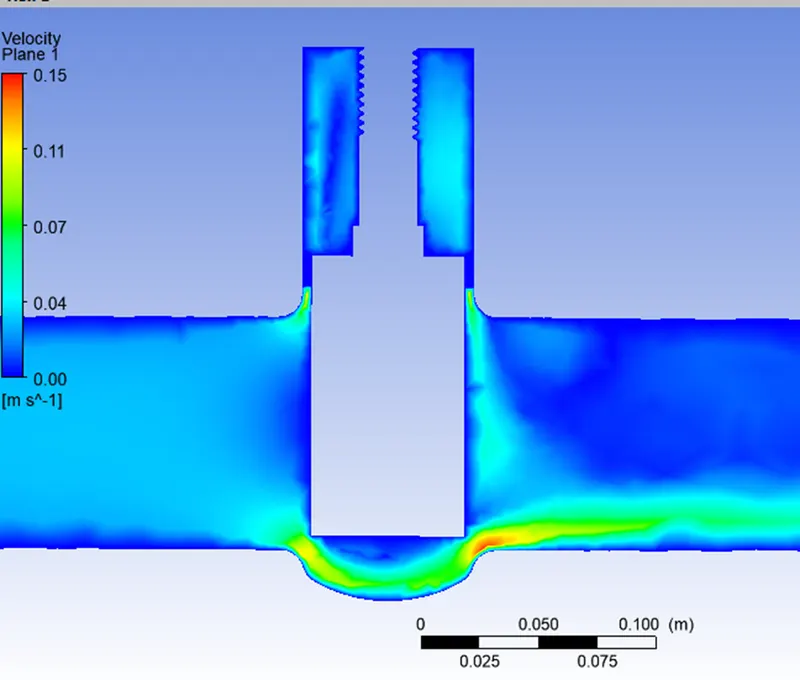
DP 4 DP 5
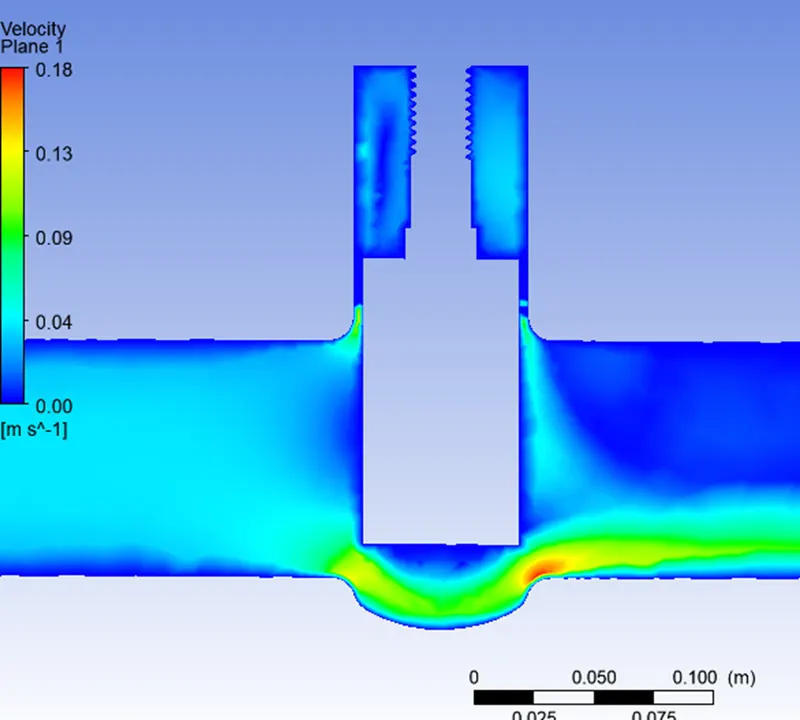
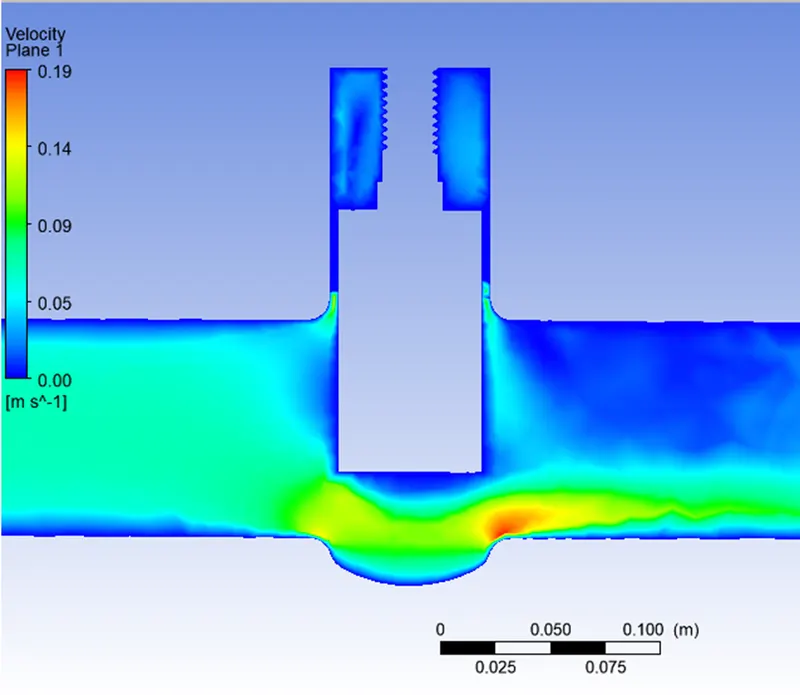
for DP 6
FlowCoefficient(Kv)
The flow coefficient is critical for choosing the appropriate valve for a given application. If the valve will be open for the most of the time, a valve with minimal head loss should be chosen to save energy. If a control valve is required, the range of coefficients for the various opening positions of the valve should meet the application's requirements.
The flow coefficient of each valve is different. This is dependent on how the valve has been built to allow flow through it. As a result, the main variances between different flow coefficients are caused by the type of valve and, of course, the valve's opening position.
`K_V =Qsqrt((SG)/(DeltaP))`
where
Q is discharge -m3/hr
SG is specific gravity
`DeltaP`= Static pressure drop in Pa
and
`Cv = 1.56 *K_V`
`C_V` is the flow factor in gallon per minute(gpm)
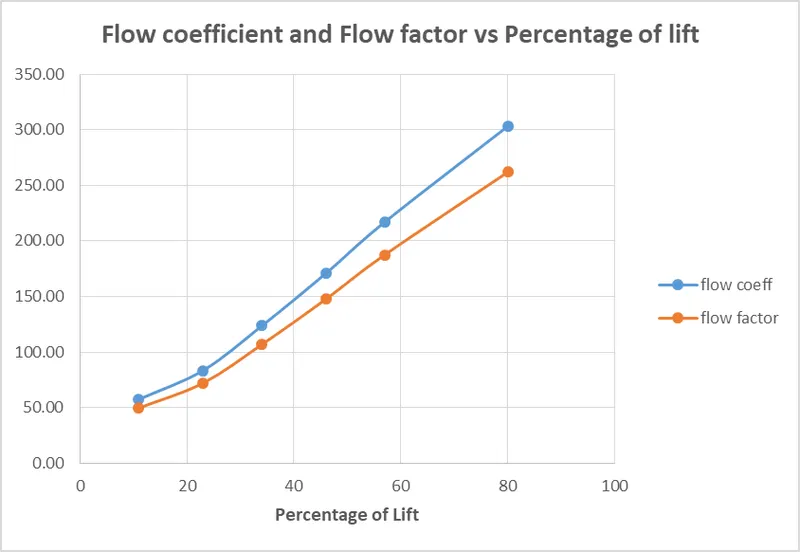
the same variation for each opening is calculated and plotted in the graph below
Table showing the Design point of lift of the gate and percentage of lift , Static pressure in pascals(pa) and per square inch(psi)
| Design point | Percentage of opening | Static Pressure drop in bars | Static Pressure drop in psi | discharge GPM | discharge m3/hr | Flow coefficient Cv | Flow factor Kv |
| 8.048 | 11 | 9.84E-05 | 1.43E-03 | 2.168 | 0.492 | 57.37 | 49.57 |
| 16.096 | 23 | 9.68E-05 | 1.40E-03 | 3.121 | 0.709 | 83.31 | 71.98 |
| 24.144 | 34 | 9.31E-05 | 1.35E-03 | 4.540 | 1.031 | 123.53 | 106.73 |
| 32.192 | 46 | 8.77E-05 | 1.27E-03 | 6.092 | 1.384 | 170.85 | 147.61 |
| 40.24 | 57 | 8.15E-05 | 1.18E-03 | 7.461 | 1.695 | 217.01 | 187.50 |
| 56.33 | 80 | 6.93E-05 | 1.01E-03 | 9.611 | 2.183 | 303.11 | 261.89 |
mass flow rates
The mass flow rates in kg/s and conversion in m3/hr and gpm is shown in the table below
| Design point | mass flow rate | m3/hr | gpm |
| 8.048 | 0.13677 | 0.492372 | 2.167864679 |
| 16.096 | 0.1969 | 0.70884 | 3.120951636 |
| 24.144 | 0.28644 | 1.031184 | 4.540200034 |
| 32.192 | 0.38436 | 1.383696 | 6.092275118 |
| 40.24 | 0.47073 | 1.694628 | 7.461277621 |
| 56.33 | 0.60633 | 2.182788 | 9.610597285 |
Conclusions:
- It observed that the massflow rates have increased with opening.
- The pressure drop is higher when the lift is at 80 %
- Also the flow coefficient is higher at the 80 % of the gate opening
- The flowcoefficient and flow factor shows the same profile , but vary with the corversion factor
- Over all the Kv and Cv explains the same data but they are used according to the standards of the company
- We can say that the flow factor and flow coefficient helps the user to choose the valve according to the application.