Week 9 - Mini project - Flow over an Airfoil
- Flow over an Airfoil.
- Objective - To Simulate flow over a 4 digit airfoil i.e NACA 2412 Airfoil.
- To plot Drag co-efficient Vs Angle of Attack
- To Plot Lift co-efficient vs Angle of Attack
- To keep the inlet Reynolds number is 200,000 .
-
NACA 4 digit airfoil specification
This NACA airfoil series is controlled by 4 digits e.g. NACA 2412, which designate the camber, position of the maximum camber and thickness. If an airfoil number is
NACA MPXXthen:
e.g.
NACA 2412- M is the maximum camber divided by 100. In the example M=2 so the camber is 0.02 or 2% of the chord
- P is the position of the maximum camber divided by 10. In the example P=4 so the maximum camber is at 0.4 or 40% of the chord.
- XX is the thickness divided by 100. In the example XX=12 so the thiickness is 0.12 or 12% of the chord.
- Introduction
- An airfoil is the cross section of aircraft wing.
-
An airfoil's purpose is to reduce drag and generate lift.
- Two types of airfoil.i.e, symmetrical and non symmetrical.
- Symmetrical aerofoil has equal higher and decrease surfaces such that the chord line and camber line manifest to be the identical.
- Non-symmetrical aerofoil, additionally known as cambered aerofoil, has special higher and lower surfaces such that the chord line occurs to be placed above with huge curvature.
- The leading edge is the point on the wing that exhibits the maximum curvature (minimum radius).
- The trailing edge is similarly defined as the point of maximum curvature at the rear of the wing.
- A chord line is a straight line connecting the leading and trailing edges.
- The average bulge line is the locus of points halfway between the top and bottom surfaces. Its shape depends on the thickness distribution along the chord.
- The aerodynamic center is the chordwise length over which the pitching moment is independent of the lift coefficient and the angle of attack is zero.
- The center of pressure is the chord wise location about which the pitching moment is zero.
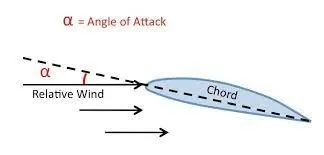
- Angle of attack - The angle of attack is the angle between the chord line and average relative wind.
- Greater angle of attack creates more lift (up to a point).
- Procedure
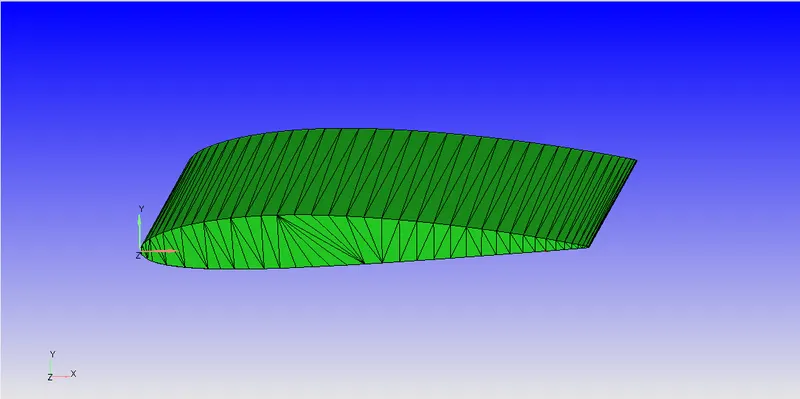
- Geometry preparation
- Applying Boundries
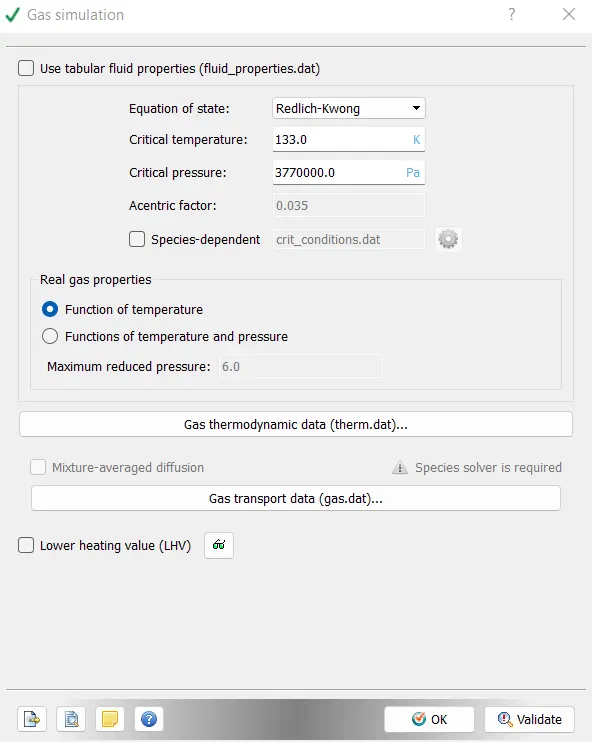
- Setup
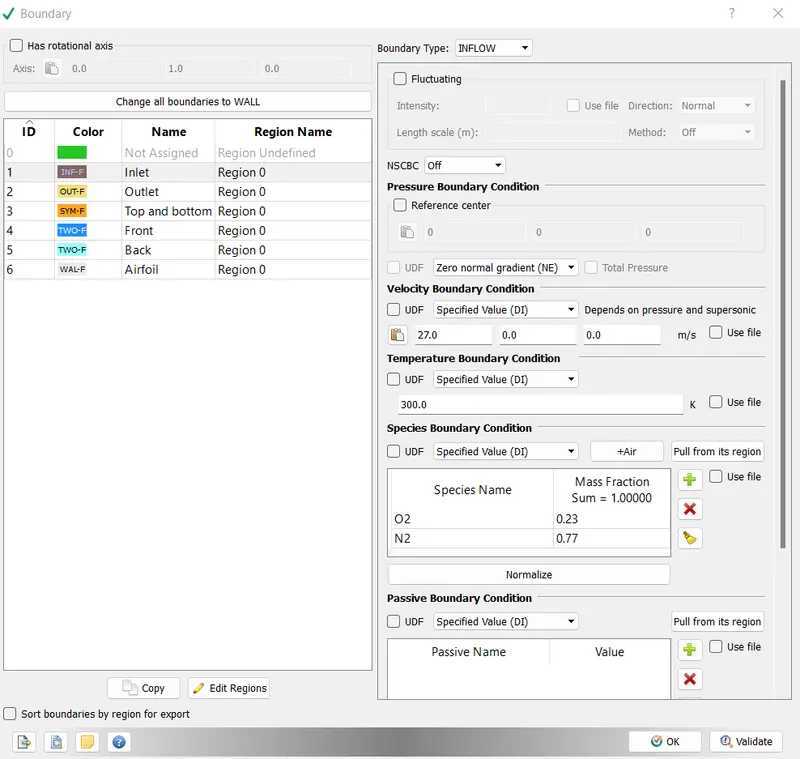
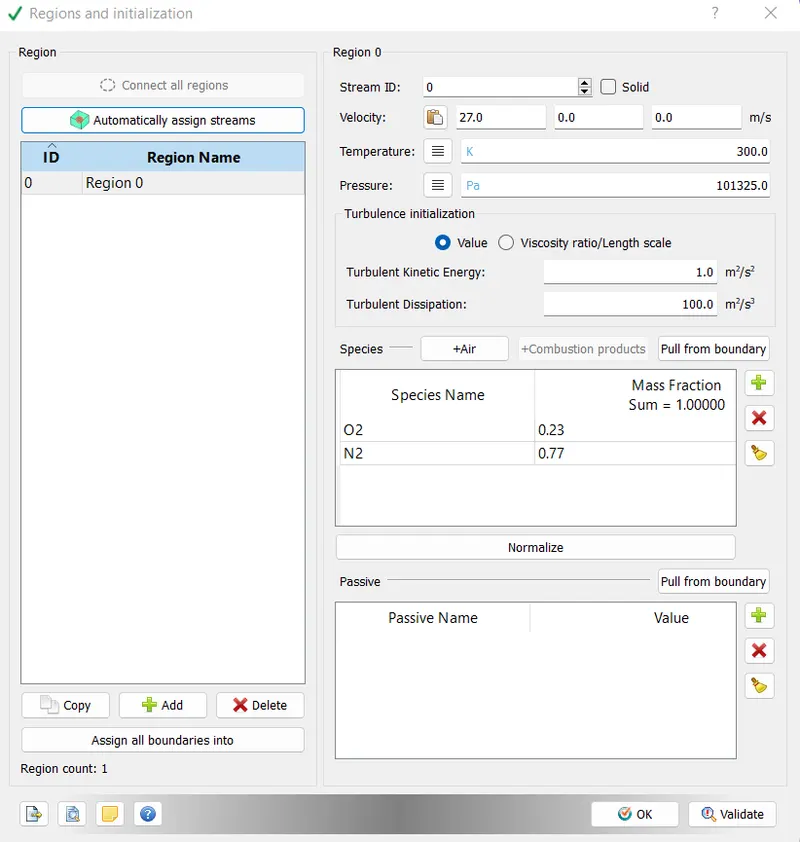
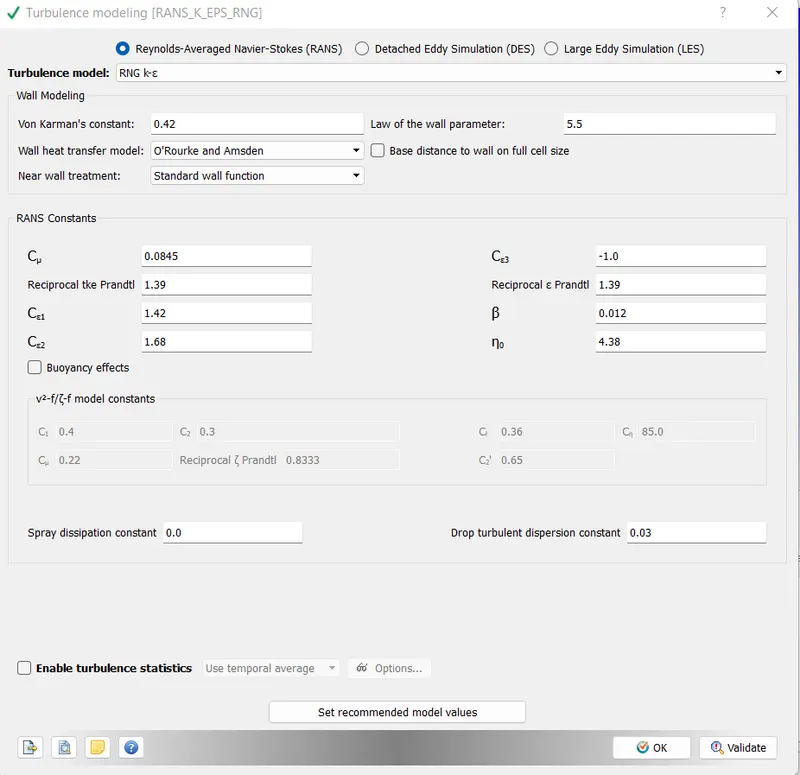
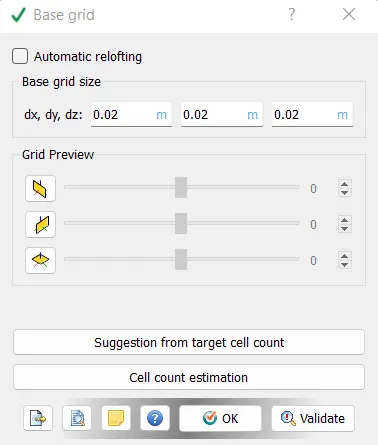
- Stepwise Explaination
-
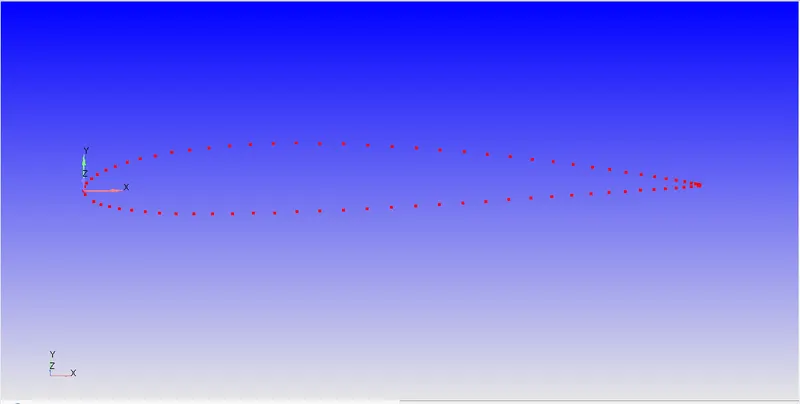
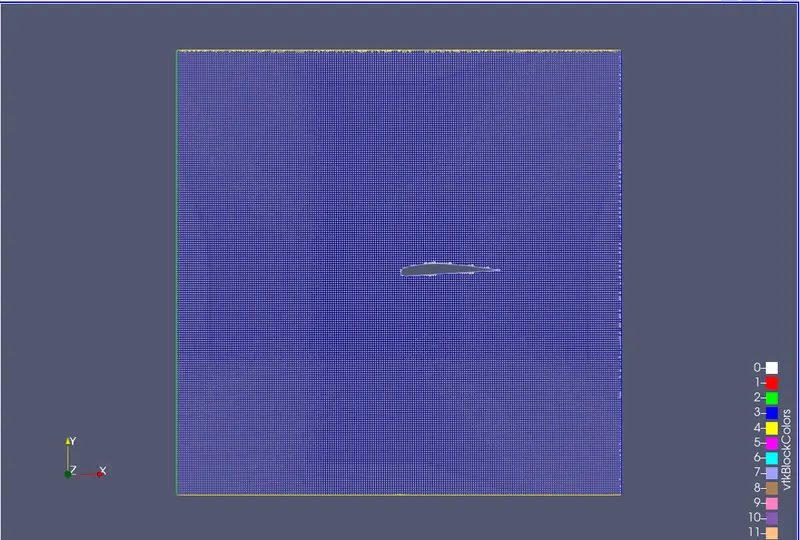
The coordinates from the NACA airfoil internet site are taken, and enter into an excel sheet. those coordinates are then entered into Solidworks the usage of the "Curve through the XYZ" characteristic and the geometry is created.
-
The chord length for every case turned into taken as 50 mm.A digital wind tunnel turned into setup with the following dimensions
-
Horizontal length of wind tunnel = 50 x chord period = 2.5m
-
Vertical duration of wind tunnel = 30 x chord duration = 1.5 m
-
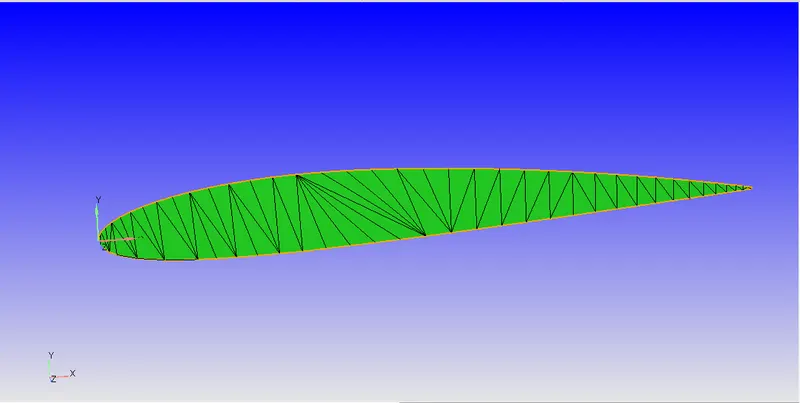
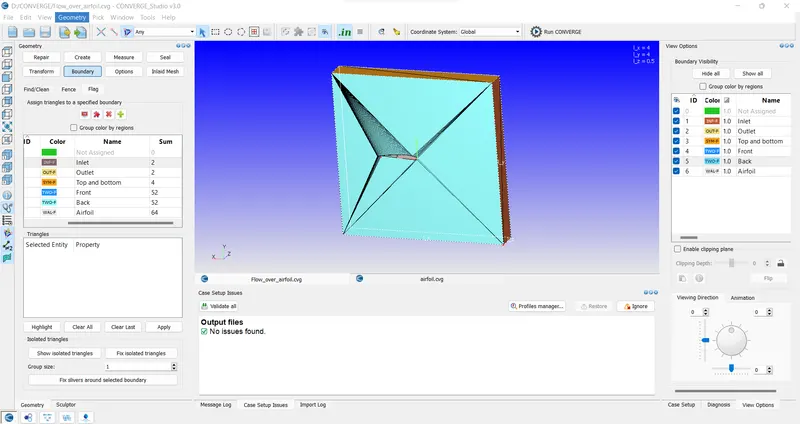
The normals had been converted to point them in the direction of the fluid region
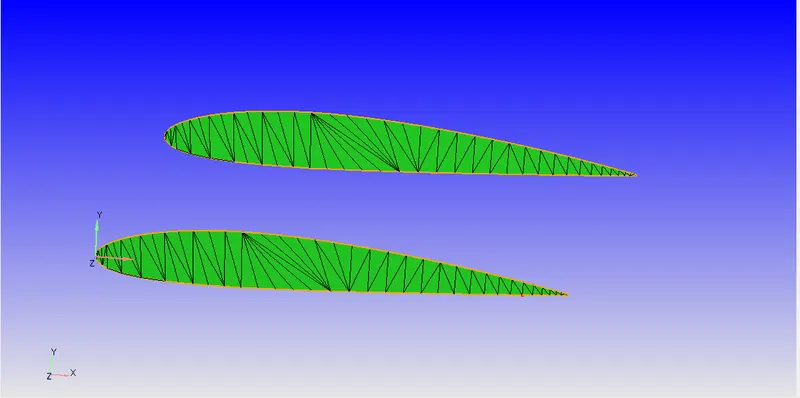
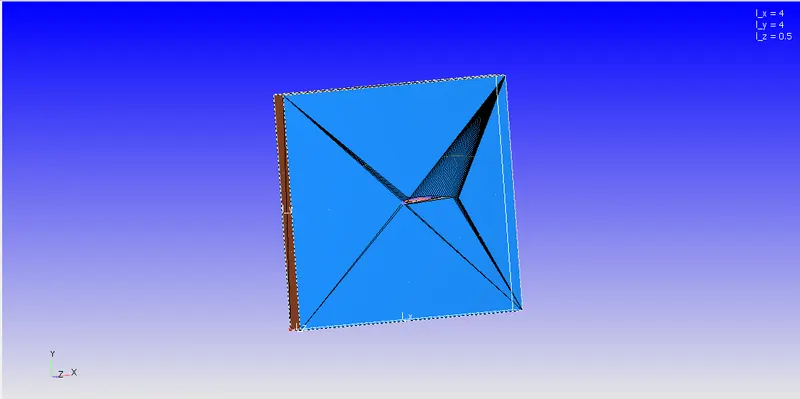
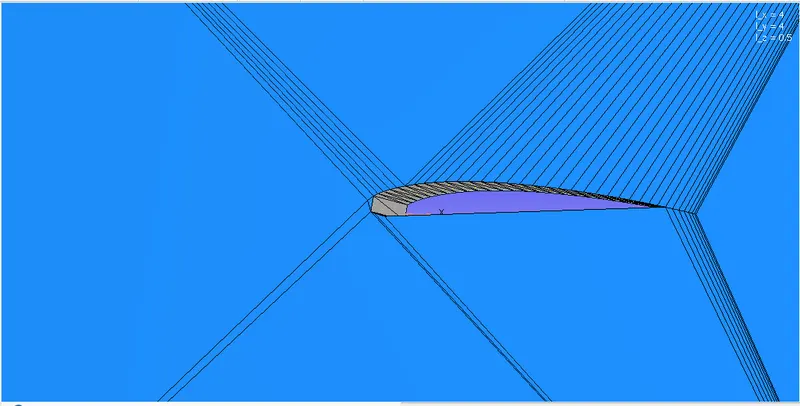
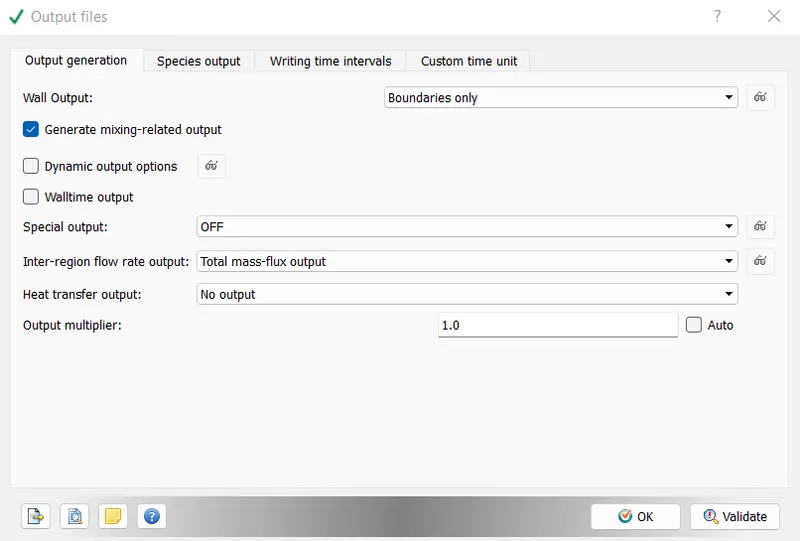
Boundary creation -a total of 6 one-of-a-kind obstacles had been created for multiple split triangles of the geometry with every face cut up into multiple triangles.Case setup -
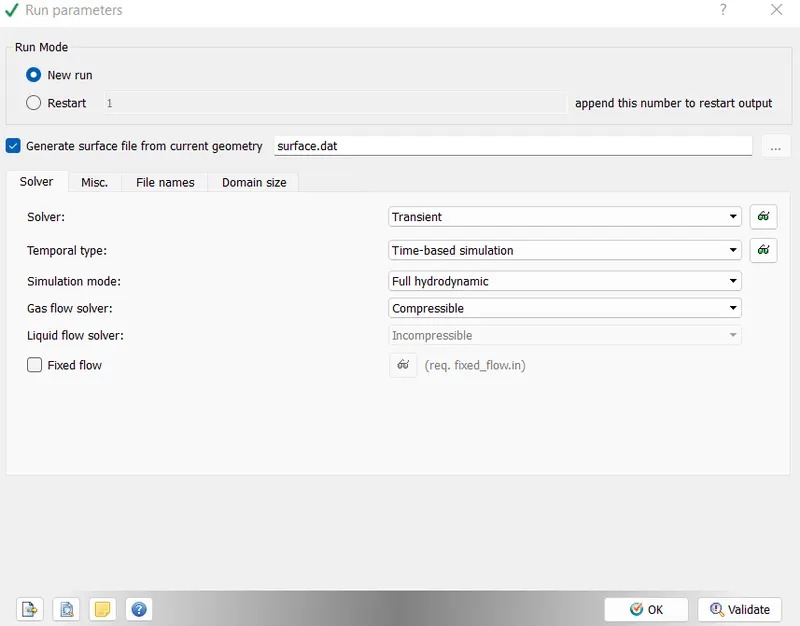
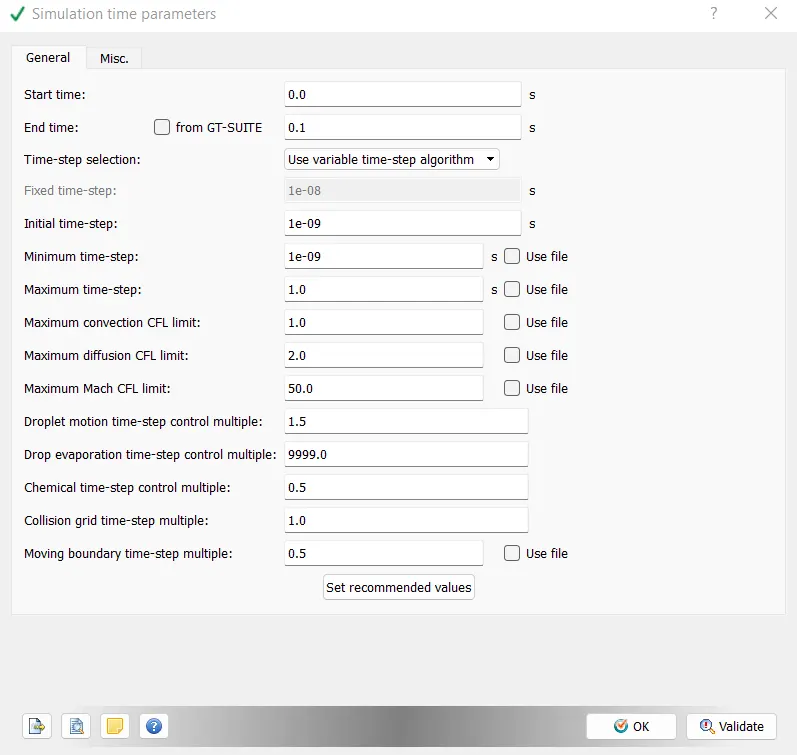
A time based totally simulation is chosen, with Air because the predefined combination. Default values are chosen for the worldwide transport parameters and the species. response mechanism (mech.dat) become selected for this example look at.
-
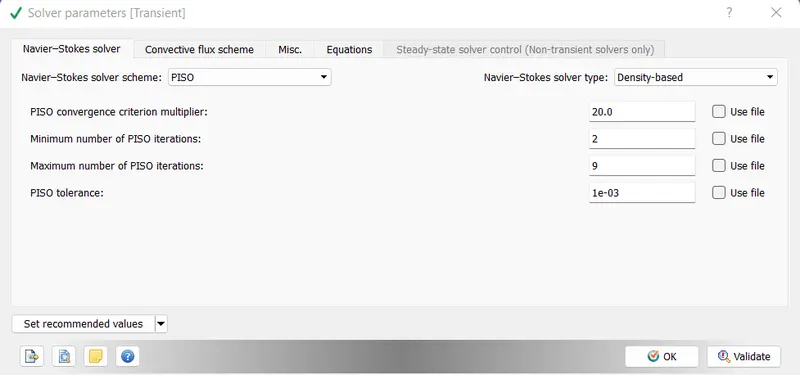
A transient solver turned into decided on for walking this case have a look at along with a Density based totally solver.
- Calculations
- Reynolds number is 200,000
- Density = 1.225 kg/m ^3
- Dynamic viscosity = 1.52 *10^-5 Ns/m^2

Wing area = b *c = 0.89 *0.5 = 0.445

Velocity = 27 m/s
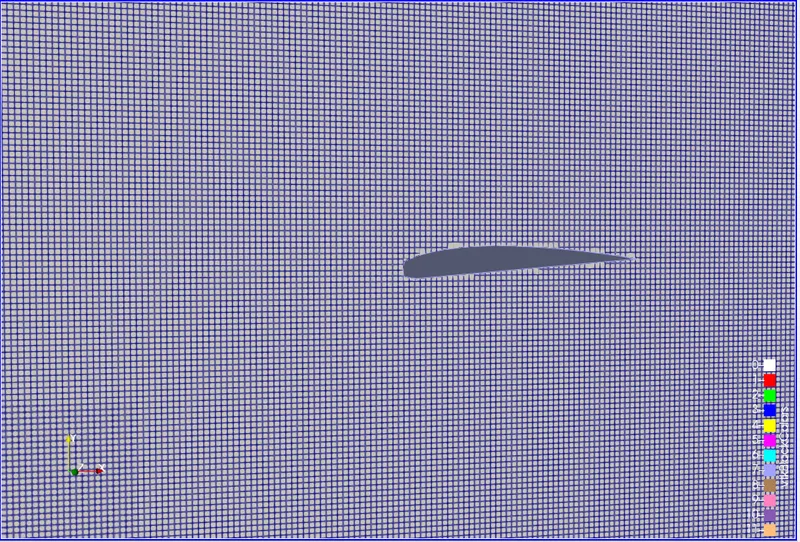
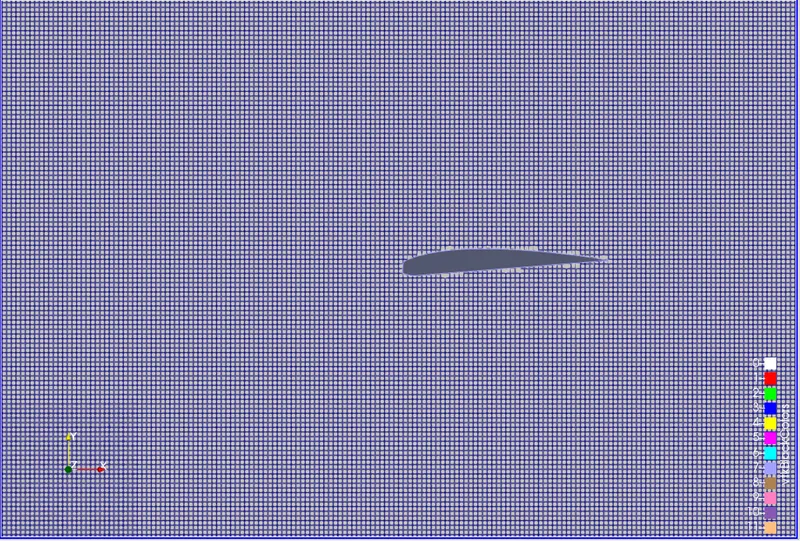
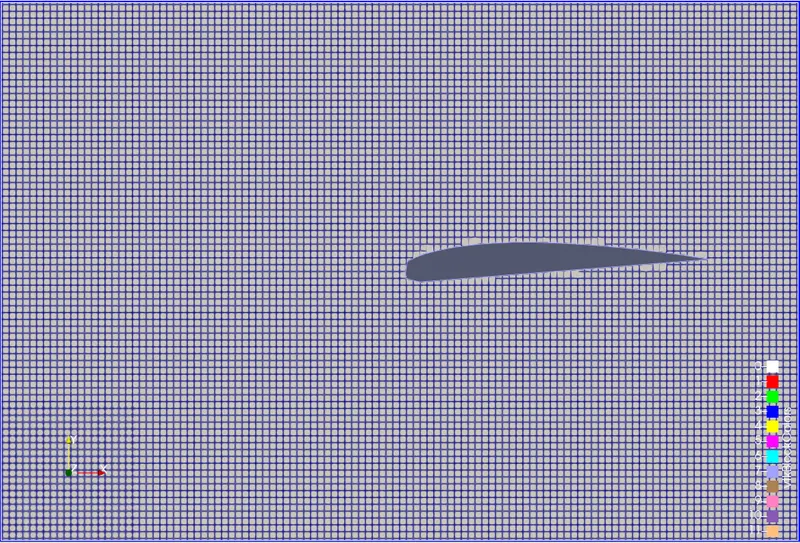
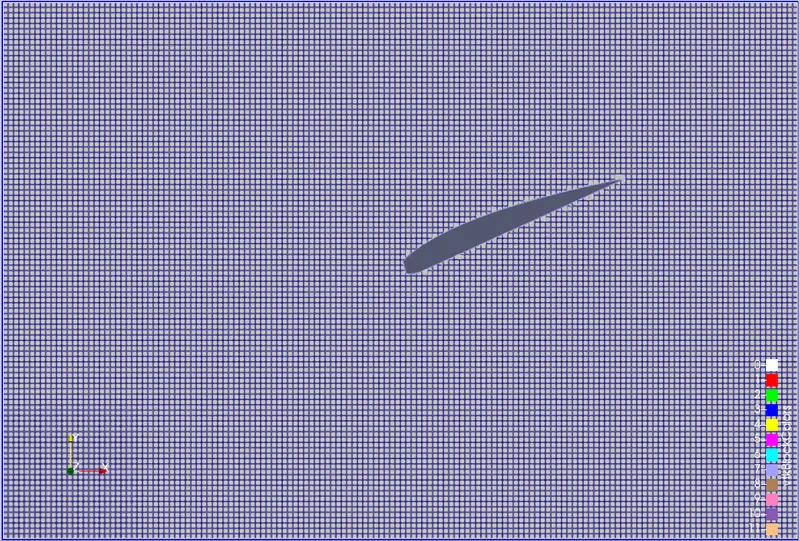
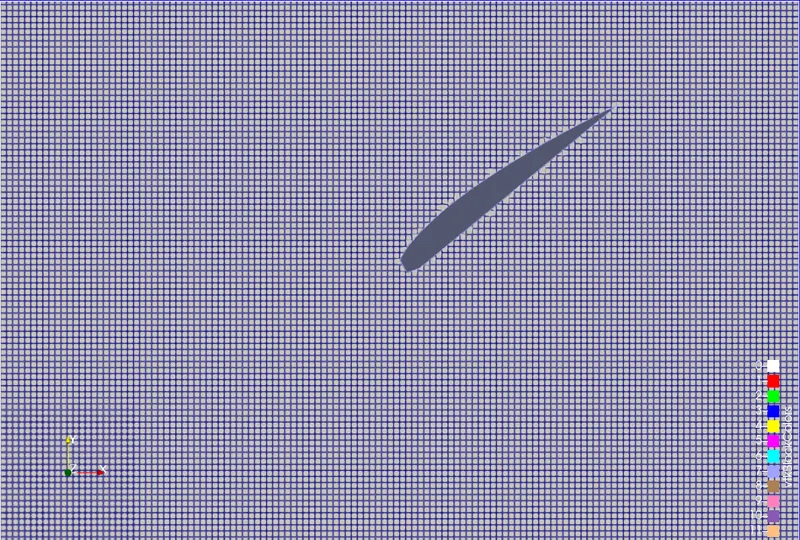
- Mesh Generation
- Velocity contour
- Velocity contour
- Angle of attack = 1º
- 1. K-omega-SST model
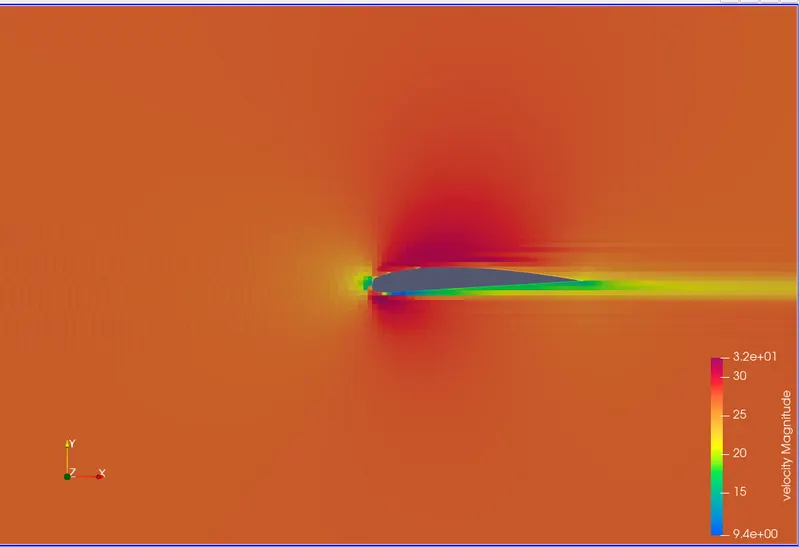
- Velocity contour
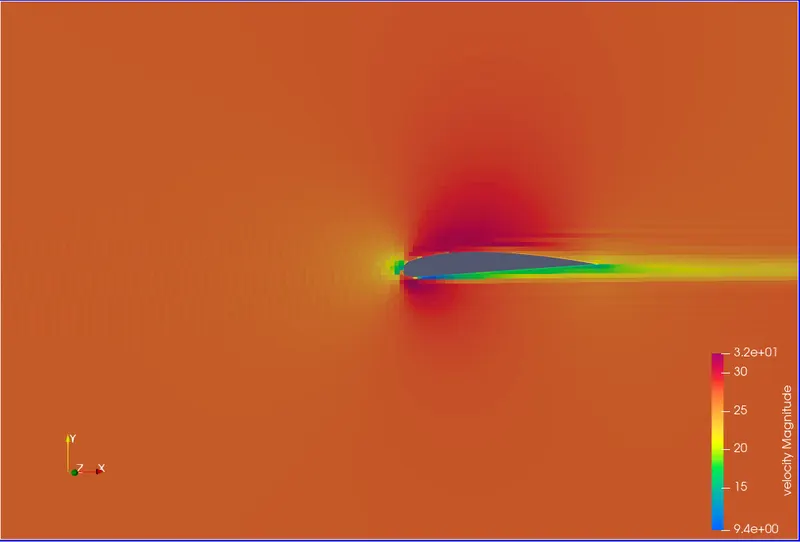
- The velocity contours show the presence of a stagnation point at the leading edge at the lowest velocity and an increase in the stagnation point above the wing upper convexity at low pressures. As the flow progresses along the top surface, it separates at some point and then slows down.
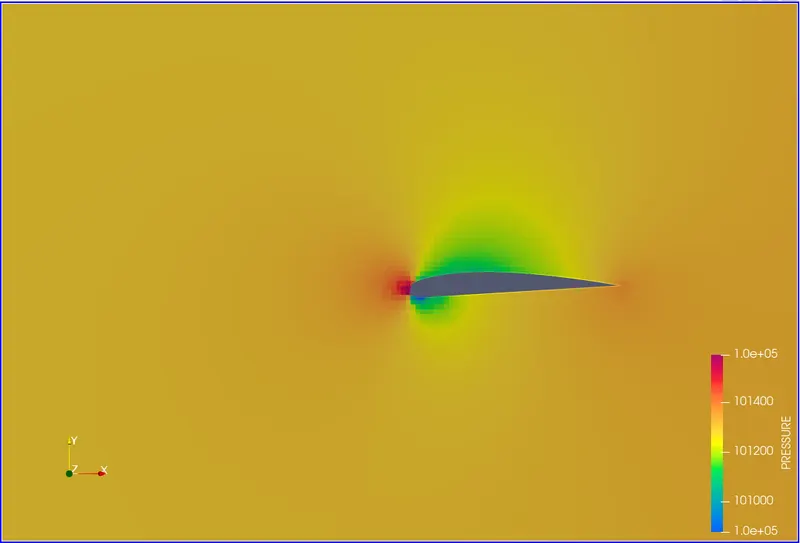
- Pressure contour
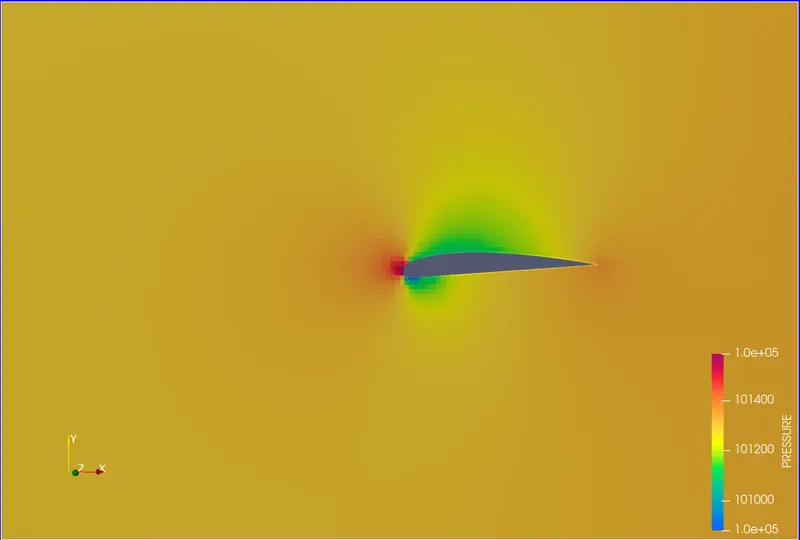
- The pressure contour shows that there is low pressure on the top surface of the wing and high pressure at the leading edge. The net effect is the force pushing the wing up, resulting in lift.
2. K-epsilon model
- Velocity contour
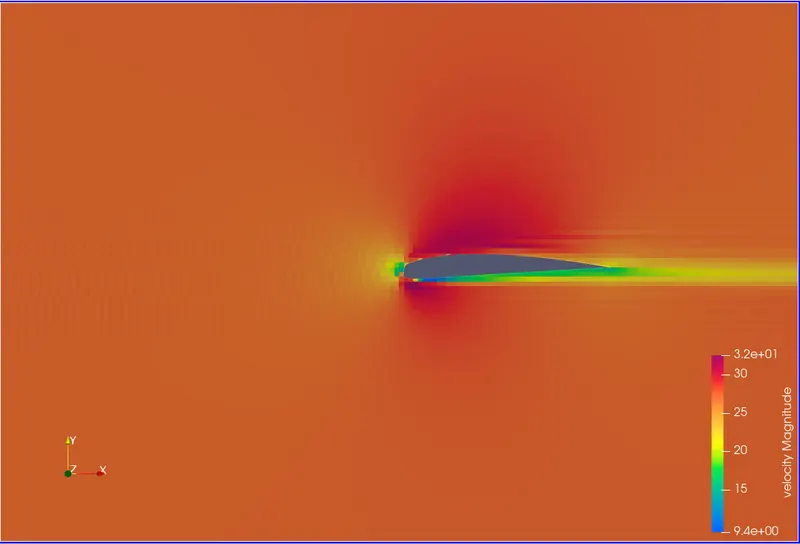
- The velocity contour shows the presence of a stagnation point at the leading edge, when the velocity is lowest, and over the upper convex section of the wing, it increases, as the pressure is low. As the flow proceeds along the upper surface, it separates at a point, after which the velocity reduces.
- Pressure contour
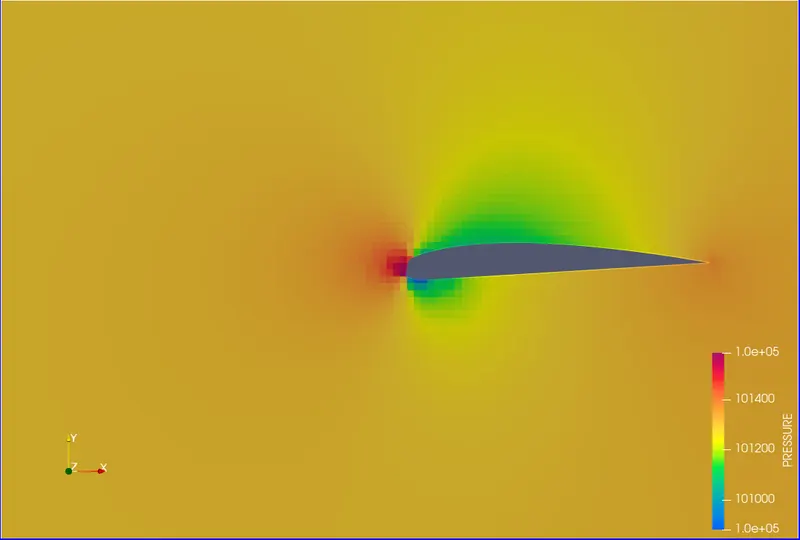
- The pressure contour shows that there is low pressure on the top surface of the wing and high pressure at the leading edge. The net effect is the force pushing the wing up, resulting in lift.
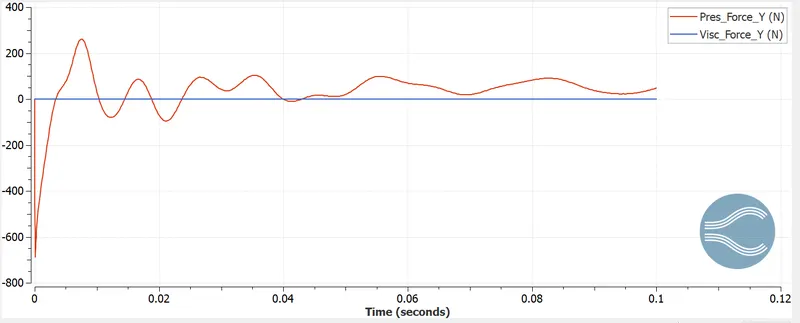
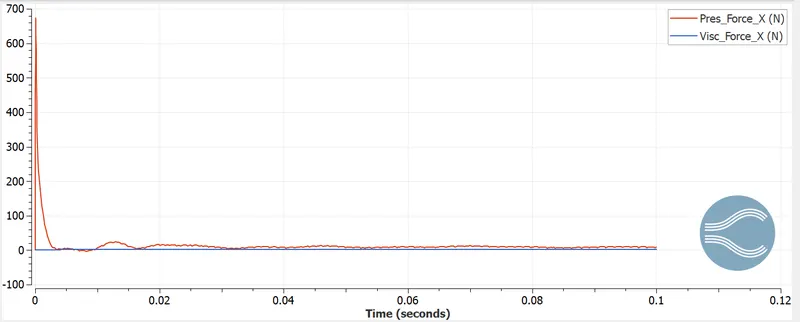
- Angle of attack = 5º
- Velocity contour
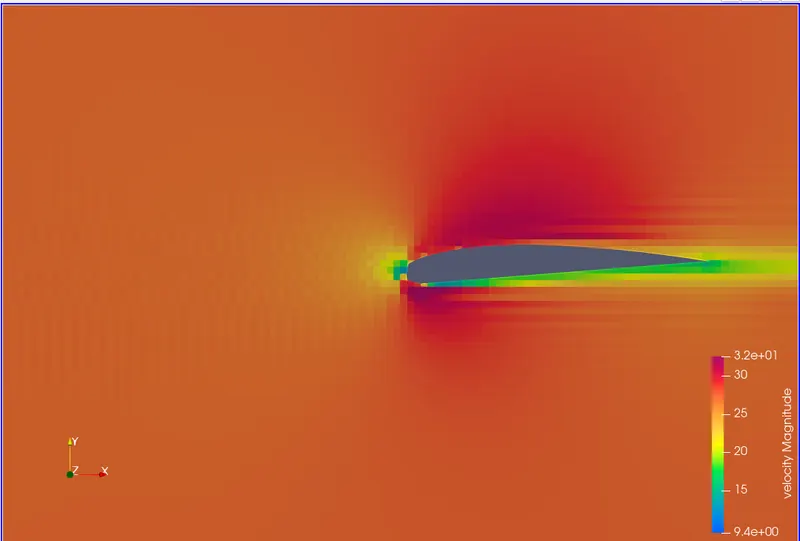
- It can be seen that the velocity magnitude is increased compared to the 1 degree AOA. However, the flow separation point moved forward significantly. This means that the flow over the wing becomes turbulent more rapidly on the upper side.
- Pressure contour
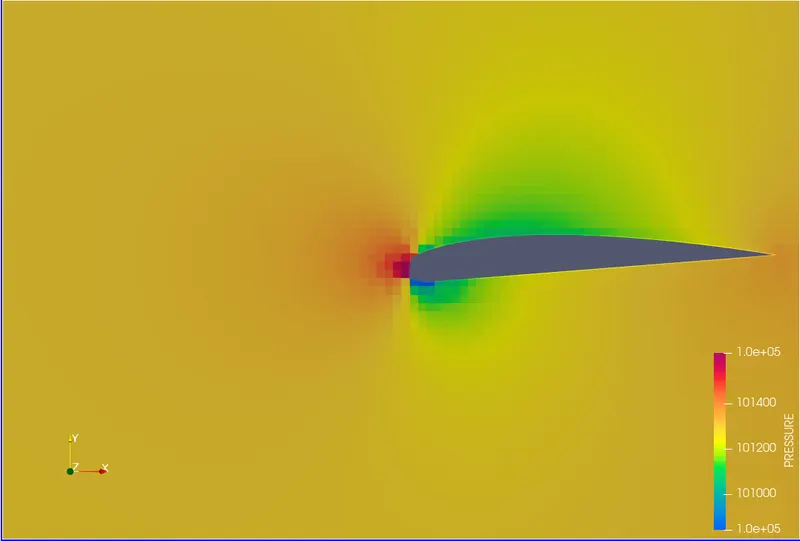
- The region of low pressure on the top surface of the wing has reduced to a small region near the leading edge. The pressure on the underside of the wing is higher, resulting in a net lift.
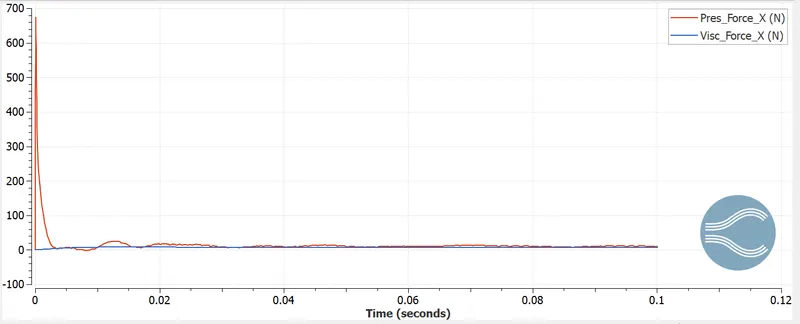
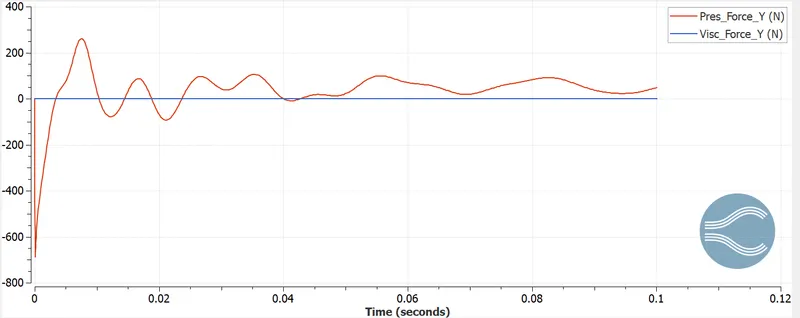
- Angle of attack = 10º
- Velocity contour
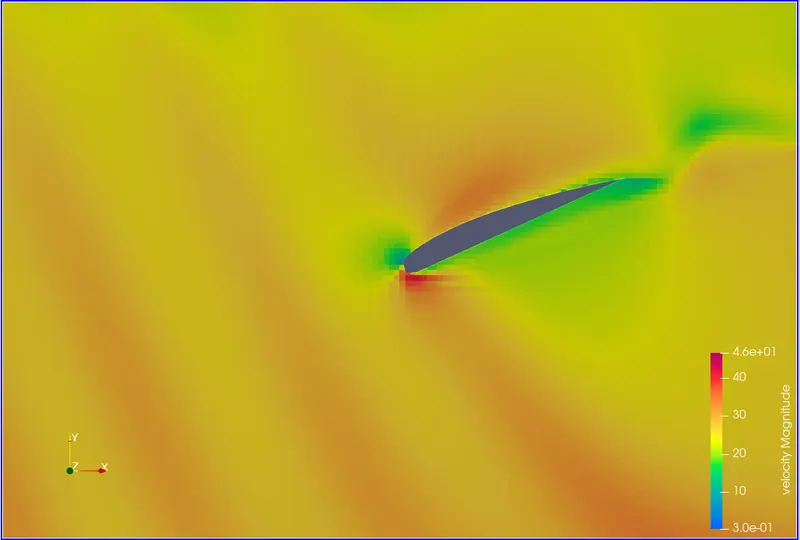
- The flow starts separating virtually at the leading edge itself, and the stream on the upper surface has become very turbulent.
- Pressure contour
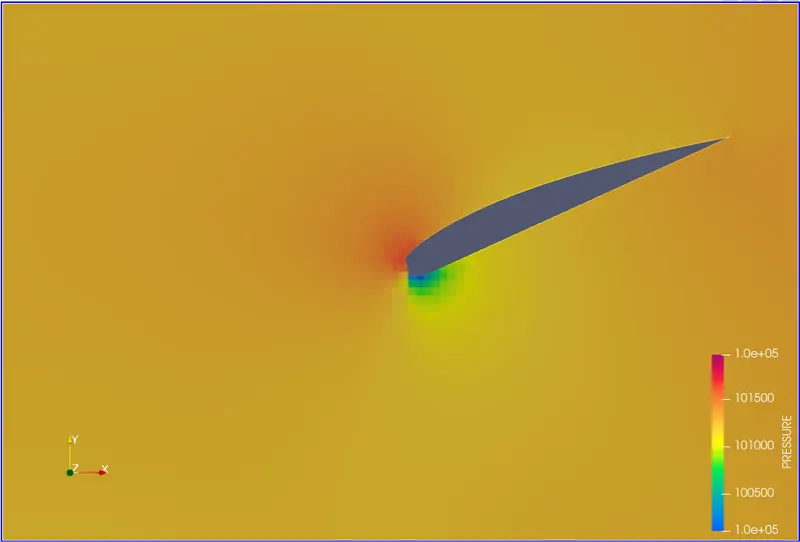
- The pressure is very low due to the presence of a recirculation area at the top of the wing near the trailing edge.
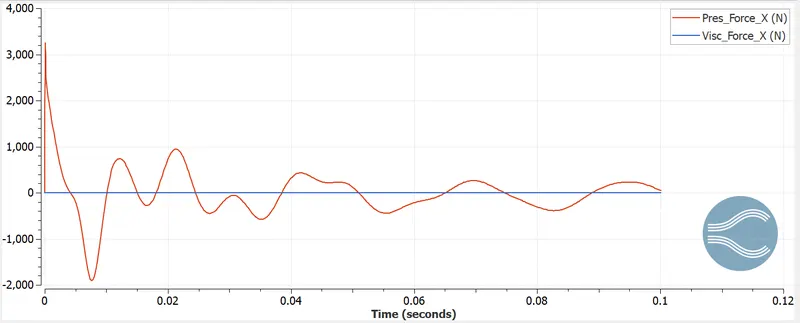
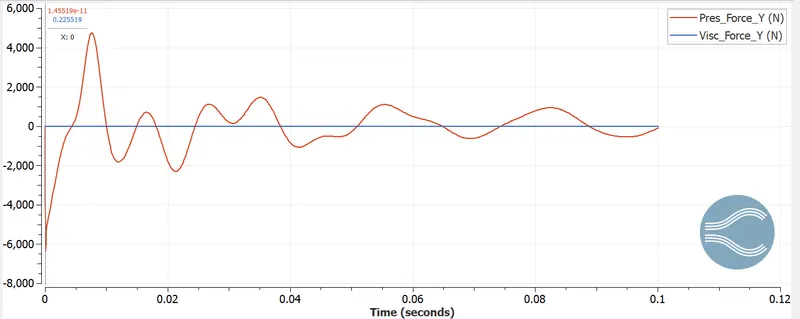
- Angle of attack = 15º
- Velocity contour
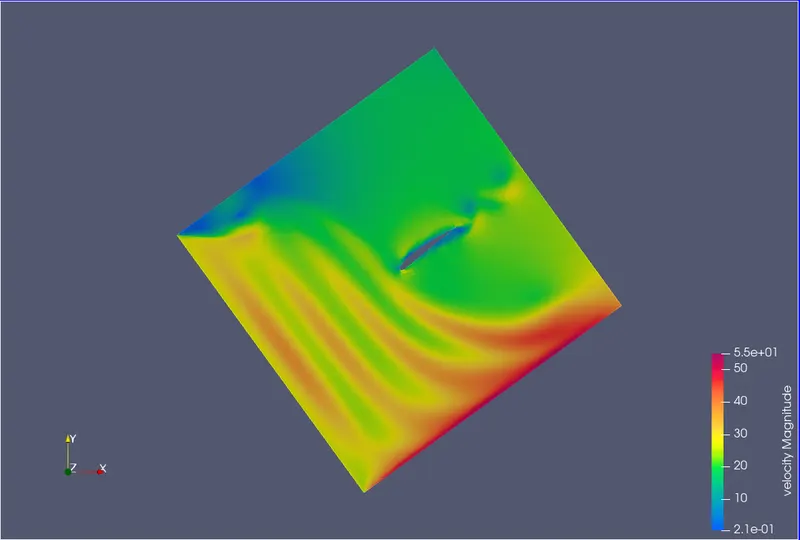
- The flow is stagnant. This means that the velocity of the flow near the wing is very low and the lift generated is correspondingly reduced.
- Pressure contour
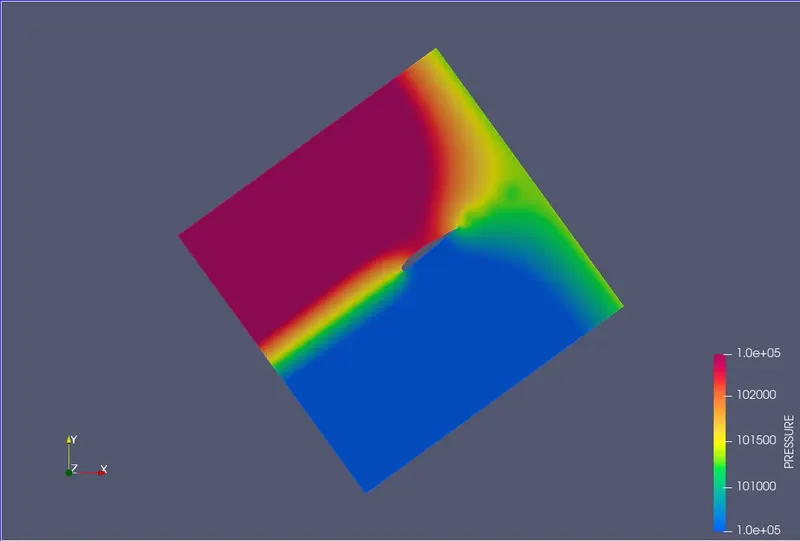
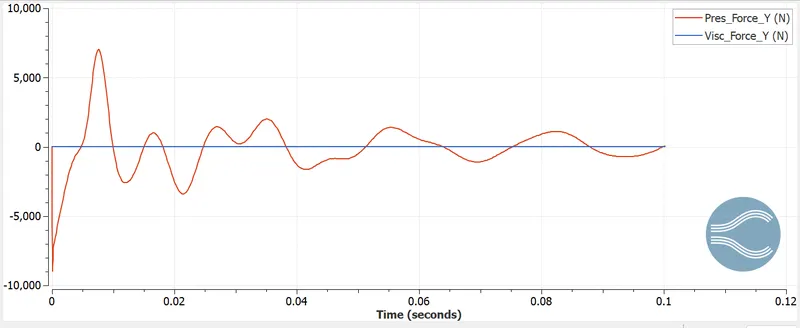
- At the stall point, the pressure is low and on the upper side is high . The drag force increases tremendously,by increasing angle of attack.
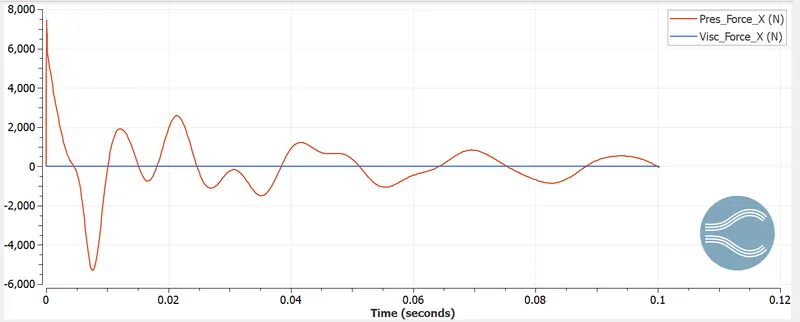
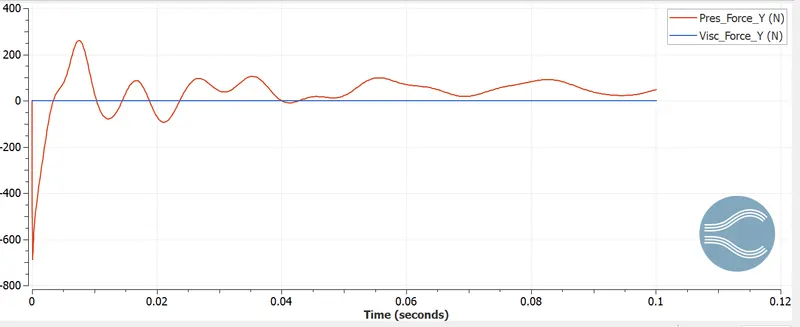
- Lift and drag coefficient calculation
| Angle of attack (deg) | Lift Force (N) | Drag Force (N) | Lift Coefficient | Drag Coefficient |
| 1 | 10.19 | 260.33 | 0.0518 | 1.328 |
| 5 | 15.71 | 260.43 | 0.0799 | 1.325 |
| 10 | 55.39 | 4683 | 0.2819 | 23.836 |
| 15 | 68.37 | 7020 | 0.3480 | 35.780 |
- It can be seen that lift increases by increasing angles of attack as top velocity increases. The separation point then moves forward of the wing and the flow separates as the angle of attack increases further. Drag increases with increasing angle of attack because an increase in lift is always accompanied by an increase in drag. From an angle of attack of 10 degrees there is a significant increase in drag, even if the stall reduces lift. This is caused by increased flow separation at the beginning of the wing and the flow is very turbulent.
- Conclusion
- The flow over the airfoil was simulated for different angles of attack and the effects of different turbulence models were discussed.
- At very low angles of attack, the airflow over the wing is essentially smooth and laminar, with a small amount of turbulence at the trailing edge of the wing.
- The point where laminar flow stops and turbulent flow begins is called the separation point.
- Increasing the angle of attack increases the area of the profile directly facing the wind. While this increases lift, it also moves the laminar separation point of the air over the wing partially upward toward the leading edge, resulting in increased turbulence and increased drag.