Project 1 - Parsing NASA thermodynamic data
- Write a function that extracts the 14 co-efficients and calculates the enthalpy, entropy and specific heats for all the species in the data file.
- Objective- To write a code for a function that extracts the 14 co-efficients and calculates the enthalpy, entropy and specific heats for all the species in the data file by using NASA thermodynamic data ,the formula are shown below;
Here R is the universal gas constant, T is the temeprature
clear all
close all
clc
f=fopen('THERMO.dat','r');
for i=1:5
fgetl(f);
end
for j =1:53
%extraction of local temperatures
a=fgetl(f);
species_name=strtok(a);
b=strsplit(a,' ');
local_low =str2num(b{end-3});
local_high=str2num(b{end-2});
local_mid =str2num(b{end-1});
%extraction of coefficients
%coeff_line =fgetl(f);
coeff_line1 =fgetl(f)
pos_e =strfind(coeff_line1,'E');
a1 =str2num(coeff_line1(1:pos_e(1)+3));
a2 =str2num(coeff_line1(pos_e(1)+4:pos_e(2)+3));
a3=str2num(coeff_line1(pos_e(2)+4:pos_e(3)+3));
a4=str2num(coeff_line1(pos_e(3)+4:pos_e(4)+3));
a5=str2num(coeff_line1(pos_e(4)+4:pos_e(5)+3));
coeff_line2 =fgetl(f)
pos_e1 =strfind(coeff_line2,'E');
a6 =str2num(coeff_line2(1:pos_e(1)+3));
a7=str2num(coeff_line2(pos_e(1)+4:pos_e(2)+3));
b1=str2num(coeff_line2(pos_e(2)+4:pos_e(3)+3));
b2=str2num(coeff_line2(pos_e(3)+4:pos_e(4)+3));
b3=str2num(coeff_line2(pos_e(4)+4:pos_e(5)+3));
coeff_line3 =fgetl(f)
pos_e2 = strfind(coeff_line3,'E');
b4 =str2num(coeff_line3(1:pos_e(1)+3));
b5 =str2num(coeff_line3(pos_e(1)+4:pos_e(2)+3));
b6 =str2num(coeff_line3(pos_e(2)+4:pos_e(3)+3));
b7 = str2num(coeff_line3(pos_e(3)+4:pos_e(4)+3));
%to create new directory and creating seprate folder
cd('C:\Users\Shruti Jadhav\Documents\MATLAB')
dir_name = species_name;
mkdir(dir_name);
cd(species_name)
MW =molecular_weight(species_name)
T =linspace(local_low,local_high,100);
[cp,H,S] =therm_prop(a1,a2,a3,a4,a5,a6,a7,b1,b2,b3,b4,b5,b6,b7,local_mid,T);
figure(1)
plot(T,cp)
xlabel('Temperature')
ylabel('specific heat')
saveas(figure(1),'Temperature vs specific heat.png')
figure(2)
plot(T,H)
xlabel('Temperature')
ylabel('Enthalpy')
saveas(figure(2),'Temperature vs Enthalpy.png')
figure(3)
plot(T,S)
xlabel('Temperature')
ylabel('Entropy')
saveas(figure(3),'Temperature vs Entropy.png')
cd ..
end
- The functions for the above code can be given as,
- Therm_prop :
function [cp,H,S] =therm_prop(a1,a2,a3,a4,a5,a6,a7,b1,b2,b3,b4,b5,b6,b7,local_mid,T)
R =8.314;
if(T<=local_mid)
cp =R.*(b1+b2*3+b3*T.^2+b4*T.^3+b5*T.^4);
H = R.*T.*(b1+b2*(T/2)+b3*((T.^2)./3)+b4*((T.^3)./4)+b5*((T.^4)./5)+b6./T);
S = R.*(b1*log(T)+b2*T+b3*((T.^2)./2)+b4*((T.^3)./3)+b5*((T.^4)./4)+b7);
else
cp = R.*(a1+a2*T+a3*T.^2+a4*T.^3+a5*T.^4);
H = R.*T.*(a1+a2*(T/2)+a3*((T.^2)./3)+a4*((T.^3)./4)+a5*((T.^4)./5)+a6./T);
S = R.*(a1*log(T)+a2*T+a3*((T.^2)./2)+a4*((T.^3)./3)+a5*((T.^4)./4)+a7);
end
end- Molecular_weight:
function MW =molecular_weight(species_name)
atoms = ['H','C','N','O','A'];
     fprintf('Molecular Weight of ');
    fprintf(species_name);
    fprintf(' : ');
    atomic_weight = [1 12 14 16 39];
    MW = 0;
    for i = 1:length(species_name)
        for j = 1:length(atoms)
            if strcmp(species_name(i),atoms(j))
                MW = MW +atomic_weight(j);
                position = j;
            end
        end
        n = str2num(species_name(i));
        if n>1
            MW = MW + atomic_weight(position)*(n-1);
        end
    end
    fprintf('%d',MW);
    disp(' ');
    end
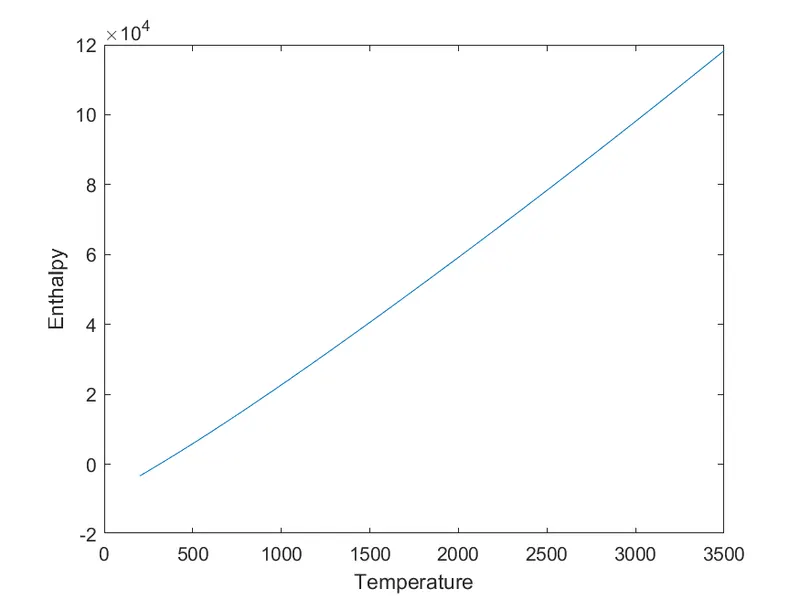
Results -1. O2 - Enthalpy vs Temperature
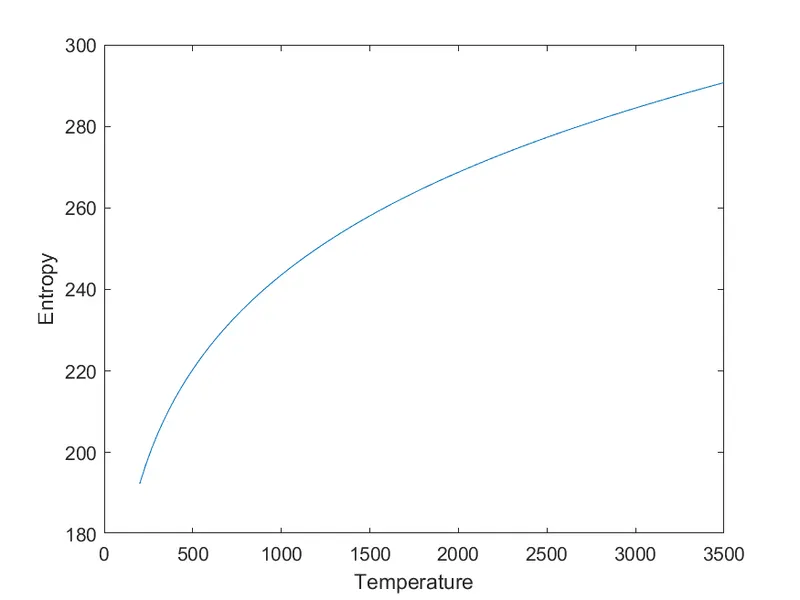
Temperature vs Entropy-
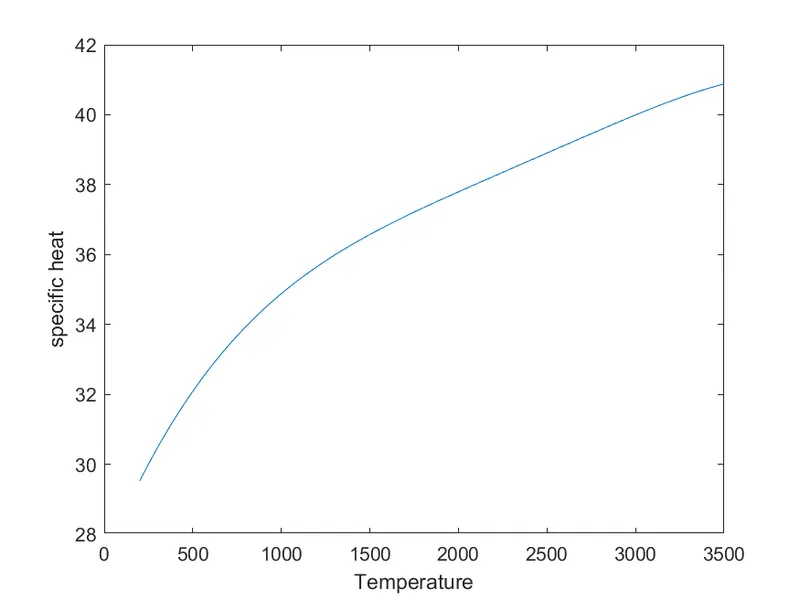
Temperature vs Specific heat-
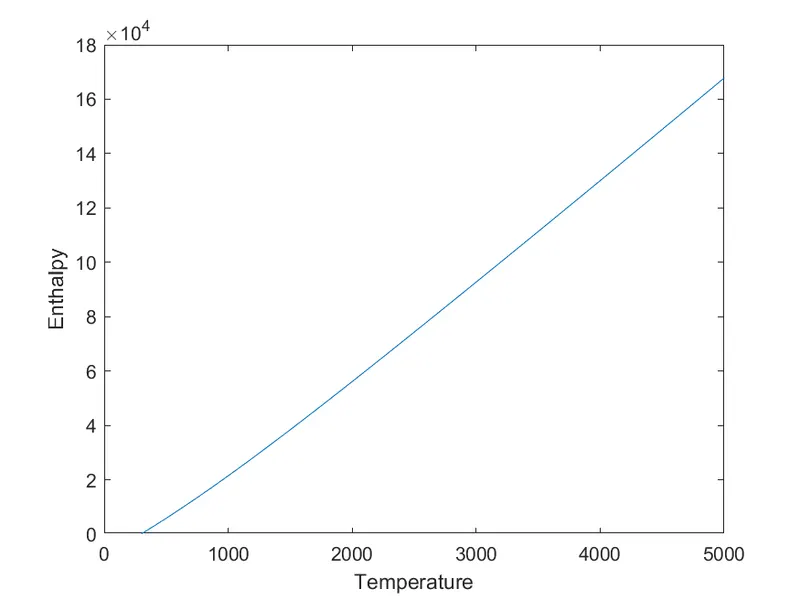
2. N2
Temperature vs Enthalpy-
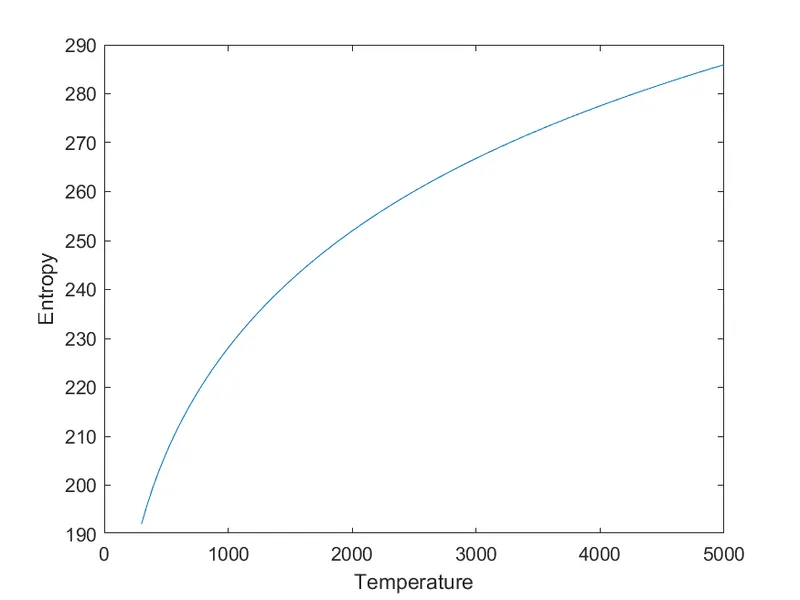
Temperature vs Entropy-
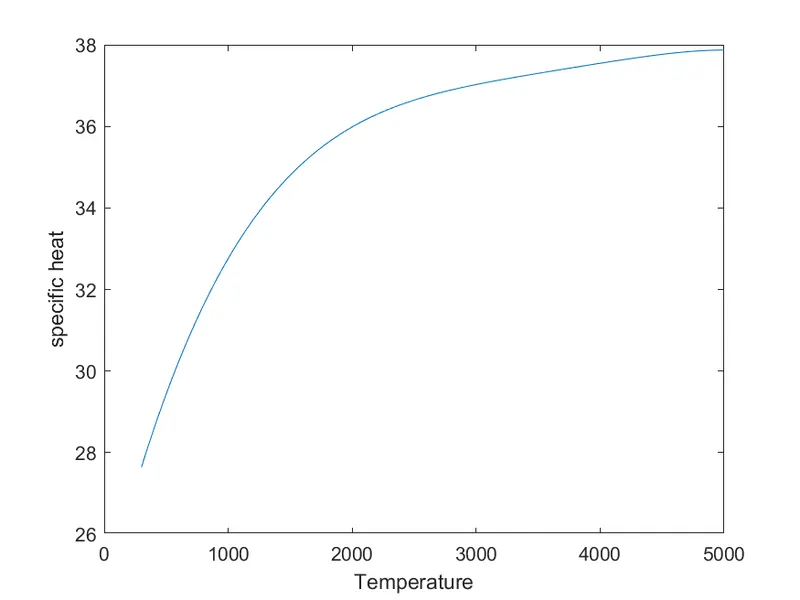
Temperature vs Specific heat-
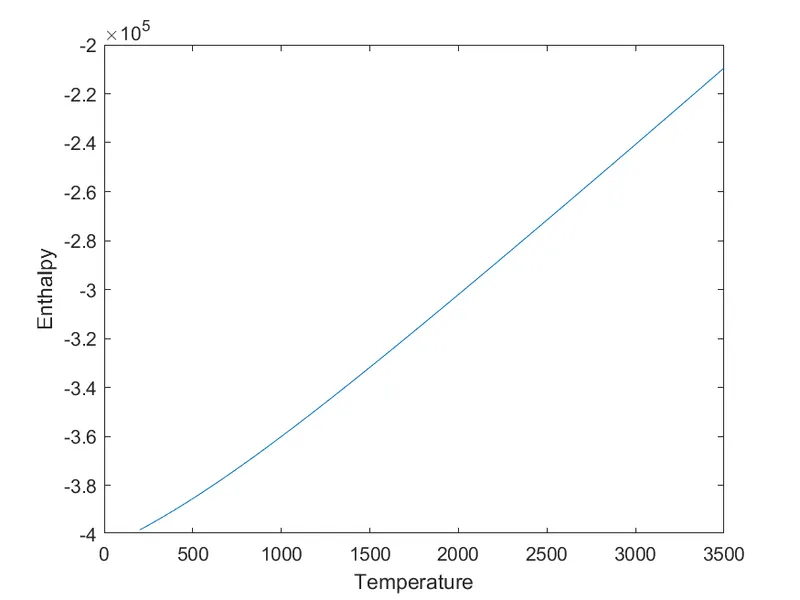
3.CO2-
Temperature vs Enthalpy-
Temperature vs Entropy-
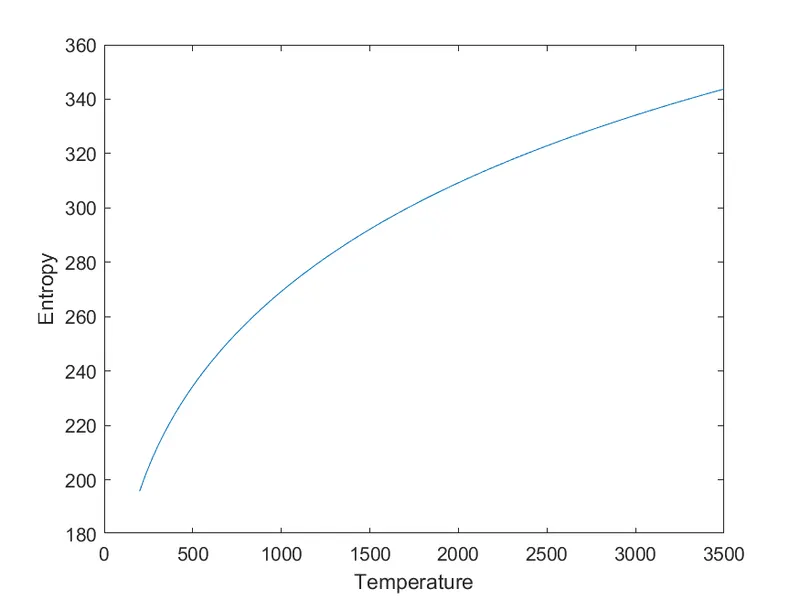
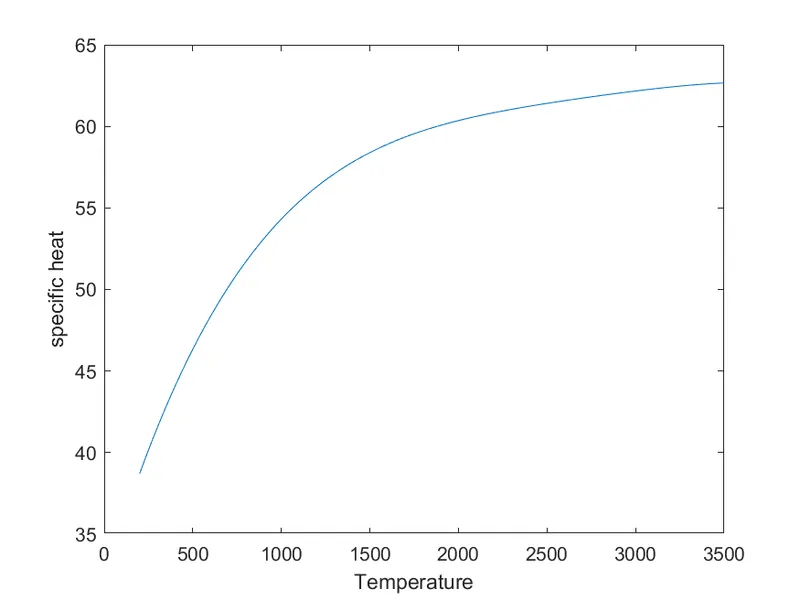
Temperature vs Specific heat-
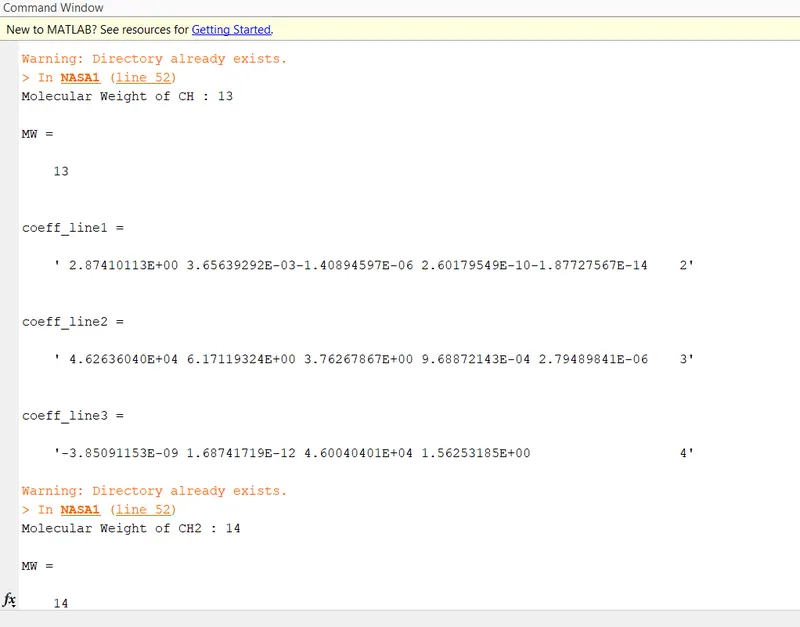
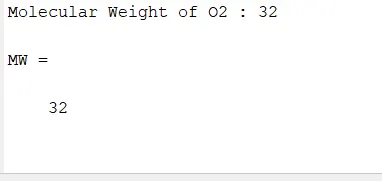
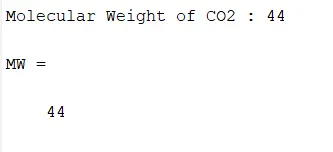
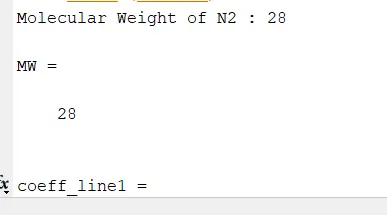
- Molecular Weight of N2, CO2, O2 -
- Stepwise explaination of the code-
- The code begins with a comment using the "%" command.
- Then type the commands "clear all", close all and "clc" to clear the desktop, close other programs and clear the command window screen.
- I use "fopen()" statement to open the given data file and stored in the required variable as shown in the code.
- Now to read the initial five (5) lines, then generate a "for loop" with a scope of 1:5 and use the command "fgetl(f)l" to read those lines.
- So if we observe the given data files, how we read the first five lines of this given data. This means that out of 218 rows, 5 rows are read.
- According to the data, the pattern is clearly every 1 to 4 lines, each kind of element is indicated. This means we have 53 species and each species contains 4 lineages.
- Using the above pattern, store the species of elements from the first row of 53 species.
- Then I get the local low temperature, local high temperature and local average temperature data.
- Now assign the values of the coefficients a1,a2,a3,a4,a5,a7,b1,b2,b3,b4,b5,b6,b7 as shown in the code.
- Create a new directory in the default library where I store all 53 species charts in a separate folder.
- The "therm_prop" function and assign a value like [cp,H,S] where cp is the specific heat, H is the enthalpy and S is the entropy.
- Also the "molecular_weight" function and assigning that value as molecule_name.
- Plot this value as shown in the code and save all three images in a separate species folder using the command "savesas(figure,'filename.format')".
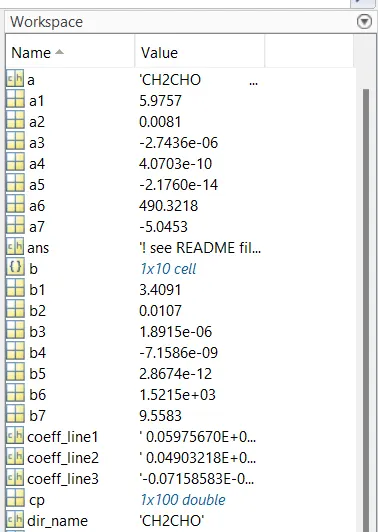
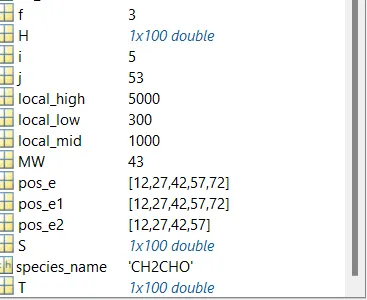
Command window-