Week - 9 Material Modeling from Raw Data
WEEK 9 CHALLENGE - MATERIAL MODELING FROM RAW DATA
AIM:
To Create Material from a raw data using stress-strain curve and use the material model with a dogbone specimen and validate the same.
WORKFLOW:
- Extract the data from the diagram
- Clean the data and visually confirm that it matches the original data and the elastic modulus is 20.9E+06 psi.
- Convert the data to (kg-mm-ms) unit system
- Process the data and create the material as demonstrated
- Use the material model with a dogbone specimen and validate the same
GIVEN:
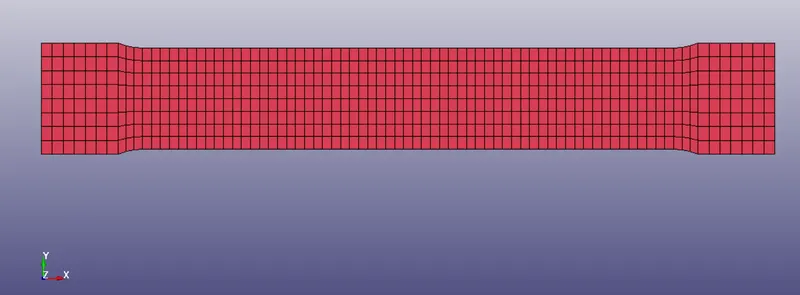
DOGBONE MESH MODEL:
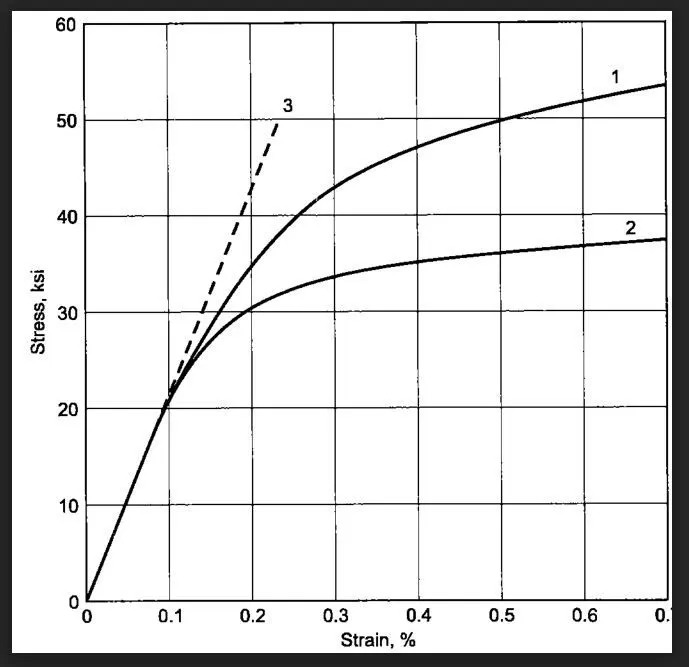
MATERIAL CURVE:
PROCEDURE:
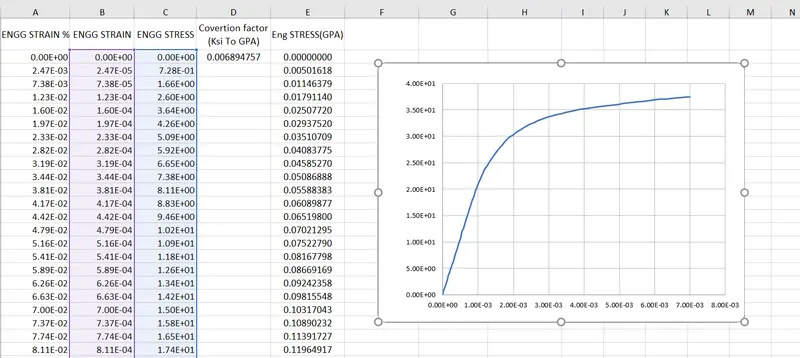
- Using Data digitizer, the stress and strain data is extracted in the form of excel and unit in Ksi.Check the curve with the original curve given.
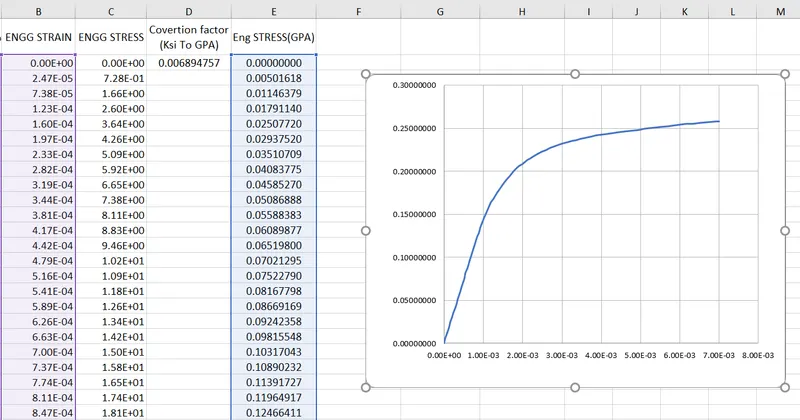
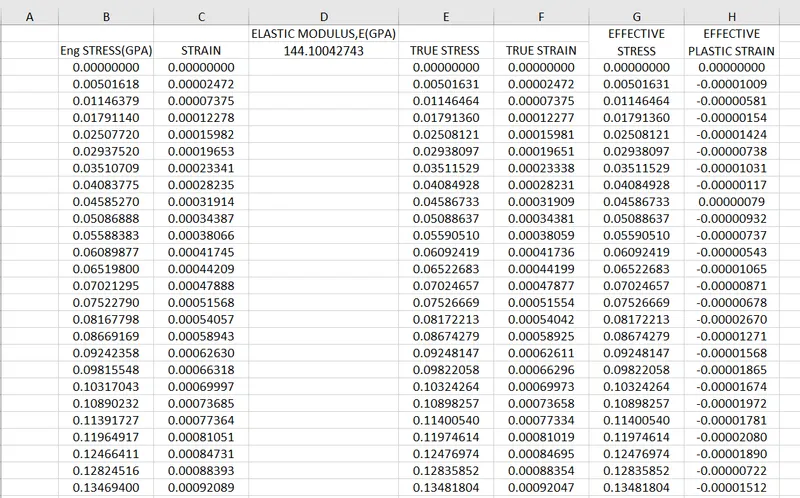
- The Stress is converted into GPA and plot the curve for Engineering Stress and Strain
- Converting Engineering Stress and Strain into True stress and strain using the formula
True stress = (engineering stress) * exp(true strain)
- Then convert true Strain into Effective plastic Strain by using the formaula
Effective plastic strain = Total true strain - True Stress/E
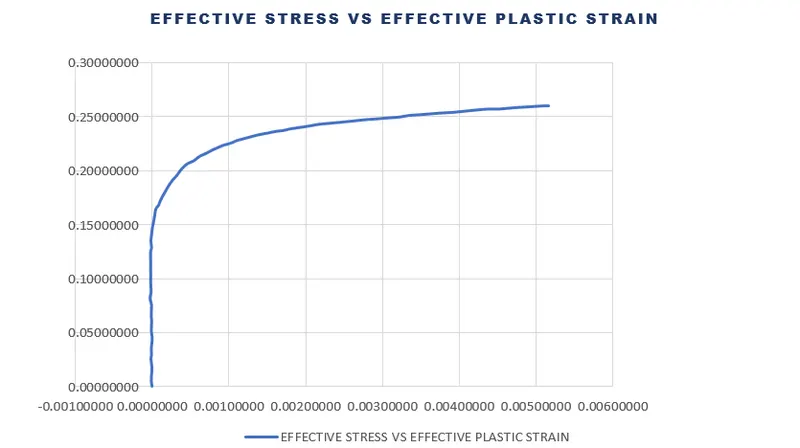
- Plotting Effective Stress vs Effective plastic Strain and getting Yield strength value as 0.1513300
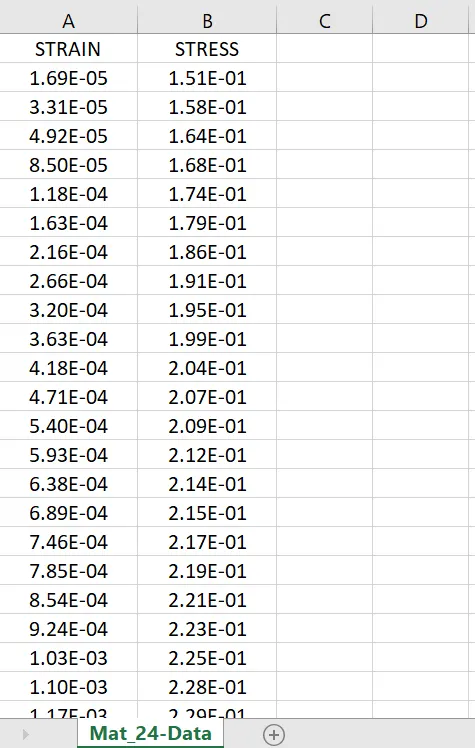
- Final data to input for material curve in MAT_PIECEWISE_LINEAR_PLASTICITY(024):
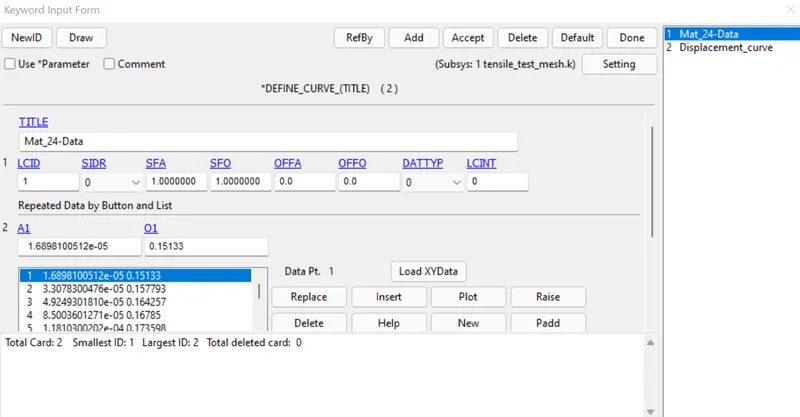
- Import the given tensile_test_mesh.k in LS prepost and define a Material Curve with Data get from the Curve
- Create a Material Card for Graphite_Iron_Casting with the Material Curve
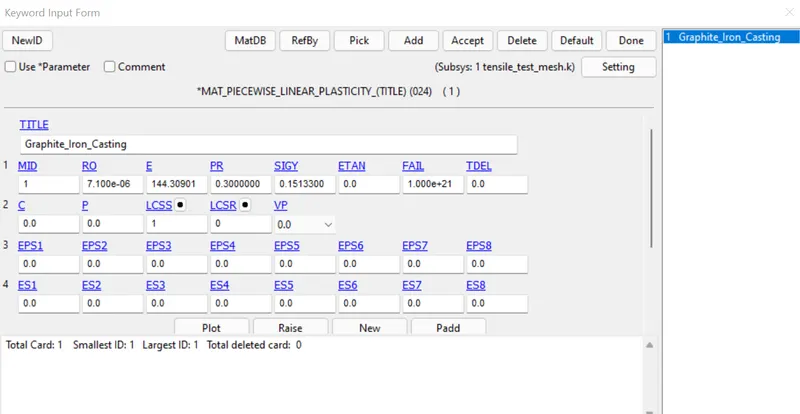
SIGY the Yield strength taken from the effective Plastic Strain and Effective Stress and E is given as elastic modulus = 20.9E+06 psi and that is convert into 144.100 Gpa .
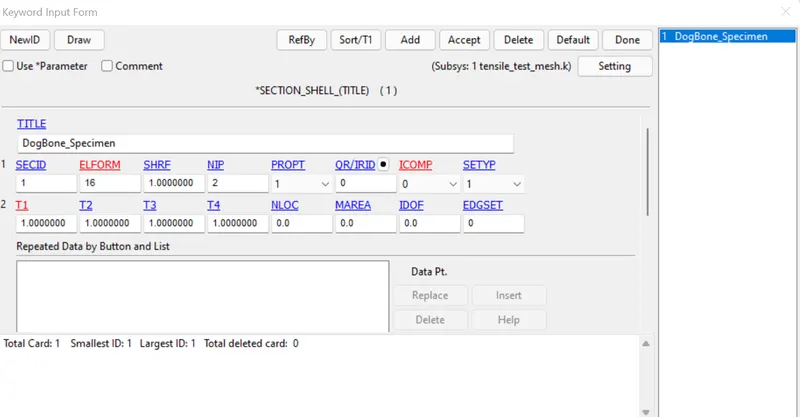
- Section card is create as Shell with 1mm thickness with Elform 16(EQ.16: Fully integrated shell element)
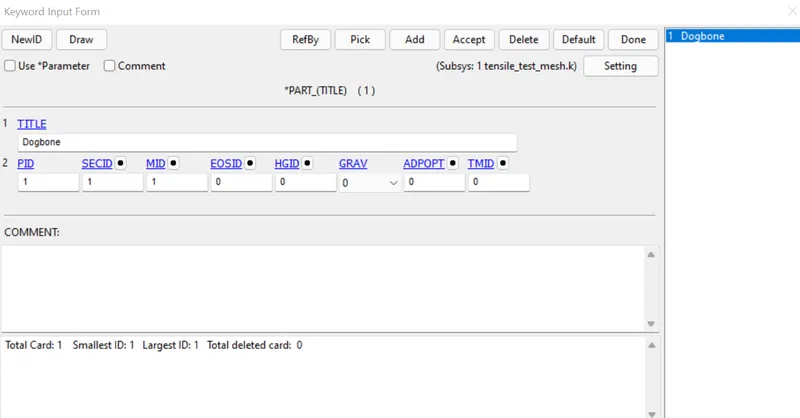
- Mat 24 and Shell Section as been assigned to the Dogbone specimen Part
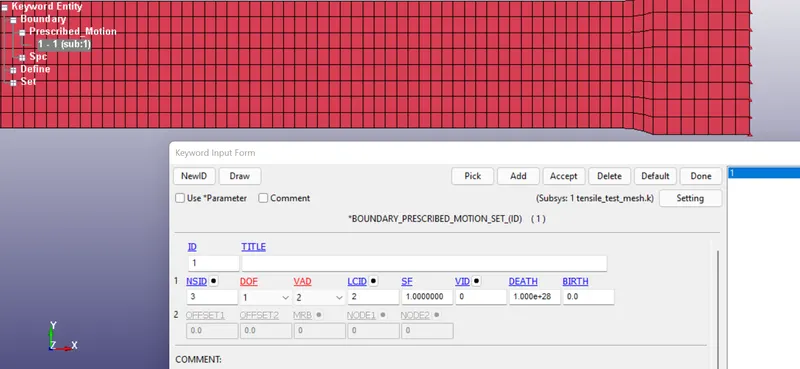
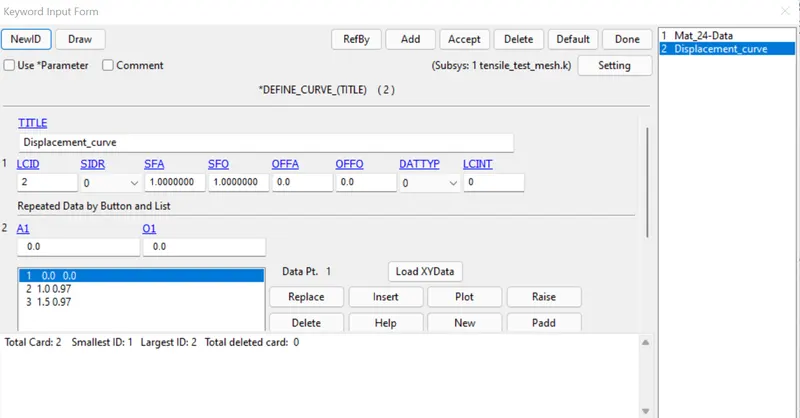
- Boundary condition as been assigned to both end of the specimen.For right side Prescribed motion with displacement curve as been created and for left side Prescribed Spc as been created
Boundary Prescribed_motion_Set:
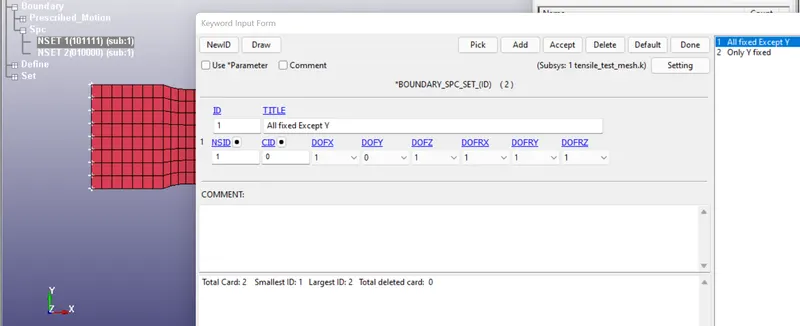
Boundary Spc 1: The nodes at the fixed end are constrained in the X and Z direction only and the Y direction is not constrained because of
lateral expansion during the tensile test.
Displacement Load curve:
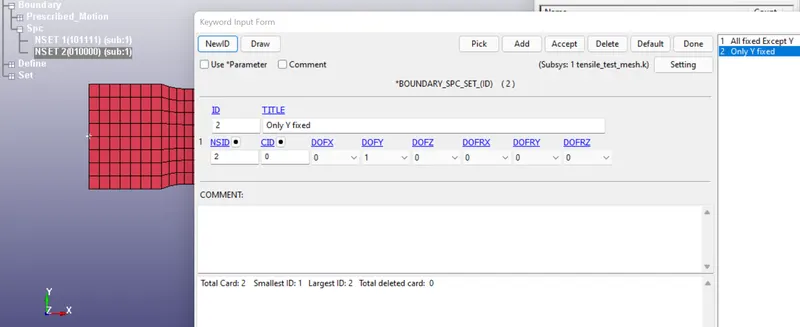
Boundary Spc 2: The nodes at the middle are constrained in the Y direction since the neutral axis passes through the middle of the specimen in the X-direction
CONTROL CARD:
Implicit analysis is taken as the tensile test is consider as Static analysis.
*CONTROL_IMPLICIT_GENERAL
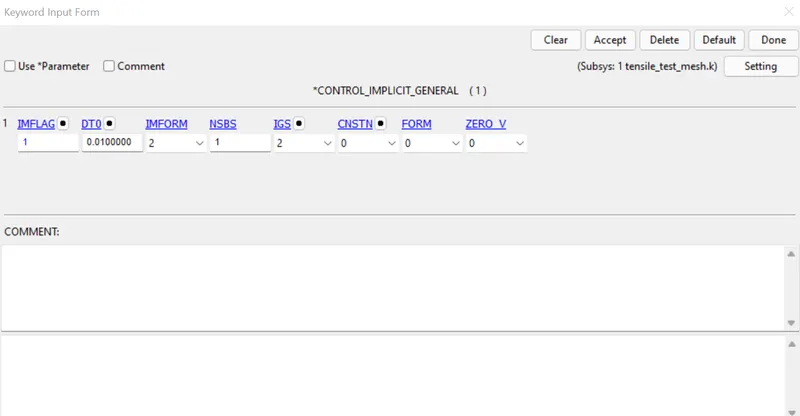
- IMFLAG: Implicit/Explicit analysis type: 1 - implicit analysis.
- DT0: Initial time step size for implicit analysis: 0.010000
- IMFORM: 2 retain original element formulation
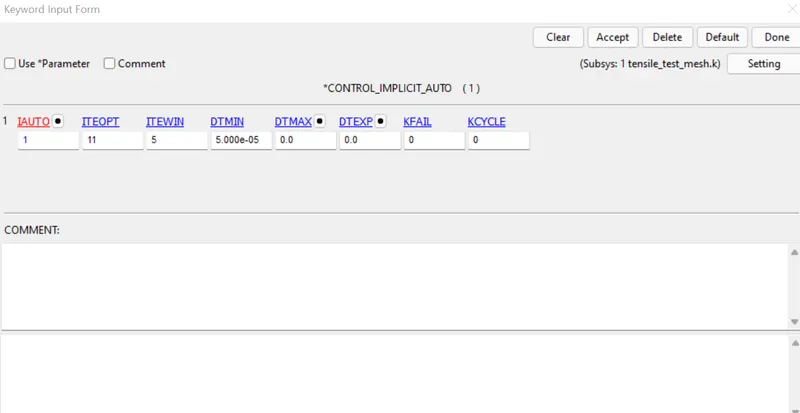
*CONTROL_IMPLICIT_AUTO
This card has been defined to adjusts the time step size
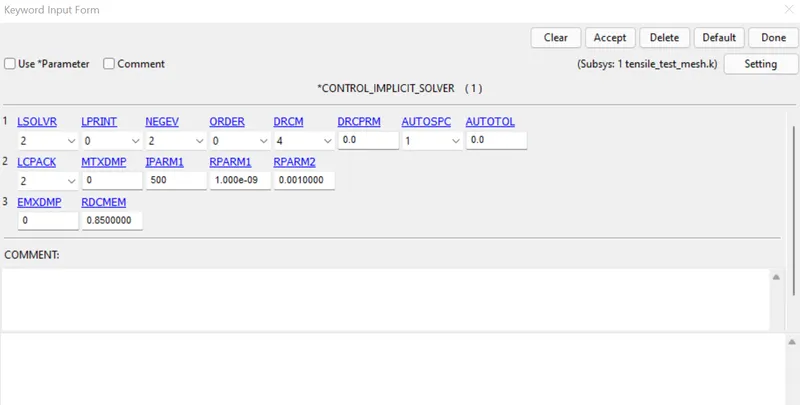
*CONTROL_IMPLICIT_SOLVER
The linear equation solver performs the CPU-intensive stiffness matrix inversion
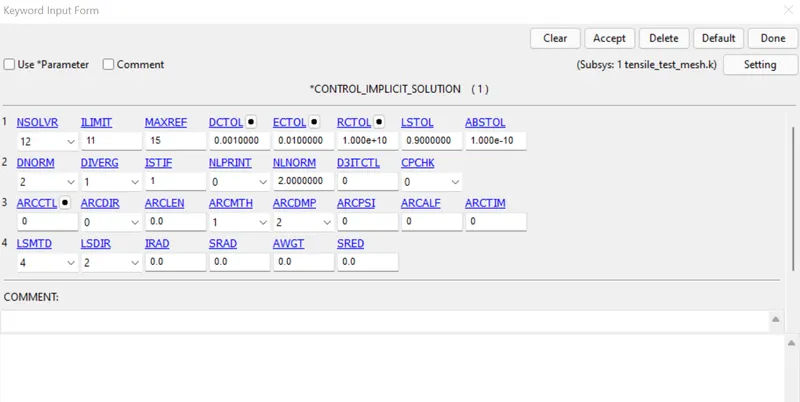
*CONTROL_IMPLICIT_SOLUTION
Use of these cards to specify whether a linear or nonlinear solution is consider
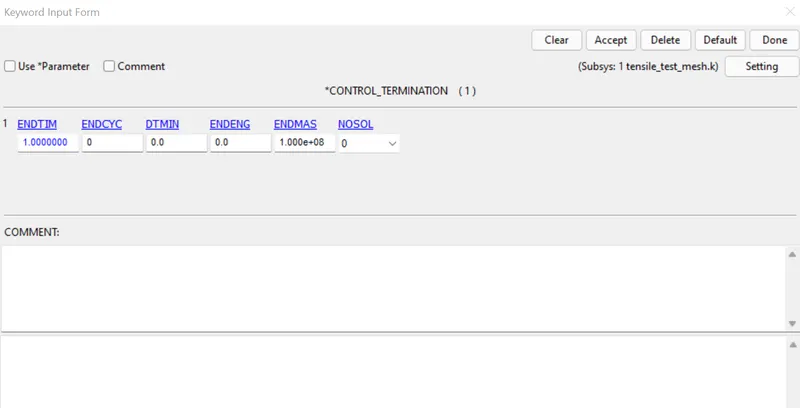
*CONTROL_TERMINATION:
This card is used to mention the termination time of the simulation
Database Cards:
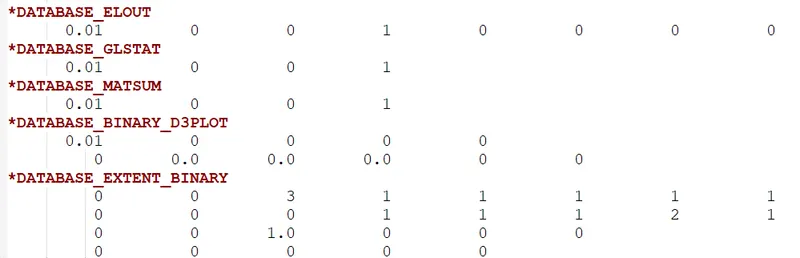
BINARY_D3PLOT: It defines the frequency at which the animation file is to be created and is set to 0.01 ms
DATABASE_EXTEND_BINARY: This writes the strain tensor to d3plot when STRFLG is set to 1
DATABASE_ASCII_Option: The output request in ASCII format, The following keyword is Activated and
ELOUT: Element Output Data and
GLSTAT: Global Data.
MATSUM: Material Energies
Save the file in .k format and run the simulation in Ls Run
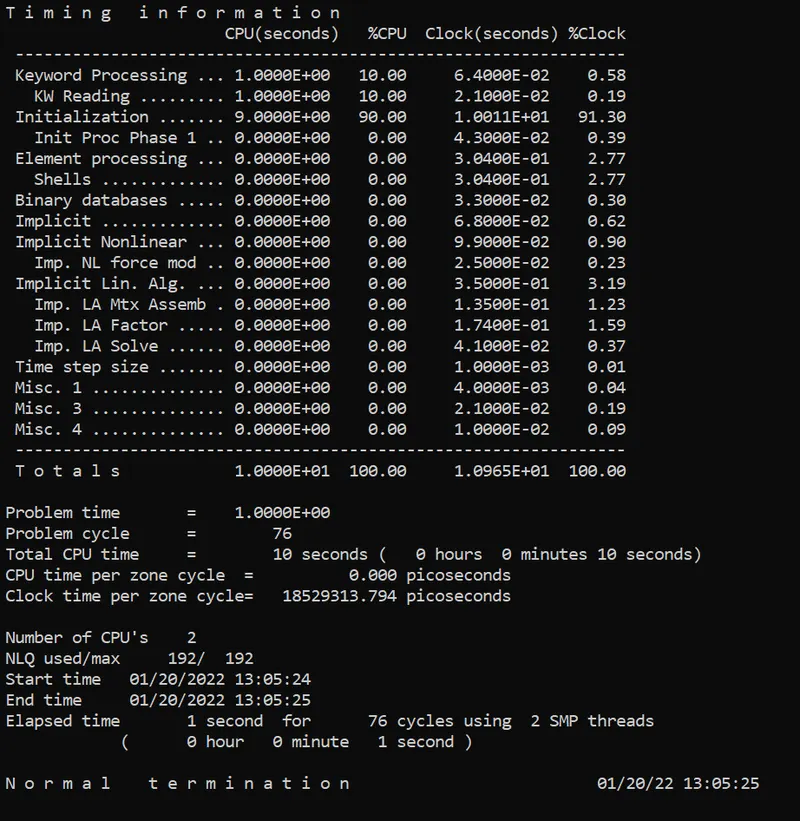
RESULTS:
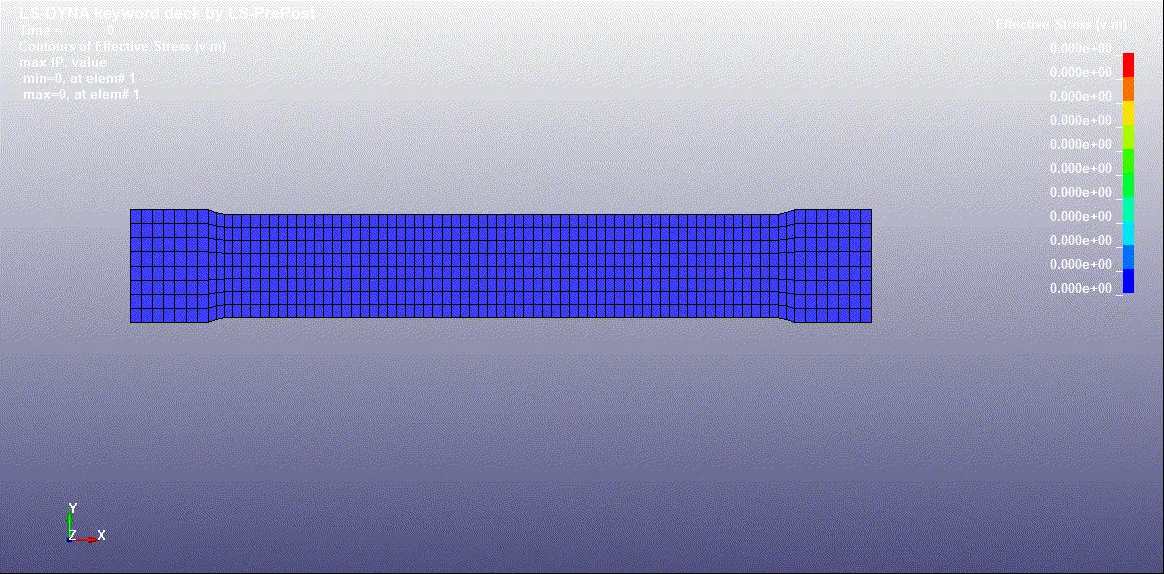
ANIMATION OUTPUT FOR EFFECTIVE STRESS(v-m)
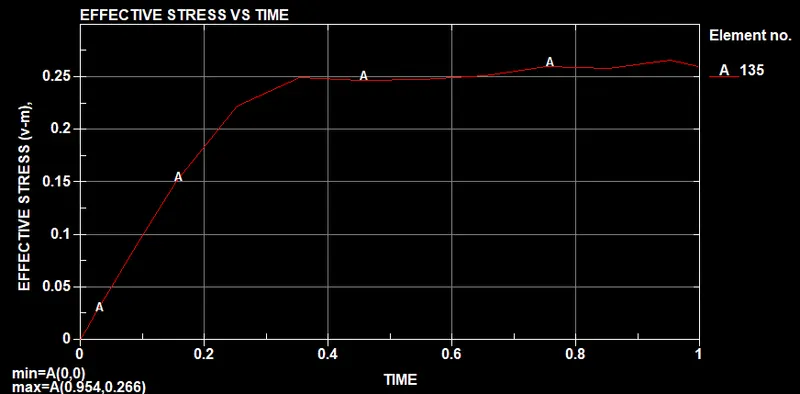
PLOT FOR EFFECTIVE STRESS VS TIME
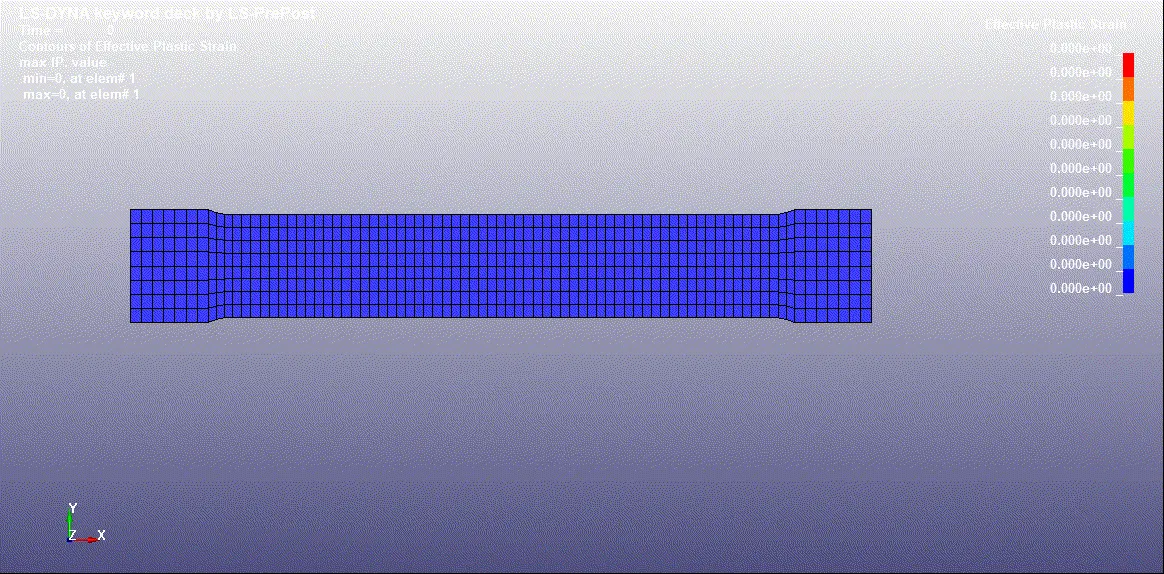
ANIMATION OUTPUT FOR EFFECTIVE PLASTIC STRAIN
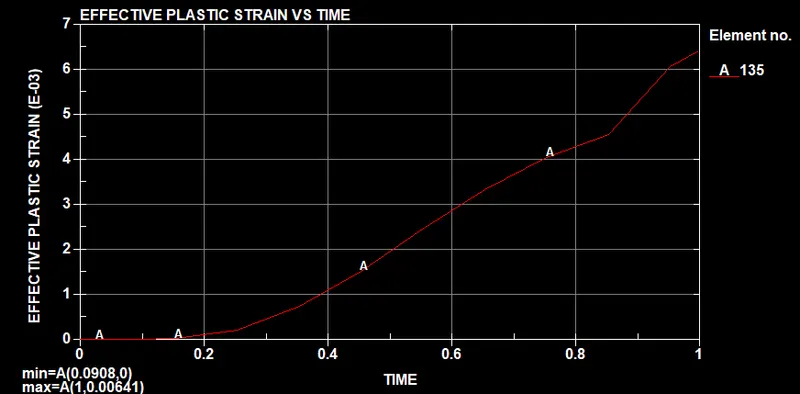
PLOT FOR EFFECTIVE PLASTIC STRAIN VS TIME
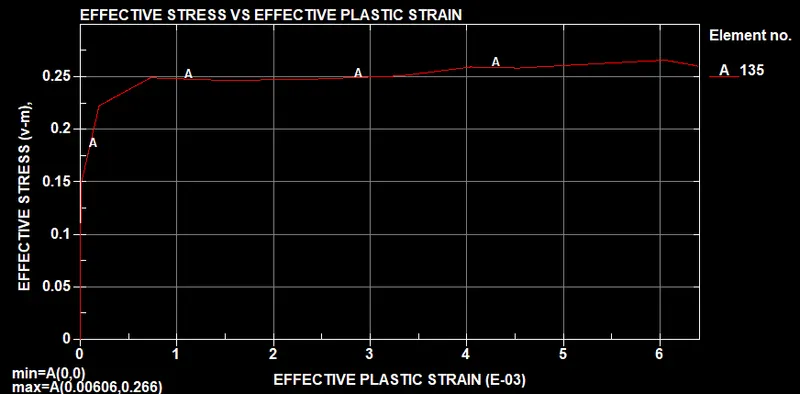
STRESS VS STRAIN PLOT AFTER SIMULATION:
CONCLUSION:
- The stress-strain data extracted from the image is validated with the MAT_024(Piecewise linear plasticity) material
model - From the simulation we have plot the Effective stress and Effective plastic strain.Compared both Stress and Strain
- Stress-Strain behavior of simulated curve is similarly matched with Stress-Strain curve in the material model with a small variation because of density and Poisson's ratio given in the MAT 24 material Card differ from Raw Data.