Week - 9 Material Modeling from Raw Data
AIM: The main aim of this week challenge is to use the true stress-strain curve given for graphite iron casting, create a material model for the Dogbone specimen. Validate the create material model card by performing a tensile test on a Dogbone specimen. Finally, the results are compared.
PROCEDURE:
You can see that the image we got represent the stress and strain percentage curve that we got for a eloasto-plastic material. Since it is a elasto plastic material we can consider the material model MAT-24.Since we need to take any one curve for the data processing i am considering the curve 2.
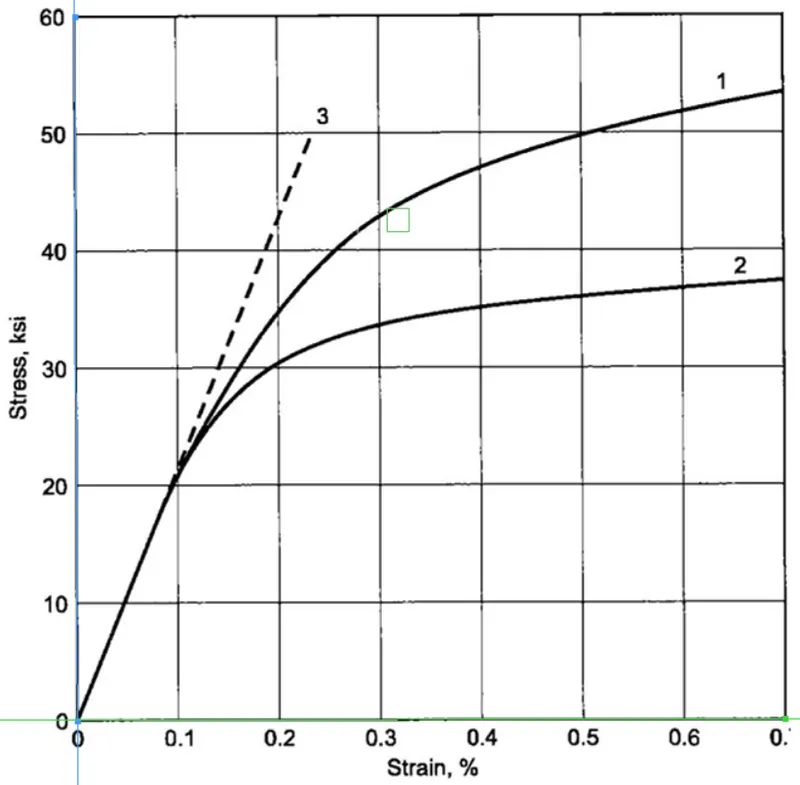
By using the GETDATA GRAPH DIGITIZER application, the data points are extracted from image file.
After extracting the points from the graph and extracting them in the excel plot the graph to see whether the graph matches.
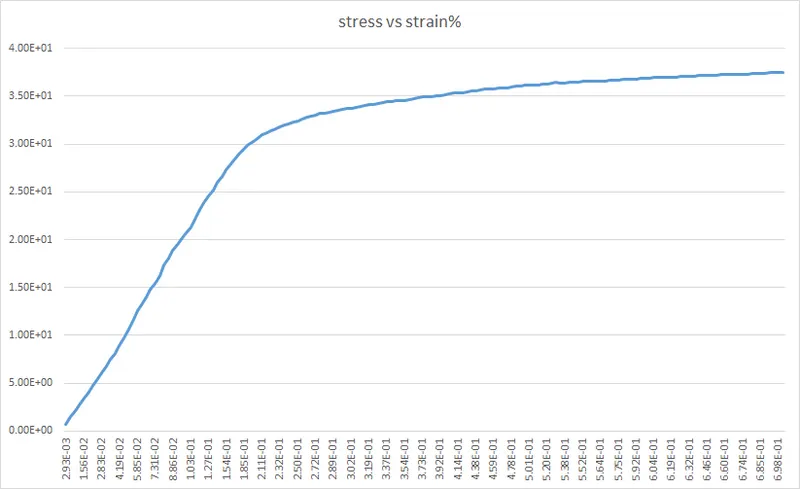
we know that the data for stress in ksi and for strain it is in strain percentage.So we need to convert the stress into Gpa and strain from percentage to value
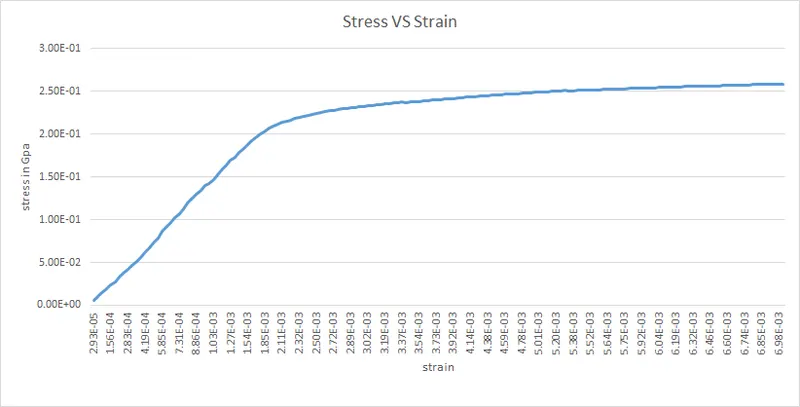
Once the unit conversion is done, we can see the extracted data are True stress and True strain But to define a Stress-Strain curve in *MAT_24 card, We have to define it in Effective stress and Effective plastic strain format. The true stress and strain values are converted into Effective stress and Effective plastic strain value by using the following formula.
Effective stress = True stress
Effective plastic strain = True strain - True stress /E
Young's Modulus is given for the material as 144 GPa.
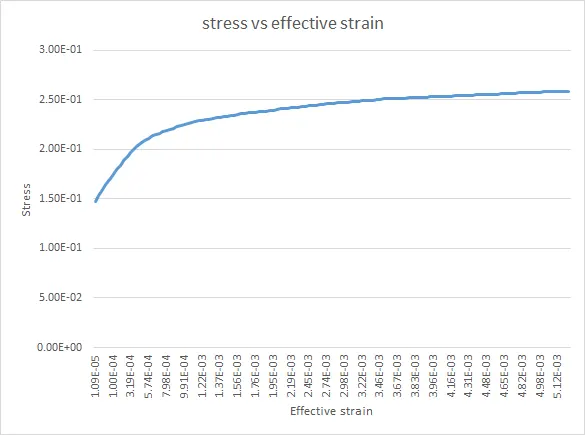
Now using these points create a curve in ls-dyna.
STEP 1: Open the LS-DYNA pre post and import the basic file containing the nodes and element.
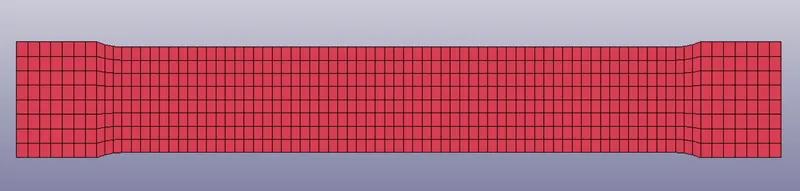
STEP 2:Now create material and section cards for the part.
STEP 3:Open the keyword manager and check the all button.Under the MAT keyword select the MAT 24 PIECEWISE_LINEAR_PLASTICITY.
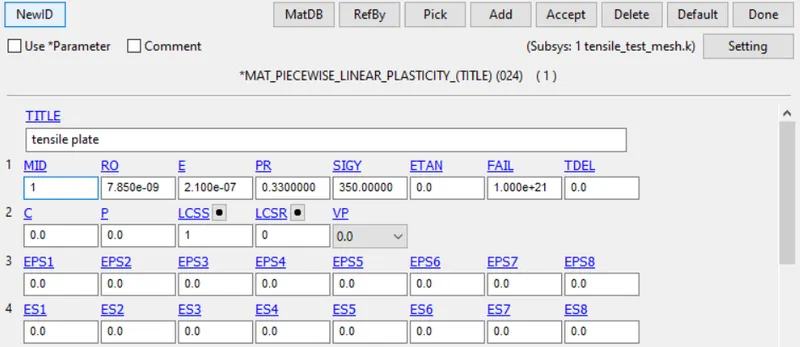
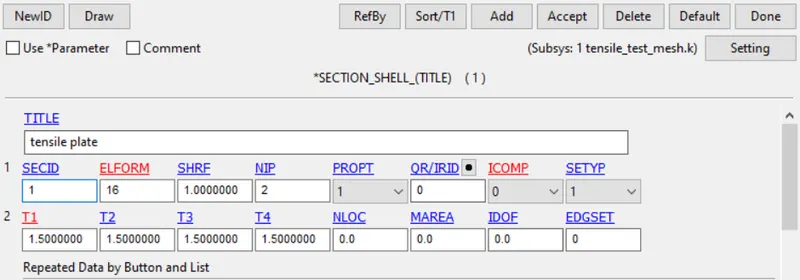
STEP 4:Open the keyword manager and check the all button.Under the SECTION keyword select the SHELL card for wall.Now give the properties of shell as desired.
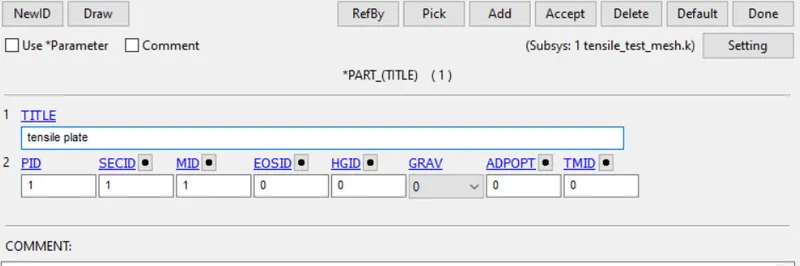
STEP 5: Now go to PART keyword and assign the part with the desired material and section cards.
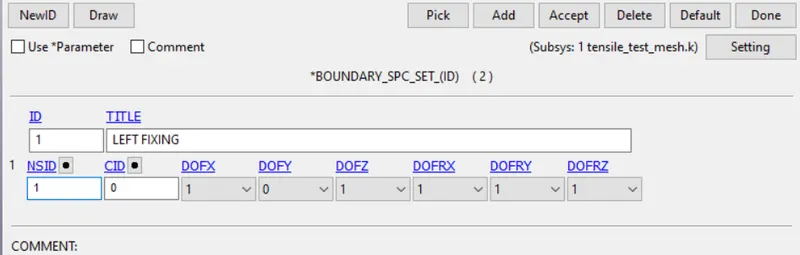
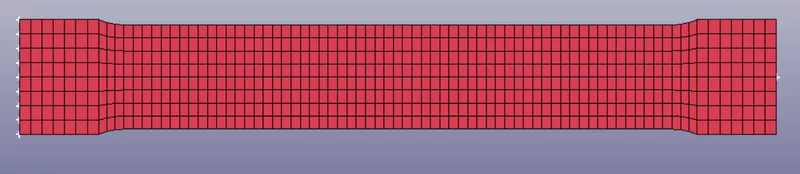
STEP 6:The nodes at the fixed end is constrained in the Xand Z direction only and the Y direction is not constrained because of lateral expansion during the tensile test.
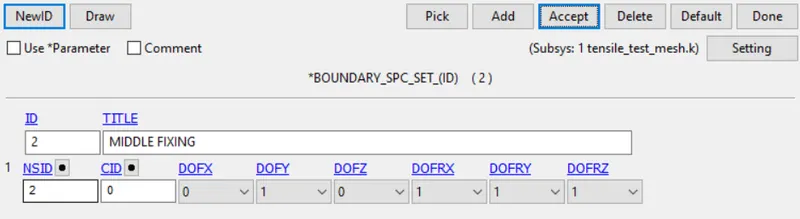
The nodes at the middle is constrained in the Y-direction since the neutral axis passes through the middle of the specimen in the X-direction.
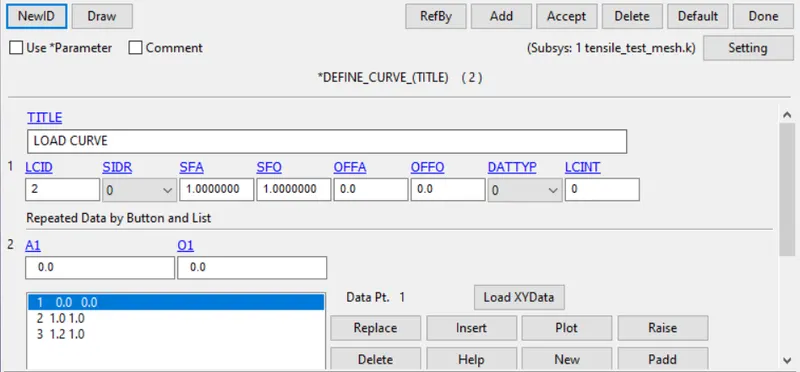
STEP 7:Now define a curve in order to give the displacement boundary condition.
STEP 8:Open the keyword manager and check the all button.Under the DEFINE keyword select the CURVE.
STEP 9:Open the keyword manager and check the all button.Under the BOUNDARY keyword select the PRESCRIBED_MOTION_SET.
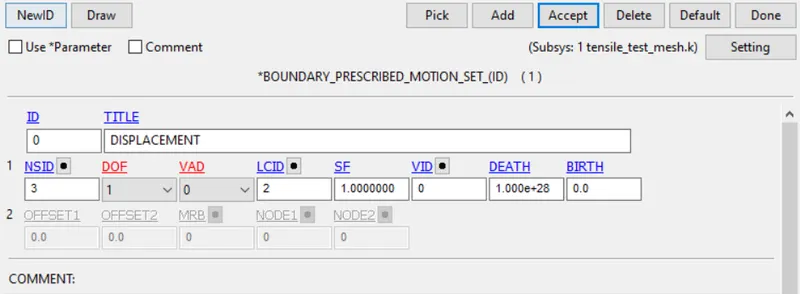
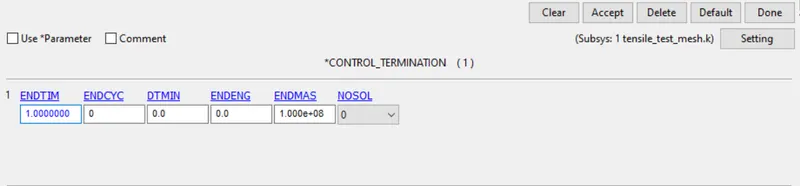
STEP 10:Open the keyword manager and check the all button.Under the CONTROL keyword and select TERMINATION.Now give the total time of the simulation.
 STEP 11:Open the keyword manager and check the all button.Under the DATABASE keyword and select ASCII,D3PLOT.
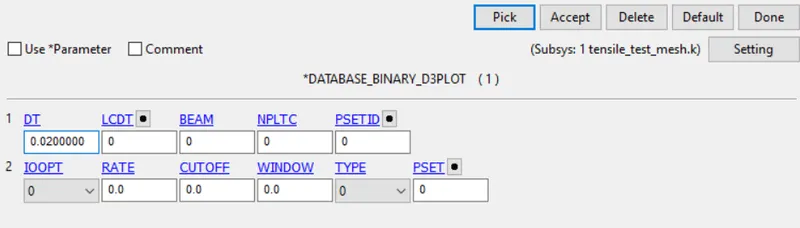
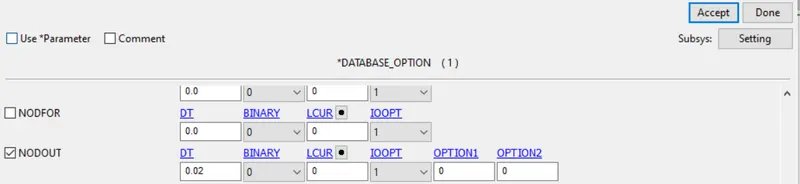
now run the model
OUTPUT :
STRESS PLOT
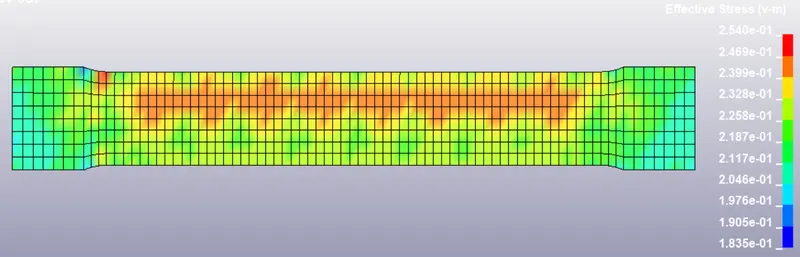
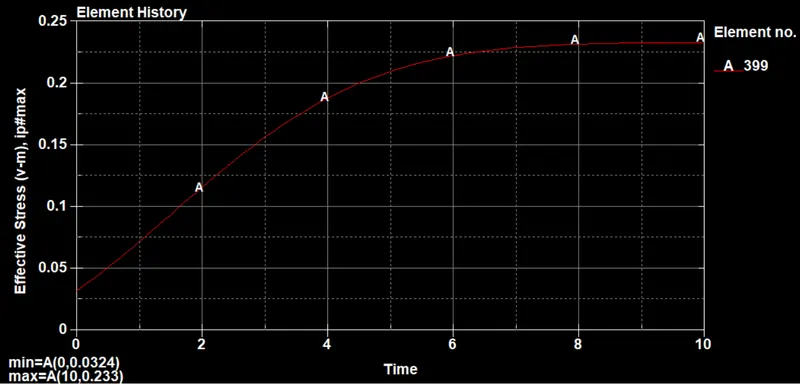
STRAIN PLOT
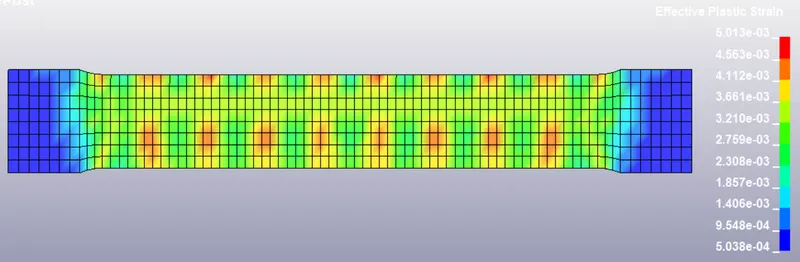
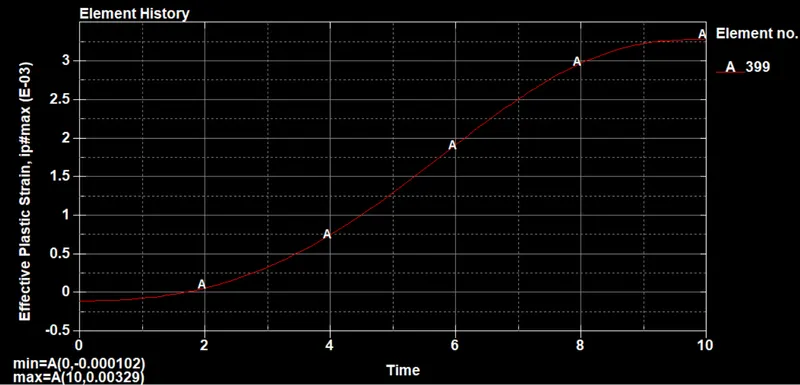
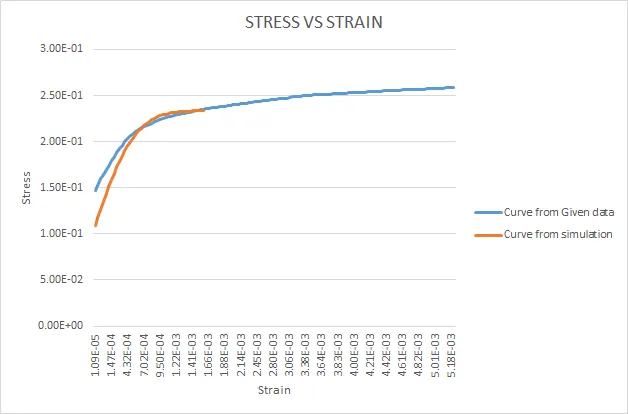
Thus from the above stress and strain plot the data points are removed and from that the stress vs strain curve is generated and it is compared with the original data
CONCLUSION:
Thus from the above data the two curves are compared and plotted. But you could see that there is difference in the initial stages and it is because of the curve fitting.Also we have seen little variation in the simulation data, which can due to the lack of information like density and Poisson's ratio for the raw data, Mesh Size of the
model or defining proper strain rate. These variations can be fine-tuned by trying different values of these properties and by selecting more data points to better capture the curve feature.