Week - 9 Material Modeling from Raw Data
OBJECTIVE:
The main objective of this challenge is to extract the data from the given graph and to create a material card MAT 24 and to use the MAT 24 card in a dogbone specimen to stimulate a tensile behaviour of the dogbone specimen.
PROCEDURE:
- Initially the points in the graph are taken to plot in excel using the data digitizer application.
- The plotted points are exported to excel to further interpolate on stress and strain values.
- The stress value derived is Engineering stress and the strain value derived is engineering strain value.
- True stress and strain value are calculated and converted using the formula given in the video.
- From true stress and true strain, effective plastic strain and Von-Mises stress have been calculated and the same has been used to plot the graph in the excel.
- These stress and strain values are defined in load curve card which is used in Material card for the reference.
- Dogbone specimen is taken and the necessary boundary conditions like fixing one end of the specimen to simulate tensile behaviour of the specimen is done.
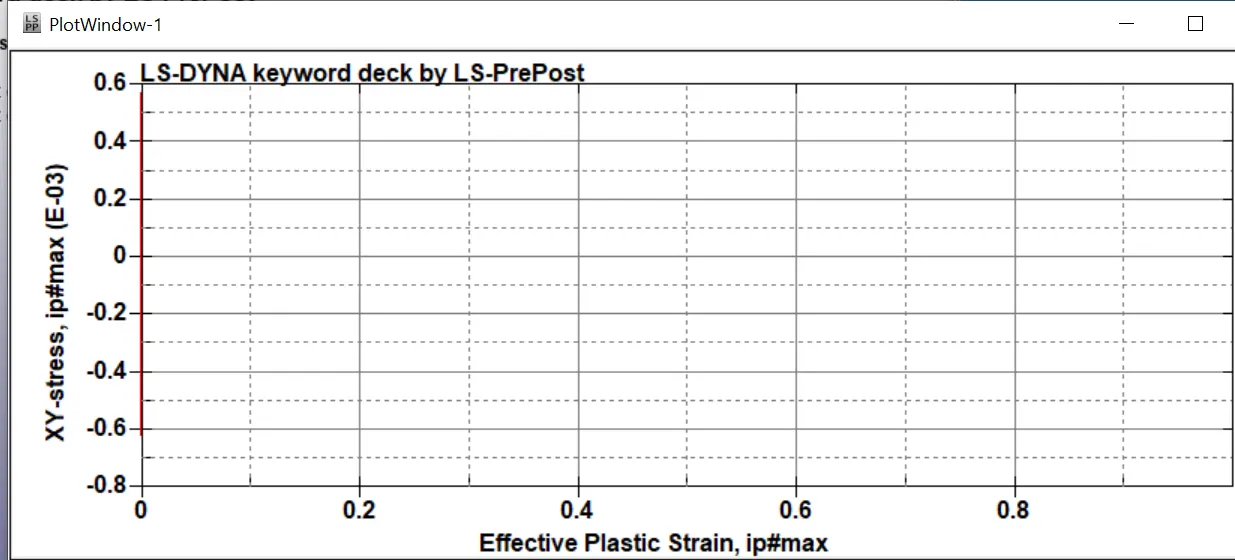
- Once the simulation went through, the stress and strain value are calculated and plotted.
IMAGES AND GRAPH:
Fit Curve
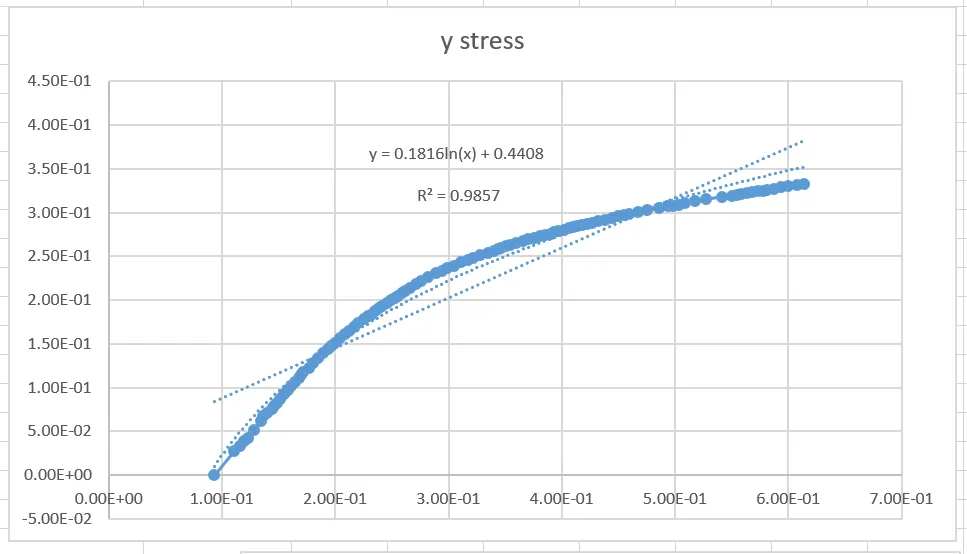
STRESS - STRAIN curve extracted from the graph
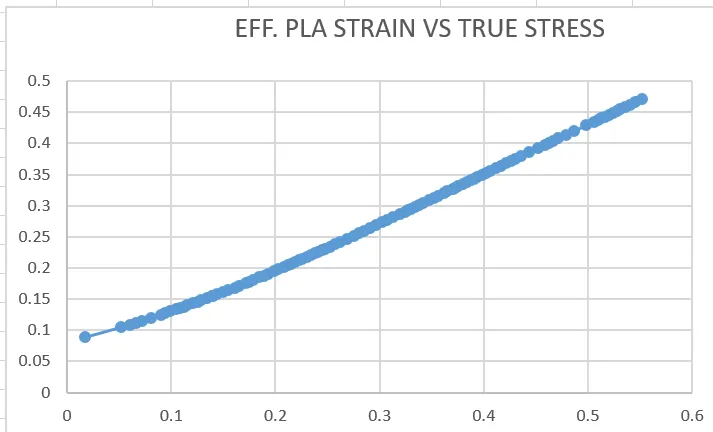
This effective plastic strain value and Von-Mises stress curve is plotted in load defining curve and the simulation has been run.
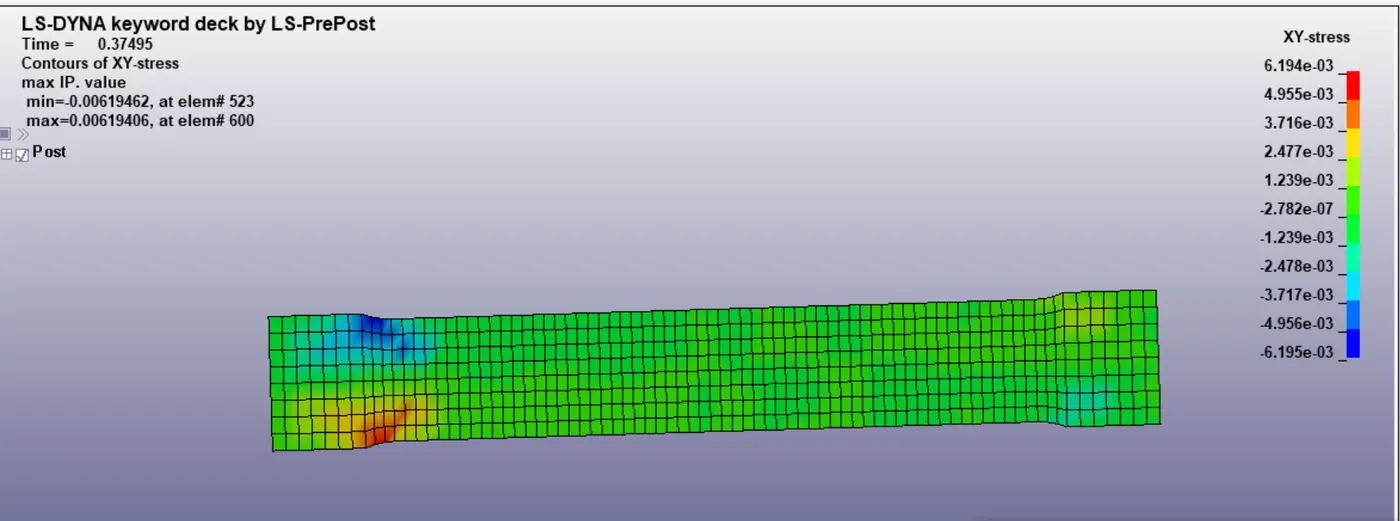
As there was no change in length, strain value is constant through out the simulation.