Week 9 Challenge
This challenge is to design the energy management strategy model with battery, ultracapacitor and fuel cell for positive power and to distribute the power demand among these components.
Energy management System:
Energy management strategies are the algorithms that decide the power split between engine and motor in order to improve the fuel economy and optimize the performance of HEV’s. Here in this we are considering the Energy management flowchart to know the power distribution among the battery, ultracapacitor and fuel cell acoording to their respective SOC.
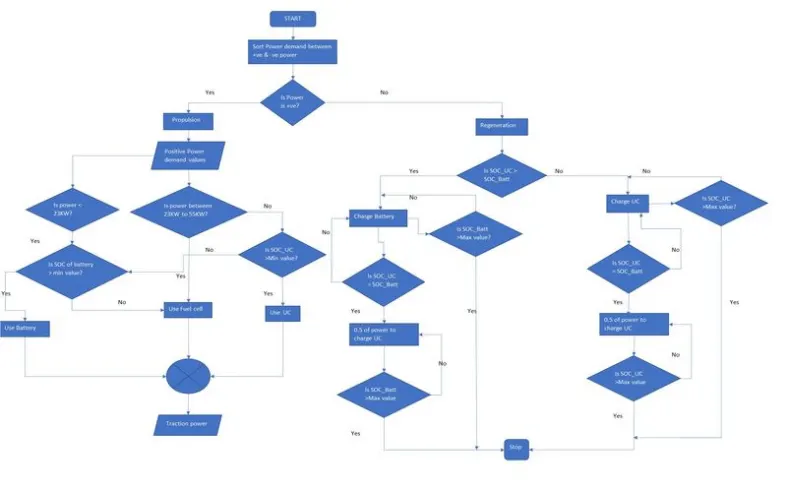
And also some assumptions and values are taken for different parameters as follows.
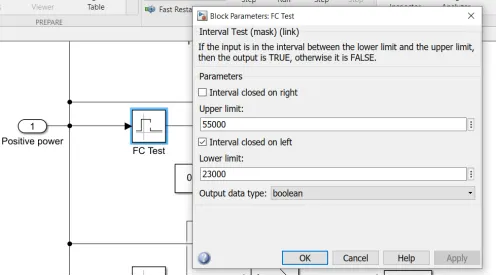
- From the polarization curve the operating range for the fuel cell is derived as 23kW to 55kW.
- The active area of fuel cell is 420cm^2.
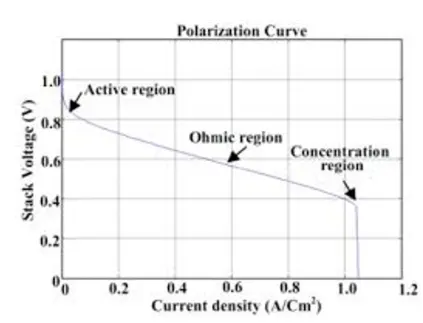
- The operating rangeof current density is in between 24A/cm^2 and 0.76A/cm^2.
- And the average voltage of each cell is 0.6V.
Let us assume
380 cells are used in series,
then total voltage is 380*0.6 = 228V.
Lower limit of current = active area * lower current density = 420*0.24 = 100.8A
Upper limit of current = active area * upper current density = 420*0.76 = 319A
Lower power limit = voltage * lower limit of current = 228*100.8 = 22.9kW
Upper power limit = voltage * upper limit of current = 228*319 = 72.7kW
By considering the above flowchart and the assumptions the Energy management system model is created in matlab/simulink. As per the question only the positive power reults are considered here in this model.
Matlab model:
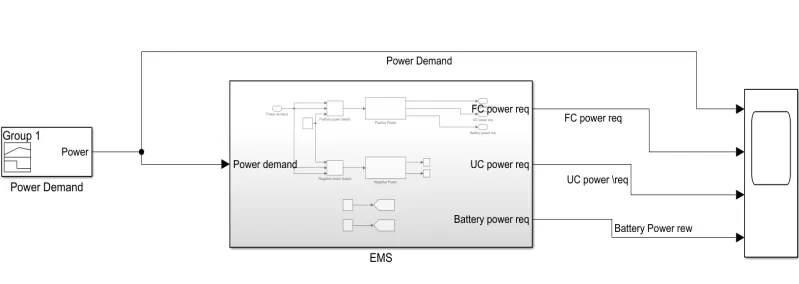
The input to this model is taken as Power demand which is given with the help of a signal builder by considering the acceleration and braking conditions. And the output observed are Battery,UC,Fuel cell power respectively.
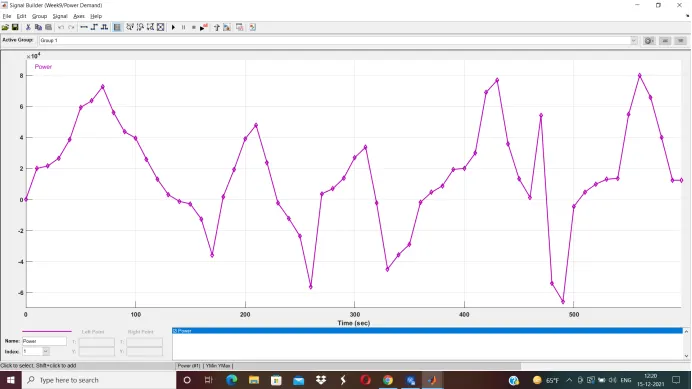
This is the input which is imported to the signal builder which is power vs time plot.
Energy Management Subsystem:
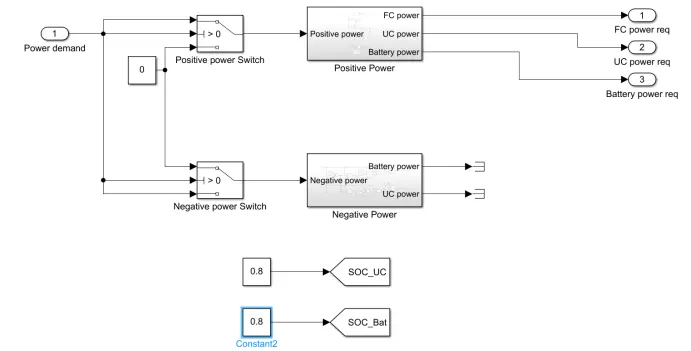
In the EMS subsystem we can observe that the power demand taken is checked for positive and negative power as shown using switch blocks. As in this challenge it is asked for results of Positive power so only we look into the positive power subsystem.
Positive Power Subsystem:
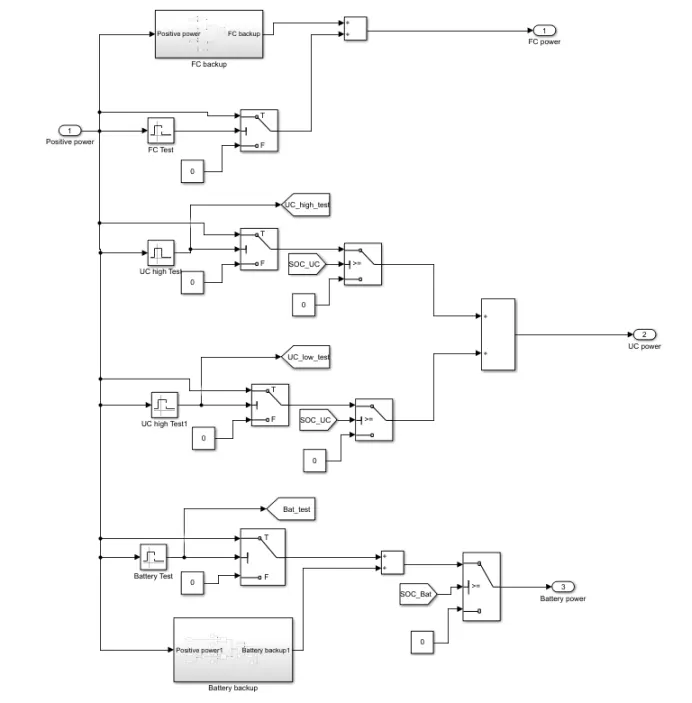
In this subsystem we can observe that the given power demand is tested for 4 conditions I.e.,
If
- power is in between 23KW to 55KW for Fuel cell.
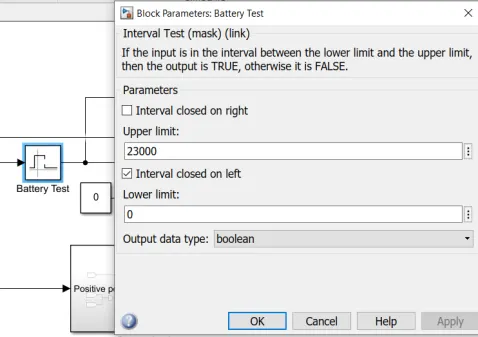
- power is less than 23KW for Battery.
- Power is less than 23KW and greater than 55KW for ultracapacitor using Interval Test block.
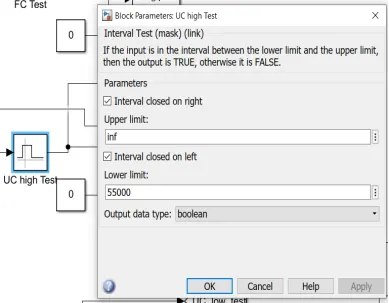
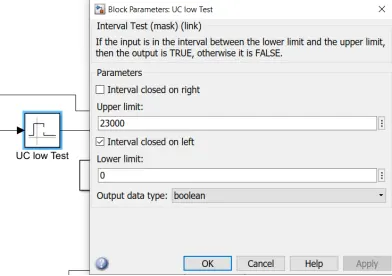
If the conditons are checked true then the power demand is passed through the respective switch blocks of each of the type. if false 0 is passed.
For UC and battery if they are true then they are checked for if SOC of Battery and UC are greater than the minimum value of SOC. Then they are taken as output.
Here we can also observe the FC backup and Battery backup subsystem.
Battery backup subsystem:
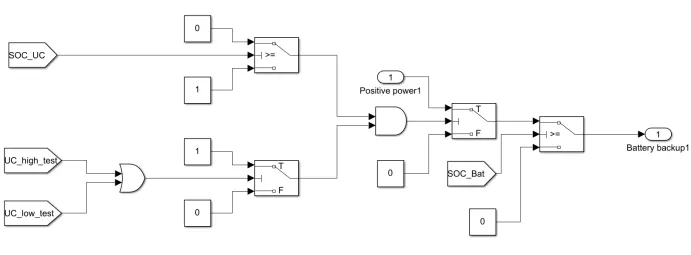
If the power demand is low i.e., in our case if it is less than 23kW and if SOC is greater than minimum value of battery then this power has to be delivered by battery.
FC backup subsystem:
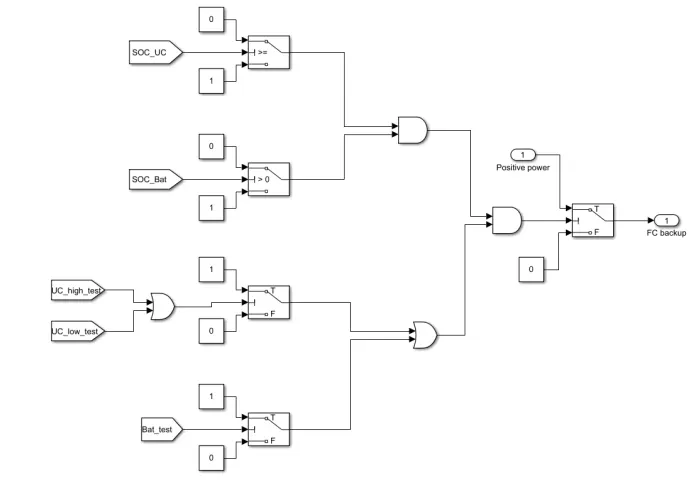
Here in the above initially it is checked for whether the SOC of UC and battery are greater than minimum value.
If greater than SOC minimum values then no need of backup power.
If the both the SOC’s are not greater than the minimum value then the 1 is passed through the switch block to AND block which results in 1 as output from AND.
Then the power ranges of the UC and battery are checked respectively and these outputs are given to OR block which means that output is 1 for any one condition is true.
Then if output from the AND block is true I.e., 1 then the Fuel cell backup power is given here to the switch.
Then the Fuel cell power and the Fuel cell backup power are added and given as ouput.
The battery power and battery backup are added as the output.
SOC values:
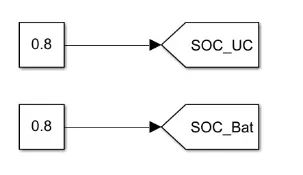
The SOC values of the Ultracapacitor and the battery are taken here to check for different SOC conditions.
Results:
If SOC of battery and UC are greater than the minimum value I.e.,
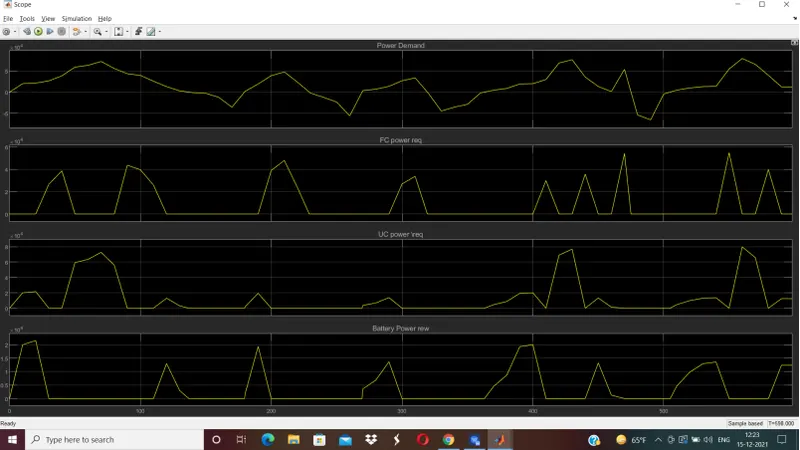
From the above plots we can understand that according to the power demand values for the Positive power the power request are shared to different sources as UC Power,Battery Power and FC Power based on their operating regions.
We can see from the plot that the obtained results are completely positive as only positive power is considered here so there is no regenerative braking here or charging of battery or UC.
The power demand above 23KW is acheived by Fuel cell, above 55 KW is acheived by Ultracapacitor and 0-23KW from Battery source as seen from plots.
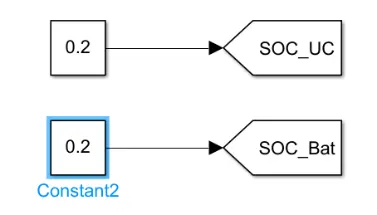
If SOC of battery and UC are lesser than the minimum value I.e.,
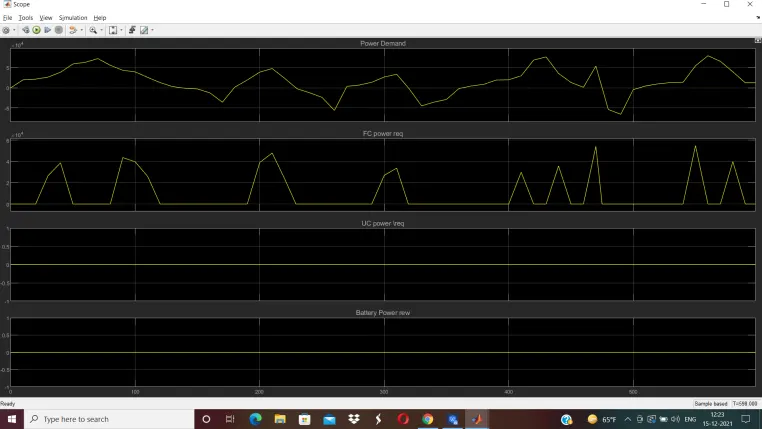
From the plot we can observe that the UC and battery power are 0 as they does’nt have the minimum SOC and here FC backup power is used.