Week-3 Challenge: ADVISOR Tool
ADVISOR Tool:
- Advisor tool is a set of model data and script text files use with Matlab and Simulink.
- It is used for rapid analysis of performance and fuel economy of vehicle.
- It provides detailed information of simulation of user defined drive train components and also provides flexibility of modeling.
- It consists of 3 main features for smulation i.e., Vehicle Input page, Simulaton setup page, Result page.
1.
For EV_defaults_in file, if cargo mass is 500 kg with all other default conditions, can the vehicle travel for 45 km with FTP drive cycle
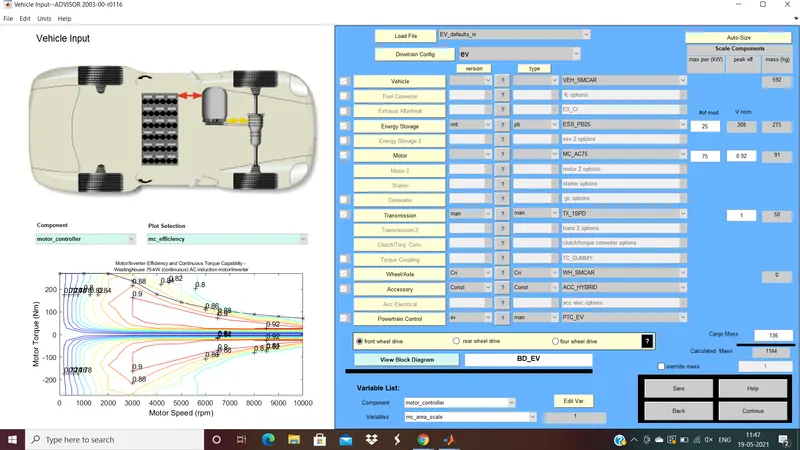
The EV Default vehicle is a pure electric vehicle which is completely driven by battery source. The below figure is the Advisor vehicle input screen which consists of Graphical representation of vehicle on one side and on the right-hand side of the screen, the user specifies what he wants to see and do to the vehicle and controls the next action for ADVISOR to take.
Step1:
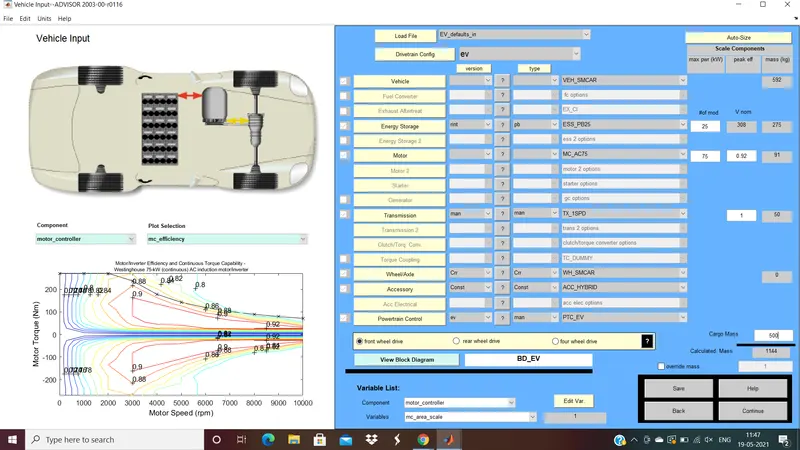
So, as mentioned to change the cargo mass to 500 kg with all other default conditions.
Step2:
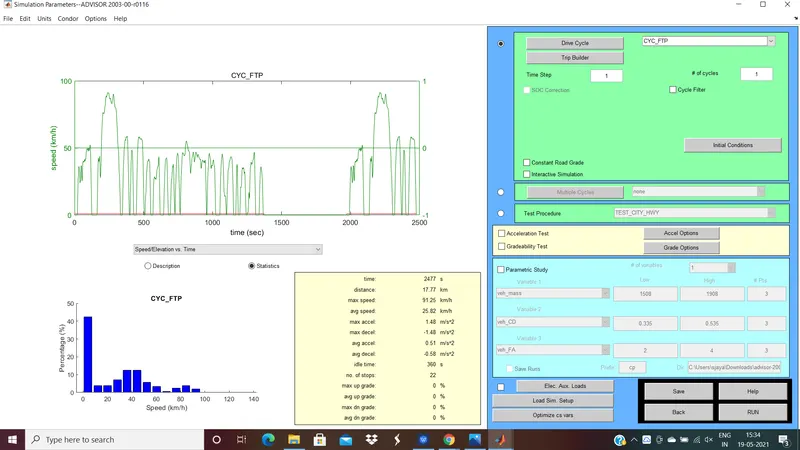
Then in the Simulation Setup page, choose the FTP(Federal Test Procedure) and run the simulation for 1 cycle.
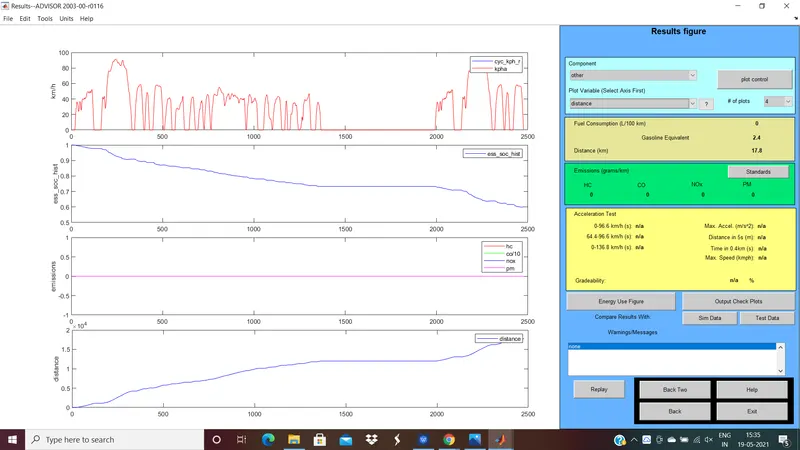
The 4 Plots indicate the plot of drive cycle in kmph with time, SOC, Emission and Distance travelled by vehicle.
The distance travelled observed is 17.77km and used almost 40% of SOC.
Step3:
Checking no. Of cycles to reach 45 Km distance with sufficient SOC
For 2 cycles:
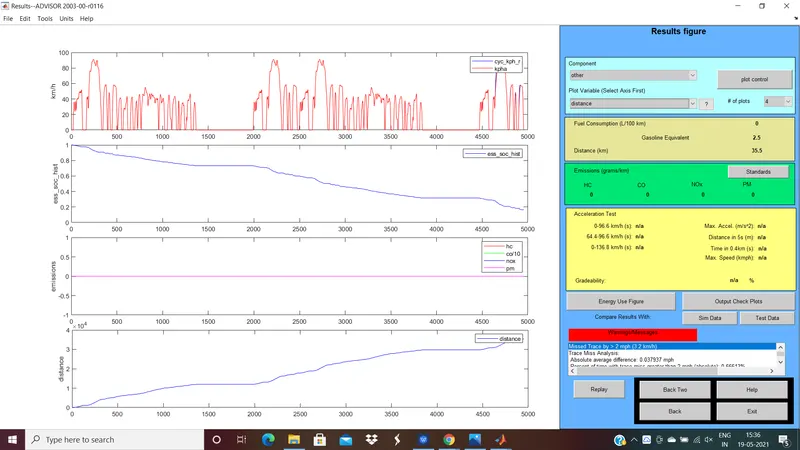
The distance travelled by vehicle is 35.5 km for 81% of SOC
For 3 cycles:
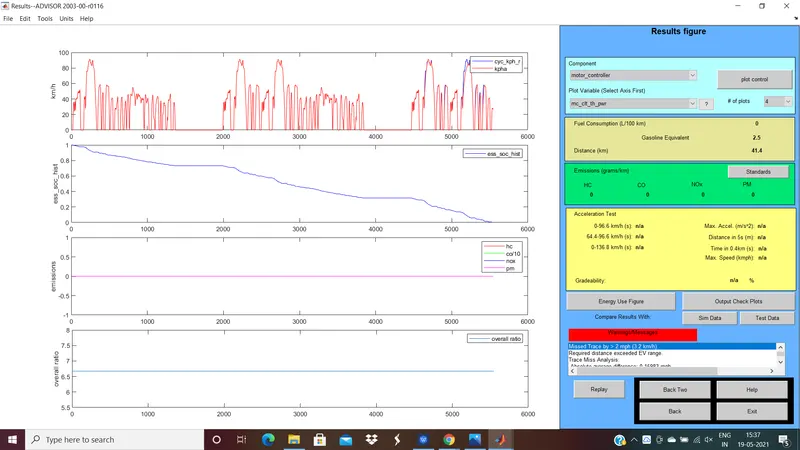
The distance travelled by vehicle is 41.4 km for 100% of SOC
Conclusion:
| S.no. | No. of Cycles | Distance Travelled(km) | SOC |
| 1 | 1 | 17.77 | 40 |
| 2 | 2 | 35.5 | 81 |
| 3 | 3 | 41.4 | 100 |
Thus, we from the table we observe that the minimum distance travel for 1 cycle is 17.8km and maximum distance travelled is 41.4 km for 3 cycles by comsuming 100% of battery. As clearly observed that the distance travelled is less than 45km due to insufficient SOC. Therefore the EV_default_in with cargo weight of 500kg cannot travel 45km.
2.
In the above case, try changing the battery capacity and repeat the simulation.
From the previous simulations of the above case as it observed that the maximum speed is being observed in 3rd cycle so let us consider a stepwise increase in battery modules from the default number in 3 drive cycles.
For 26 Modules and 3 drive cycles:
Change the value of #of mod to 26 and Run for 3 drive cycles.
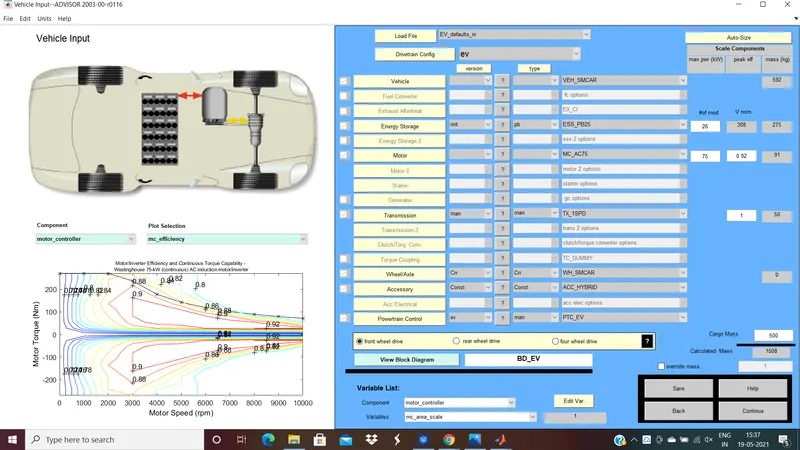
Result:
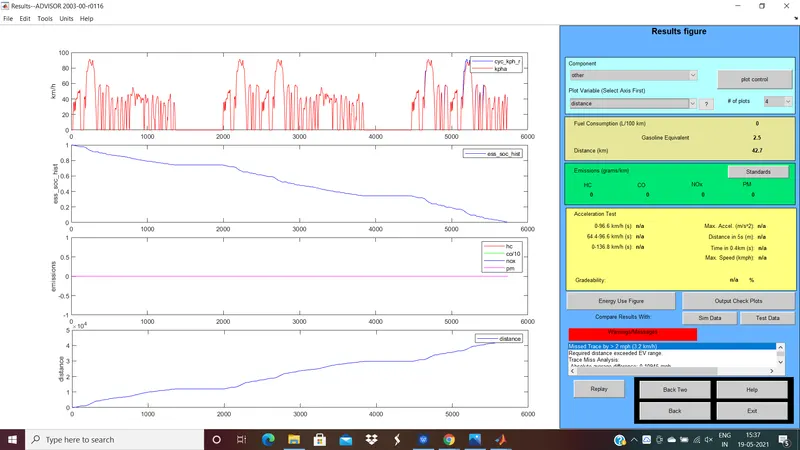
By increase in one module it is observed that there is increase in distance travelled i.e., 42.7 km which is more than the previous one. But as it still not reached the required distance of 45km there is a further increase in battery modules.
For 27 Modules and 3 drive cycles:
Change the value of #of mod to 27 and Run for 3 drive cycles.
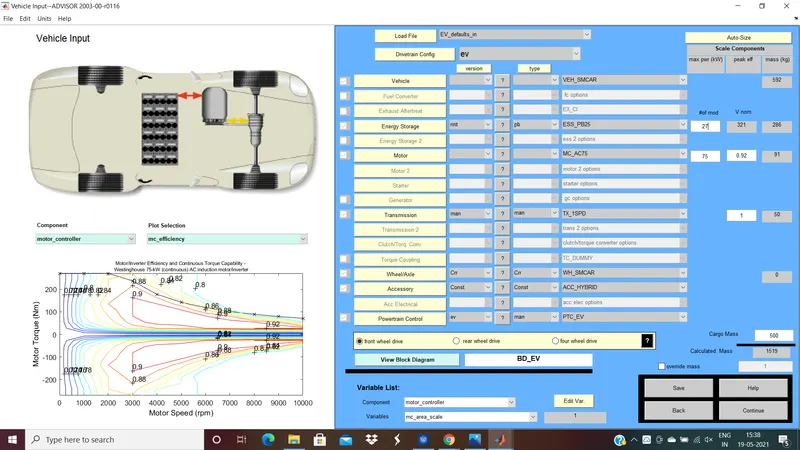
Result:
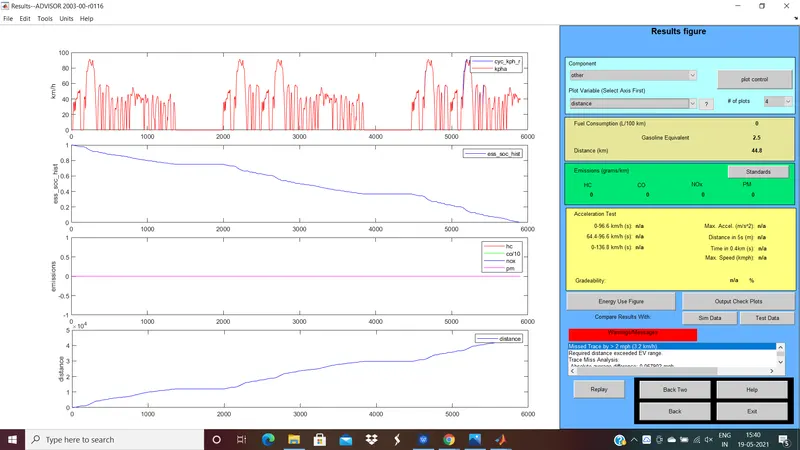
For 27 modules it is observed that there is increase in distance travelled to 44.8 km but as it still not reached the required distance of 45km there is a further increase in battery modules.
For 28 Modules and 3 drive cycles:
Change the value of #of mod to 28 and Run for 3 drive cycles.
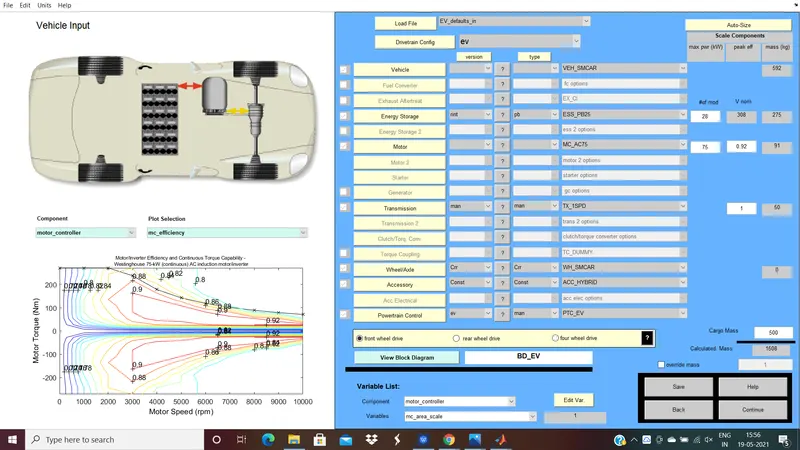
Result:
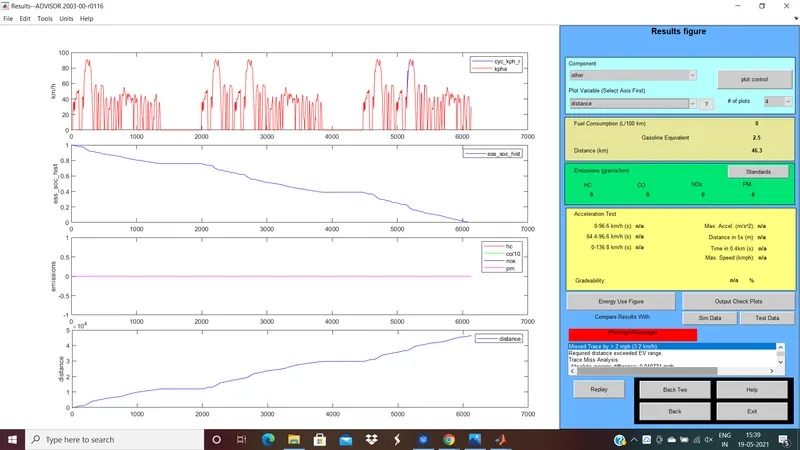
For 28 modules it is observed that the distance travelled by vehicle is 46.3km and thus it reached the required distance to be travelled of 45km.
Conclusion:
| s.no. | No. of modules | Distance Travelled(km) |
| 1 | 25(initially) | 41.4 |
| 2 | 26 | 42.7 |
| 3 | 27 | 44.8 |
| 4 | 28 | 46.3 |
From the table it is observed that the as the no. of modules increases the distance travelled by vehicle increases. And also obseerved that the vehicle requires 28 battery module battery to cover a distance of 45km.
3.
Perform gradeability test with PRIUS_Jpn_defaults_in file
Step1:
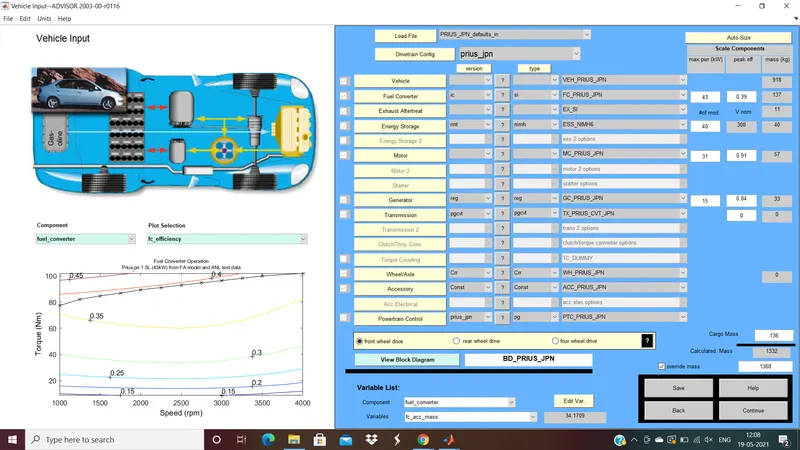
Change the Vehicle model to PRIUS_Jpn_defaults_in in vehicle input page and continue.
Step2:
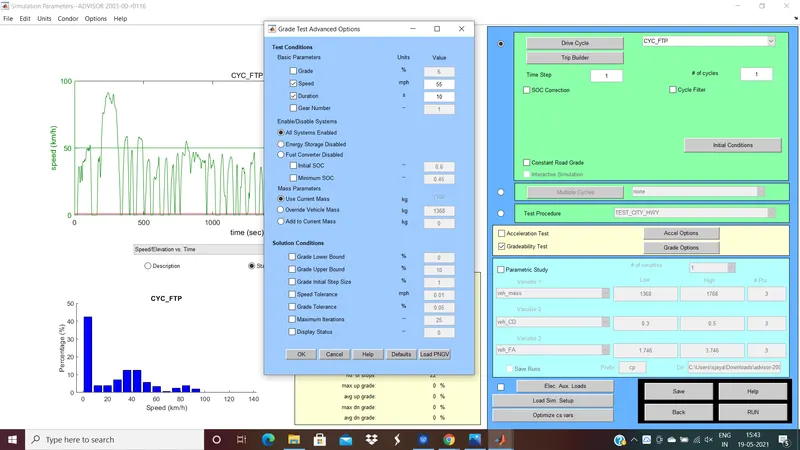
In Simulation Setup page select Gradiability Test and open Grade option box.
Then Change the speed and Run the simulation.
Step 3:
Run the Simulation for different speeds and observe the gradiabilty.
For 55 mph:
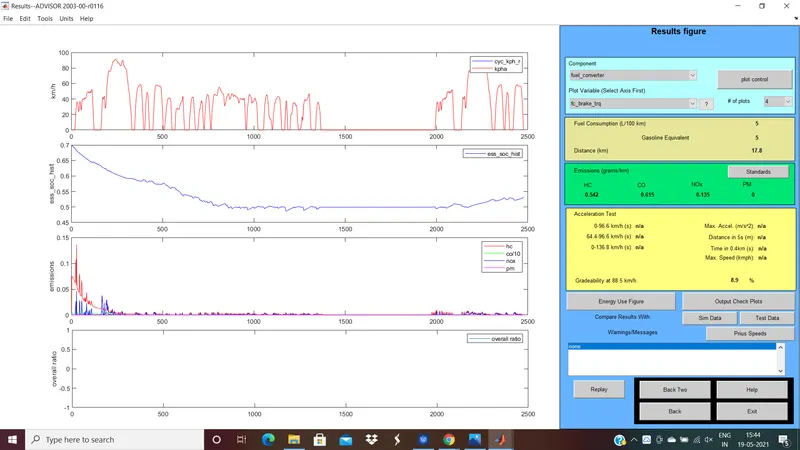
We can observe Gradiabilty=8.9%
For 65 mph:
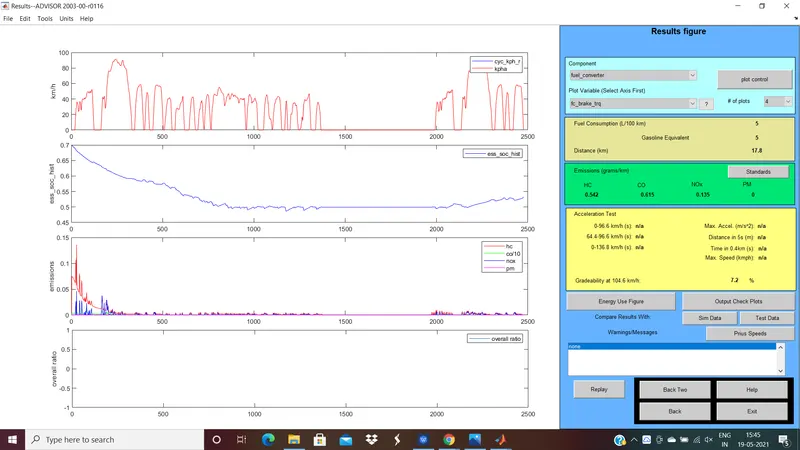
We can observe Gradiabilty=7.2%
For 75 mph:
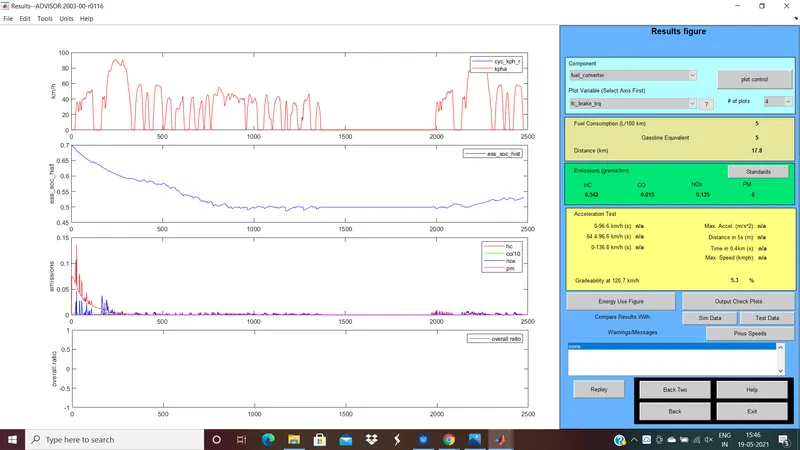
We can observe Gradiabilty=5.3%
For 85 mph:
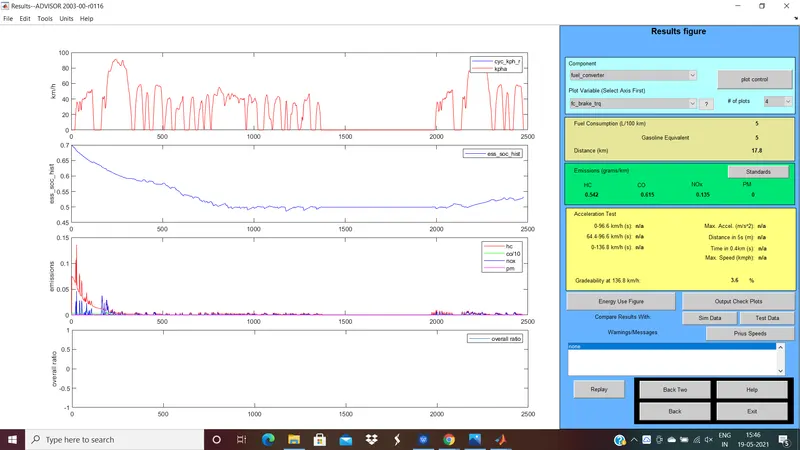
We can observe Gradiabilty= 3.6%
Conclusion:
| s.no | Speed(mph) | Gradiability(%) |
| 1 | 55 | 8.9 |
| 2 | 65 | 7.2 |
| 3 | 75 | 5.3 |
| 4 | 85 | 3.6 |
| 5 | 95 | 2 |
From the table it is observed that when the vehicle speed increased the gradiabilty value decreased.
Therefore Gradiabilty decreases with increase in vehicle speed.