Week - 4
1. Washing Machine with state flow model.
As given in question that washing machine 5 stages like adding water, soaking,washing, rinsing,dryer with a power supply.
According to the given conditions a chart is prepared in state flow model in which the power supply and the water supply will be input given and the output will be consisting of the indications whether the power, water, soaking, washing, rinsing, drying conditions are happening. And for knowing the conditions display are taken if 0 is displayed no work happened or if 1 is displayed it means work happened. The state flow model is attached below.
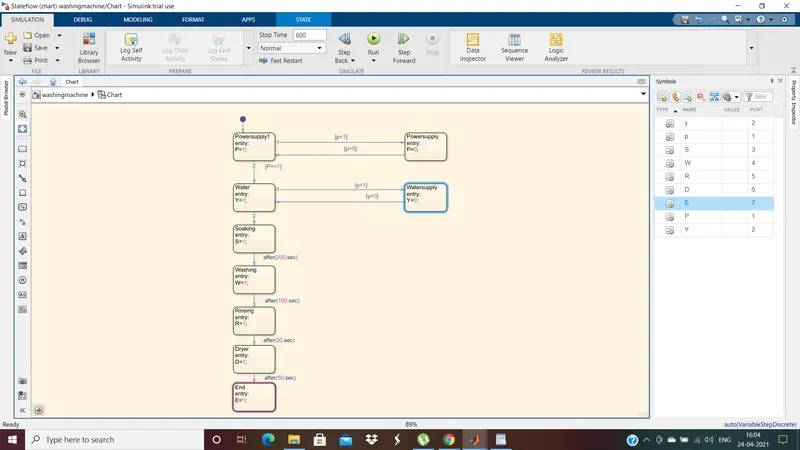
Then after making chart with given conditions the variables i,e., input, output variables are assigned in the Symbol Pane in state flow chart.
Lamps are taken for the input to know whether the power and water supply are happening according to the input condition given, if 0 red and 1 green will glown.
Results:
Results of Different cases are considered according to the inputs given:
Case1: When both Power and water supply are 0:
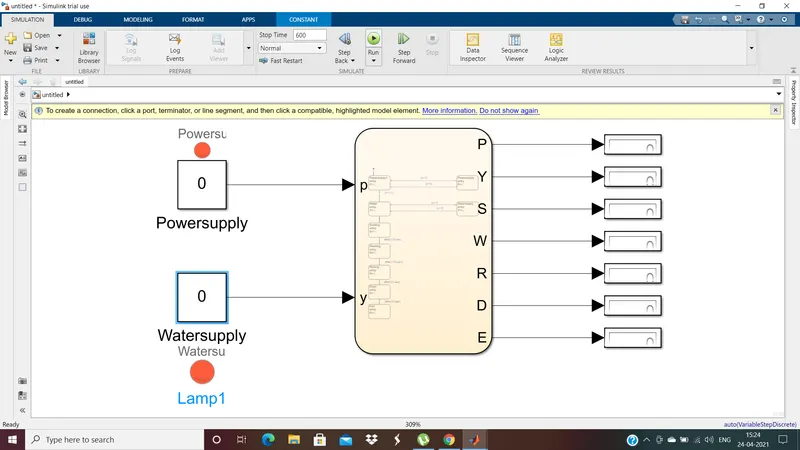
From the above fig we can observe that the all the outputs are displayed as 0 as there is no power and water supply. And we can see the lamps were Red.
Case2: When Power 0 and water supply are 1:
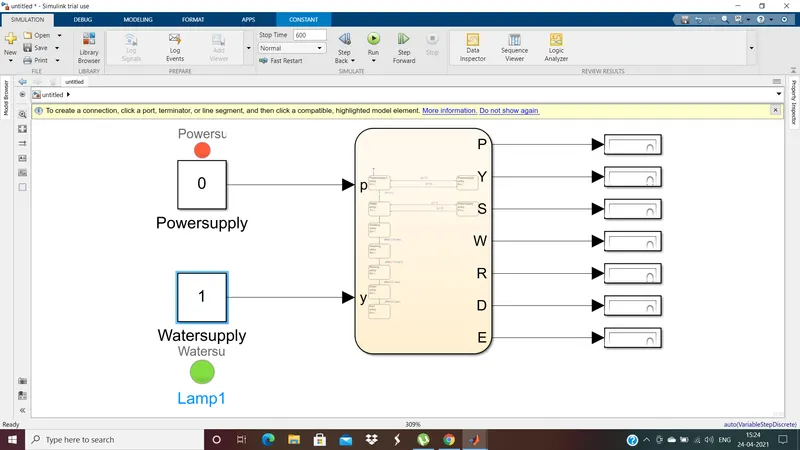
From the above fig we can observe that the all outputs are displayed as 0 as there is no power supply even the water supply is ON. And we can see that power lamp was Red & water lamp was Green.
Case3: When Power 1 and water supply are 0:
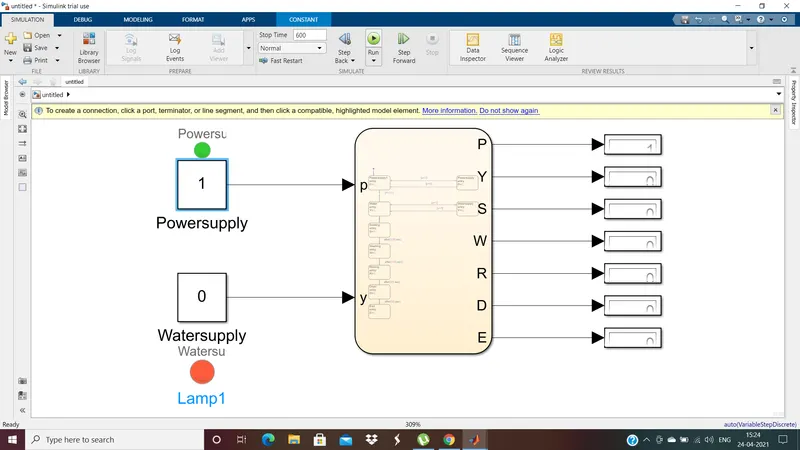
From the above fig we can observe that the expect power all the other outputs are displayed as 0 as there is no water supply.And we can see that water lamp was Red & power lamp was Green.
Case4: When both Power and water supply are 1:
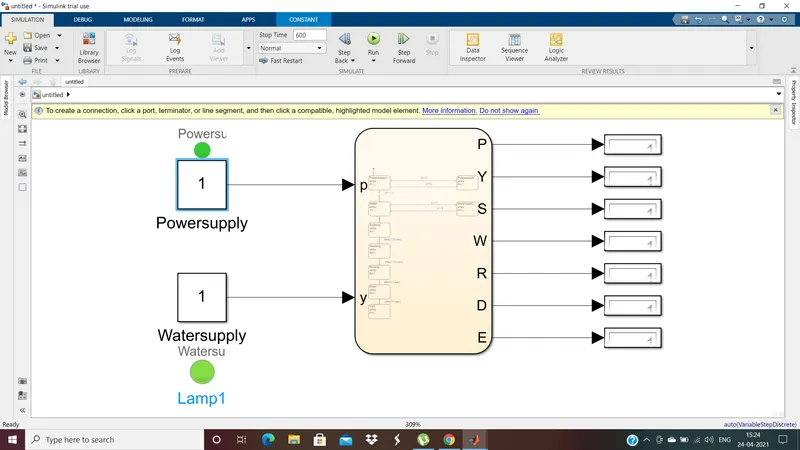
From the above fig we can observe that the all the outputs are displayed as 1 as there is power and water supply.And we can see that power & water lamp were Green.
This is how washing machine can be designed in a state flow model.
2. Gear Shift in state flow
According to the given conditions the state flow chart of a gear shift is designed as attached below.
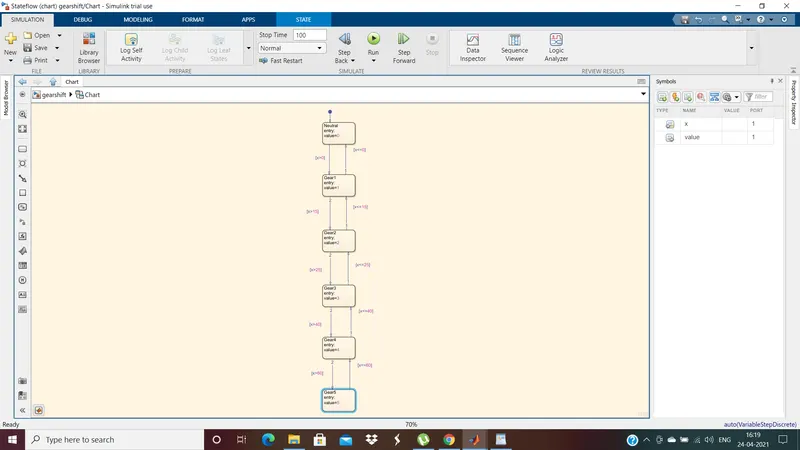
We can observe that in the chart there are different conditions to change the gear for different speed as mentioned. Here speed is taken as the input and the gear value is taken as the output.
And outside the chart a constant and a slider gain to give the speed while the simulation is running and that is the reason a Slider Gain has been taken. A display block is given to output to kmow the gear value to that speed.
Results:
Results of different cases are considered
Case1:When constant i.e, power and Slider gain are 0:
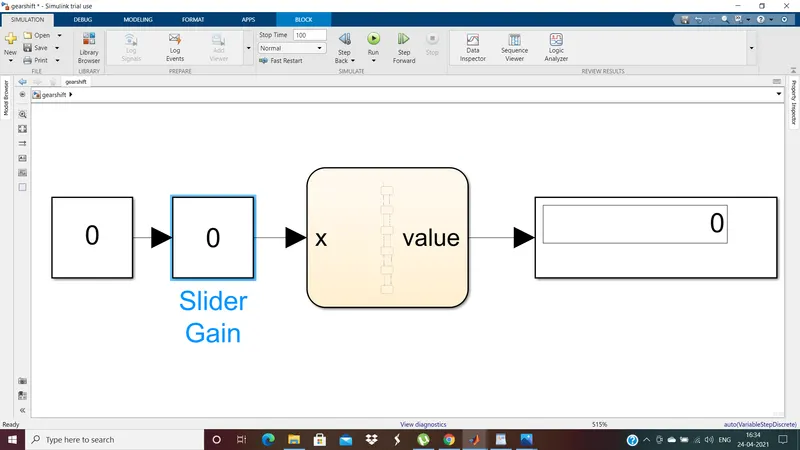
From the above attachment we can observe that as the power is 0 the vehicle is in rest and the speed is 0 and the gear value is also 0.
Case2:When constant i.e, power is 1 and Slider gain is any value:
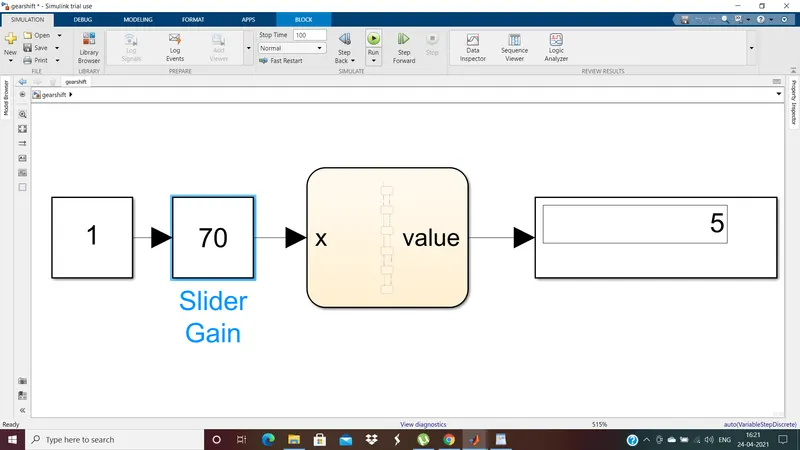
From the above attachment we can observe that as the power is 1 the vehicle will start and the speed is changed with slider gain and given as 70 and the gear value is 5 according to the condition.
This is how gear shift works.