Week-4 Challenge WOT Condition Part-2
1.
Mapped Model:
- Mapped models consists of data that is prebuilt in the lookup tables and has no real time considerations.
- Mapped engines represent macro engine behavior as a set of lookup tables (brake torque, fuel flow, air mass flow, exhaust temperature, efficiency, and emissions) as functions of commanded load and measured engine speed.
- Mapped engine models are suitable for analysis and design activities that do not require engine subsystem dynamic characteristics.
- The simulation time is less as it run without realtime considerations.
Dynamic Model:
- Dynamic model does not consist of any predefined values but it takes the real time values by combining outputs of various subsystems and fed it as an input which changes according to the feedback of the system.
- This break downengine behavior into individual component models that account for engine dynamics.
- Dynamic engine models are suitable for designing control, estimator, and diagnostic algorithms that depend on dynamic subsystem states.
- The simulation time of this model takes longer time as there are many individual simulations.
To change Mapped to dynamic (or) Dynamic to mapped model:
- Open a vehicle model in powertrain blockset.
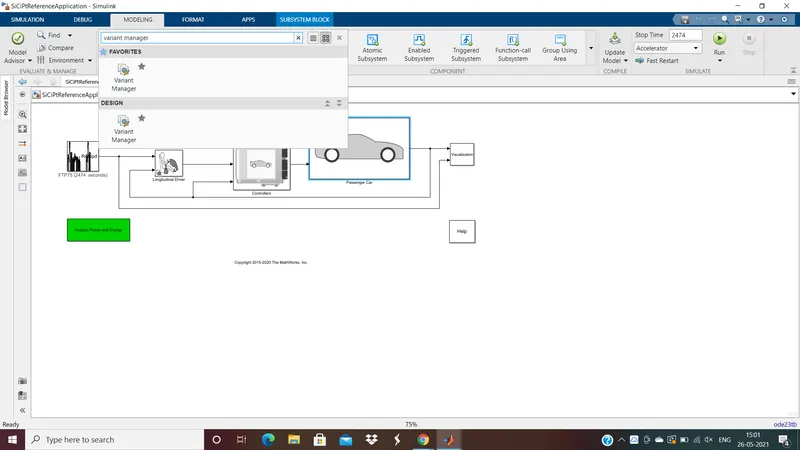
- Then in modelling tab open Varint Manager tab as shown.
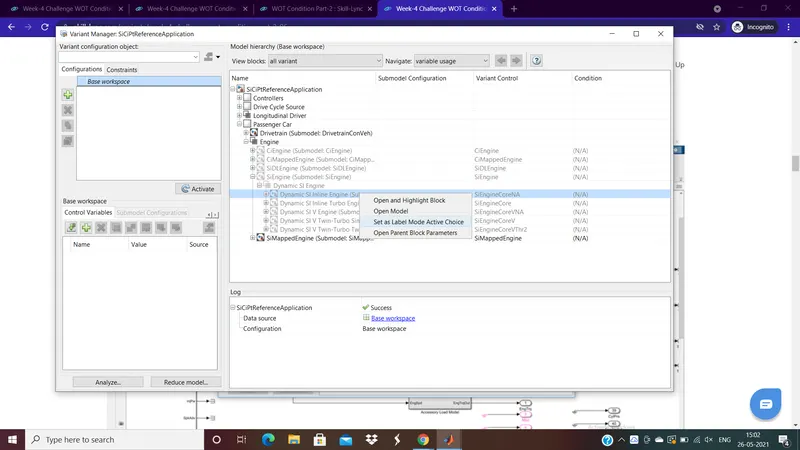
- Then choose the desired model type and right click & select Label Mode Active Choice.
- This is the process to change the model type.
2.
Model Calculations of Miles per Gallon:
MPG is used for an indication of fuel economy of vehicle i.e., it shows how far a vehicle travels for every gallon of fuel it uses.
Here in the reference model taken is HEV in which the MPG calculation consists of both the fuel efficiency of gasoline and electric power. Mainly to calculate MPG of a vehicle fuel flow, vehicle speed and battery power are considered.
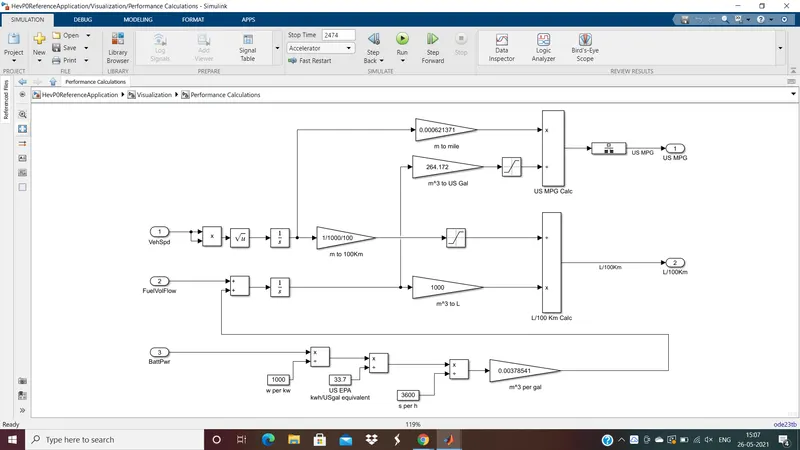
Battery power conversions:
- Firstly Battery power in Watts is divided by 1000 to get Kilo Watts(KW).
- It is then converted to KWh/US gallon by dividing with 33.7 (because 7 kWh is the battery power required to get the energy equivalent to energy which is obtained by consuming 1 gallon of gasoline) and further divided by 3600 to convert into kilo watt per sec.
- It is then mutliplied with 0.00378541 to convert in m^3 / Gallons and added to fuel flow.
Fuel Flow:
- The fuel flow and battery power are added and multiplied by 264.172 to convert m^3 to US Gallon.
Vehicle Speed:
- Vehicle speed is integrated to get the distance but the distance obtained is in meters.
- To convert it into miles it is multiplied by 0.000621371.
Now by dividing Miles with Gallons we get MPG i.e., Vehicle speed/(Fuel flow+ battery).
This calculations of MPG in vehicle.
Factors considered for model Fuel Flow:
According to the model and above calculations the factors that are considered for the model Fuel flow are
- Vehicle speed
- Battery power
- Fuel flow.
3.
HEV reference application with WOT drive cycle:
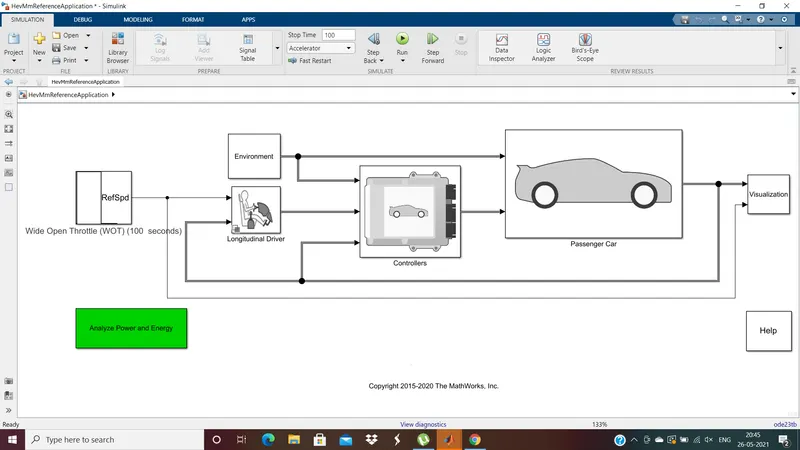
The above model is the HEV Mm reference application and the drive cycle is changed to WOT drive cycle. It consist of drive cycle, environment, longitudinal driver, Passenger car,controller sub systems.
Changing to WOT drivecycle
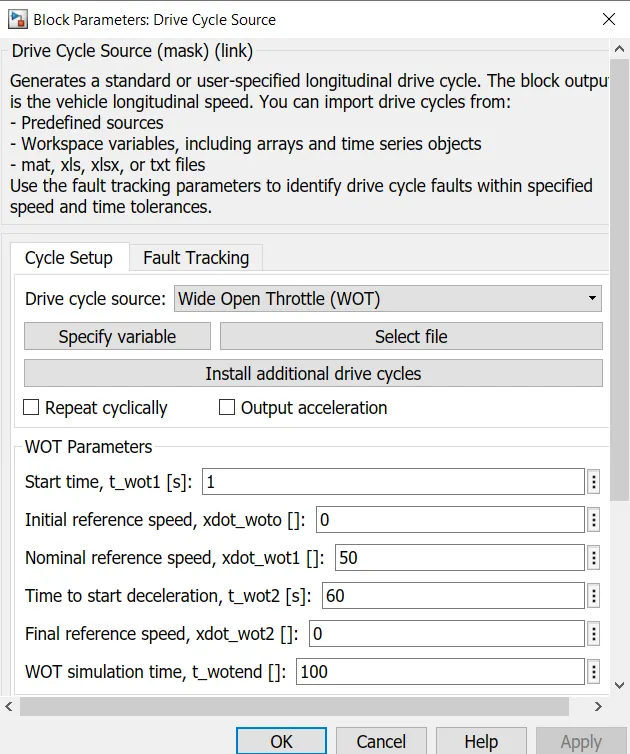
And in WOT drive cycle the nominal speed is maintained as 50m/s; deceleration time as 60 sec and total simulation time as 100sec.
Without change in Grade and Wind velocity:
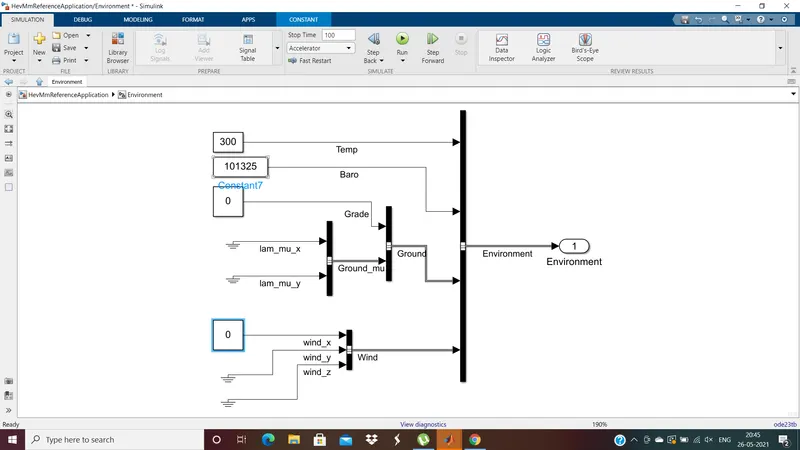
The Grade and wind velocity are maintained unchanged in the environment block i.e., they are maintained as 0 degeree and 0 m/s.
Results:
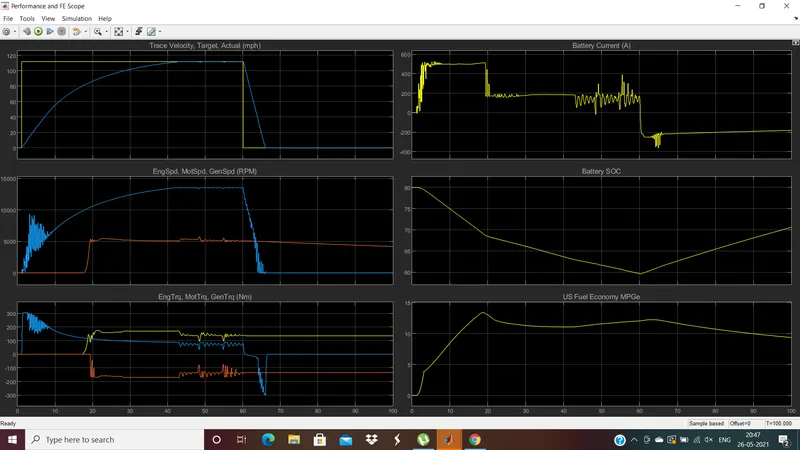
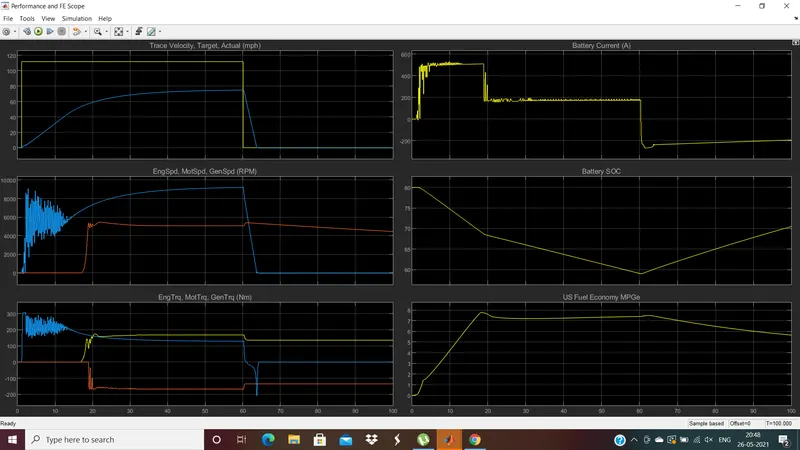
From the graph it is observed that it consists of 6 plots representing Trace velocity, speed, torque,battery current, SOC, Fuel economy MPGe.
Target vs Actual velocity:
In this yellow line is the target plot and the blue is the actual plot for velocity. We can observe that the actual plot has taken nearly 40sec to reach the target velocity of 110mph . And also the deceleratin has also taken 5 sec to reach 0m/s.
Engine, motor , generator speed:
Initially the vehicle runs with the help of motor then reaches the maximum speed of 14000rpm with motor only and that time there is no need of engine & generator. But after a while the battery discharges. But when SOC reaches below 70% then engine starts and the motor speed gets decelerates. While engine is running the generator charges the batteries i.e., they both run at same speed and thus overlapped.
Engine, motor, generator torque:
As motor(blue) has high starting torque the vehicle acquires max speed with motor and then decelerates becomes negative . When SOC is below 70% engine torque(yellow) is used then battery get charged. The generator torque(orange) shows negative torque indicating it is charging the battery.
Battery current:
from this we can understand that whe the vehicle uses motor then battery current is utilized and when there is deceleraton the usage of battery is also decreased.
Battery SOC:
From the graph it is observed that when SOC is below 70% engine starts working and battery get charged at that time. It decreases till the motor completely decelerates and then increases i.e, charged because engine.
Fuel economy MPGe:
This shows the MPG equivalent that the vehicle require to run.
With Change in Grade and Wind velocity:
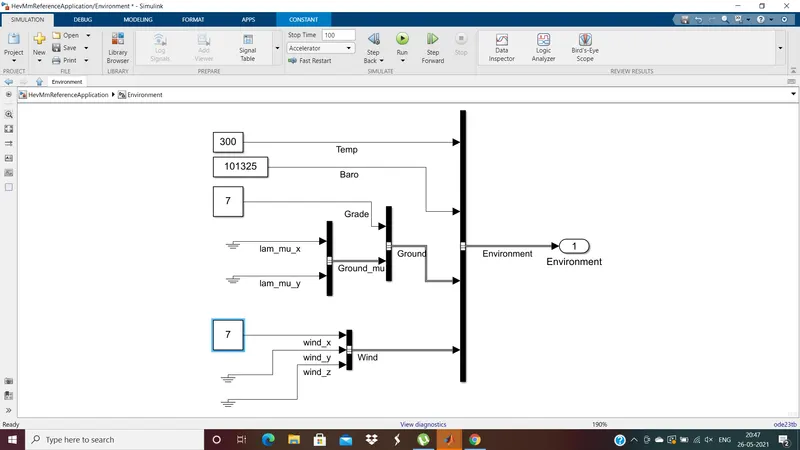
From the above figure we can observe that the grade and wind velocity in the environment block is changed to 7 degrees and 7 m/s. the WOT drive cycle parameters are maintained same.
Results:
Target vs Actual velocity:
When compared to the previous results it is observed the vehicle was to able to reach the target velocity because of grade and wind velocity. It is observed that the max velocity attained is 60mph.
Engine, motor , generator speed:
here when compared as characteristics are same but the max speed attained the motor is reduced to nearly 9000rpm because of the environmental conditions.
Engine, motor, generator torque:
There was no change in the torque characteristics when compared to the previous result.
And the remaining characteristics battery current, SOC, MPGe are alomost same with a slight difference when compared to the previous results.
4.
Compare HEV and EV powertrains
The only difference is that EV consist of only one source that is battery to run the motor whereas HEV has multiple sources like Engine, motor, battery pack.
To compare the characteristics of HEV and EV with all parameters same let us consider the characteristics of HEV with WOT drive cycle with no grade and wind velocity of previous result mentioned in above challenge.
HEV reference application with WOT drive cycle result:
EV reference application with WOT drive cycle:
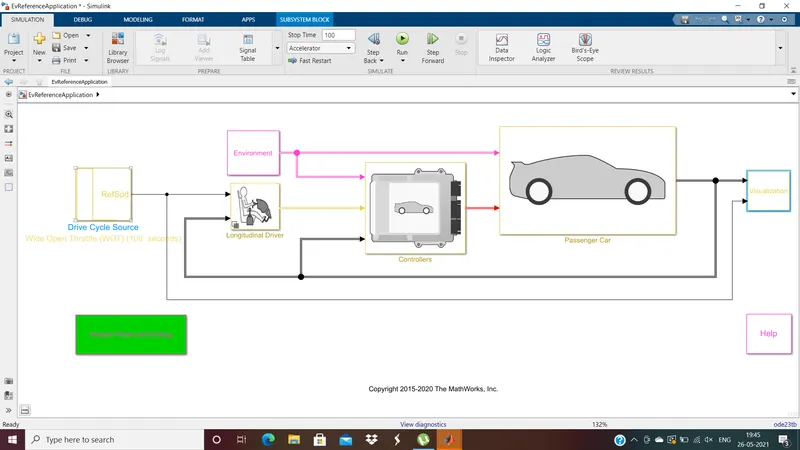
Changing the drive cycle to WOT and considering same parameters.
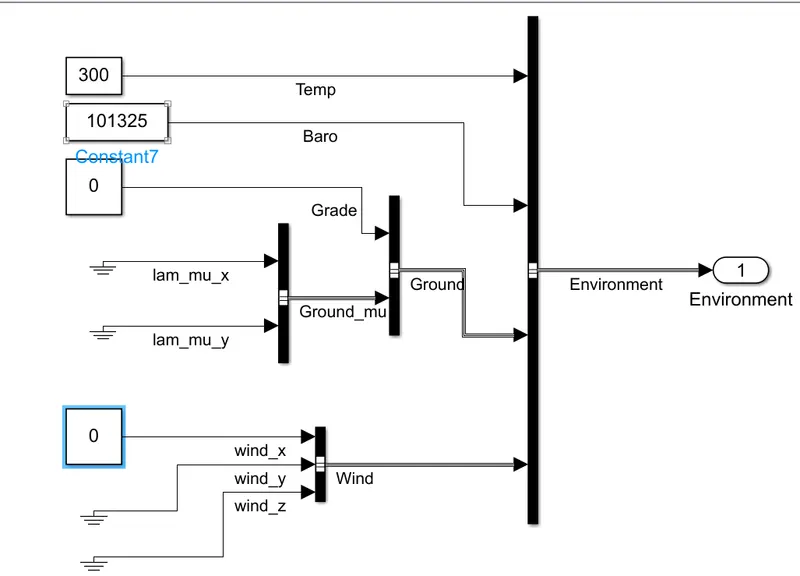
The grade and wind velocity are zero degrees and 0 m/s.
Result:
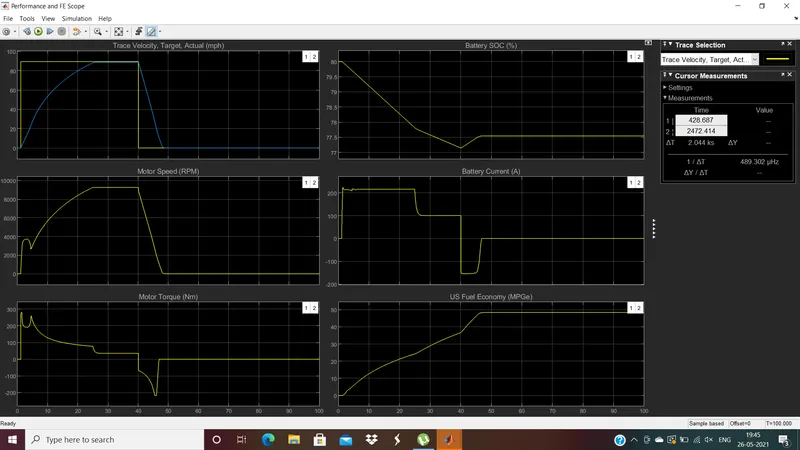
- When compared to HEV though the plot looks same but the velocity of pure EV is less and can attain only 90mph whereas HEV attains 110mph.
- The speed of the motor is nearly 9000rpm which is less then HEV with 14000 rpm nearly.
- The battery current in EV is half of HEV to produce power.
- Bacause of less battery current the battery drains slowly in EV than the HEV i.e., HEV battery drains faster then EV when compared.
- Motor torque is same for both cases.
- As less current is been drawn by the EV so the fuel economy is more in EV than in HEV.
Thus HEV and EV are compared considering same parameters.