Week 8 - Simulating Cyclone separator with Discrete Phase Modelling
Aim:-
To perform analysis on cyclone separator and calculate the separation efficiency and pressure drop.
Objective:-
- To write a few words about any four empirical models used to calculate the cyclone separator efficiency.
- To perform an analysis on a given cyclone separator model by varying the particle diameter from 1 μm to 5 μm and calculate the separation efficiency in each case. Discuss the results. [Use both the velocity's as 3m/sec.]
- To perform an analysis on a given cyclone separator model by varying the particle velocity from 1 m/sec to 5 m/sec and calculate the separation efficiency and pressure drop in each case. Discuss the results. [Use particle diameter size as 5 μm for all cases & keep flow velocity same as particle velocity]
Theory:
Introduction of Cyclone Separator with its Application:
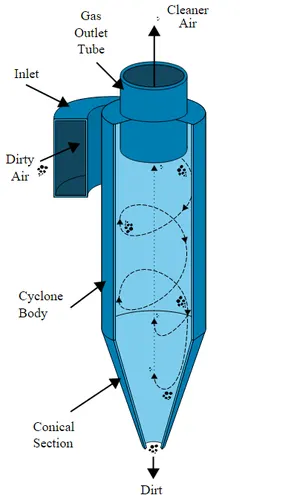
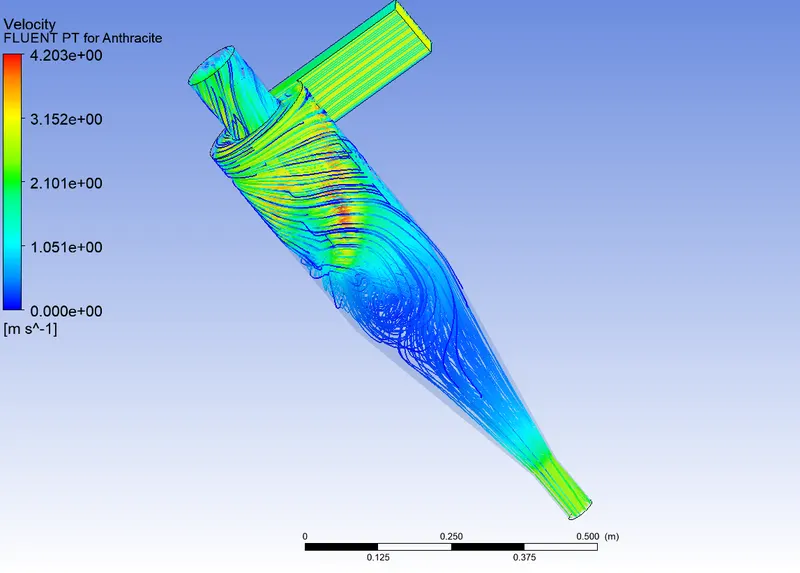
Cyclones are devices that employ a centrifugal force generated by a spinning gas stream to separate particles from the carrier gas. Their simple design, low capital cost, and nearly maintenance-free operation make them ideal for use as pre-cleaners for more expensive final control devices such as baghouses or electrostatic precipitators. Cyclones are particularly well suited for high temperature and pressure conditions because of their rugged design and flexible component materials. Cyclone collection efficiencies can reach 99% for particles bigger than 5 μm, and can be operated at very high dust loading. Cyclones are used for the removal of large particles for both air pollution control and process use. Application in extreme conditions includes the removal of coal dust in a power plant and the use as a spray dryer or gasification reactor. Engineers are generally interested in two parameters in order to carry out an assessment of the design and performance of a cyclone. These parameters are the collection efficiency of particle and pressure drop through the cyclone. An accurate prediction of cyclone efficiency is very important because inaccuracy in the efficiency prediction may result in an inefficient design of the cyclone separator. CFD has a great potential to predict the flow field characteristics and particle trajectories inside the cyclone as well as the pressure drop. The complicated swirling turbulent flow in a cyclone places great demands on the numerical techniques and the turbulence models employed in the CFD codes when modeling the cyclone pressure drop.
Some Industrial Applications are:
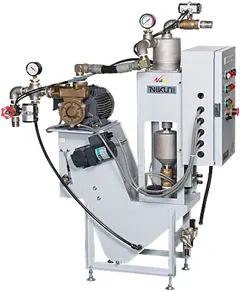
- MACHINING COOLANT FILTRATION
Remove fine shavings and abrasive powders/grains from machine tool coolant:
- INDUSTRIAL PROCESS WATER
Protect and extend the life of spray nozzles, sand filters, membrane filters, and other industrial equipment exposed to foreign contaminants.

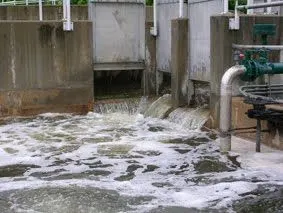
- WASTEWATER
Removes grit and particles from industrial wastewater or effluent treatment tanks.
- HIGH-PRESSURE WASHER CLEANING FLUID
Prevents foreign particles from circulating within cleaning liquids of high pressure and ultrasonic cleaning equipment
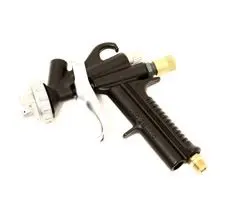
- LUBRICATING FLUID
Extend the life of lubricating fluids and corresponding equipment by removing grit and foreign particles.
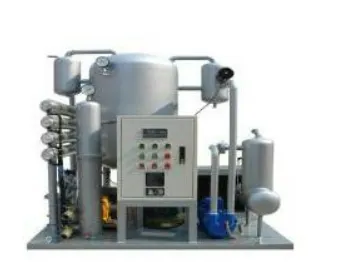
- Thermal Power Plant
Application in extreme conditions includes the removal of coal dust in a power plant and the use as a spray dryer or gasification reactor.
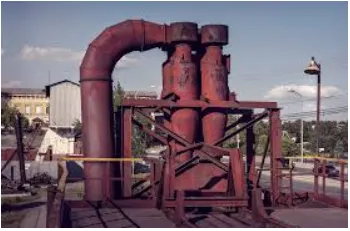
- Baghouse Dust Collector in Power plant
For controlling the emissions of air pollutants before mixing in the atmosphere.
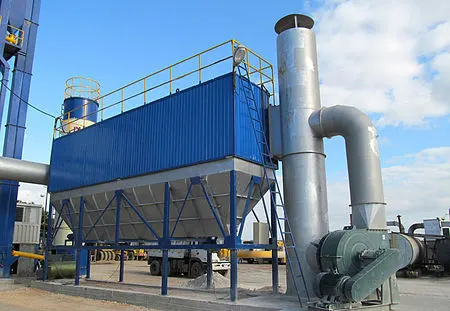
Cyclone performance :
Cyclones are basically centrifugal separators. They simply transform the inertia force of gas particle to a centrifugal force by means of a vortex generated in the cyclone body. The particle laden gas enters tangentially at the upper part and passes through the body describing the vortex. Particles are driven to the walls by centrifugal forces, losing its momentum and falling down to the cyclone leg. In the lower section, the gas begins to flow radially inwards to the axis and spins upwards to the gas outlet duct.
The Centrifugal force generates inside the cyclone is given by,
CF = rho_p*(d_p)^3*(v_p)^2/r
Rho_p = particle density, (kg/m3)
d_p = particle diameter, inches (μm)
v_p = particle tangential velocity (m/s)
r = radius of the circular path, (m)
The main variables describing the cyclone performance are pressure drop, efficiency and cut diameter.
Cut diameter
The cut diameter of the cyclone is defined as the size of the particles collected with 50% collection efficiency. It is an indicator of the size range of particles that can be collected. It is a convenient way of defining as it provides information on the effectiveness for a particle size range. A frequently used expression for cut off diameter is
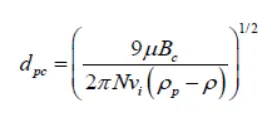
μ = viscosity (Pa.s);
Bc = inlet width (m);
N = effective number of turns (5-10 for common cyclone);
vi = inlet gas velocity (m/s);
ρp = particle density (kg/m3);
ρ = gas density (kg/m3)
A value of N, number of turns, must be known in order to solve equation for dpc. Given the volumetric flow rate, inlet velocity, and dimension of the cyclone, N can be easily calculated. Values of N can vary from 1 to 10, with typical values in the 4-5 range.
Collection efficiency
The collection or separation efficiency is most properly defined for a given particle size. As mentioned, fractional efficiency is defined as the fraction of particles of a given size collected in the cyclone, compared to those of that size going into the cyclone. Experience shows that collection efficiency of cyclone separator increases with increasing particle mean diameter and density; increasing gas tangential velocity; decreasing cyclone diameter; increasing cyclone length; extraction of gas along with solids through the cyclone legs. Several equations have been developed to predict the collection efficiency in cyclones through correlation equations. The following section describes two methods of calculating cyclone efficiency. First the theory proposed by Leith and Licht for calculating fractional efficiency will be discussed and then a convenient graphical method developed by Lappel will be presented. The fractional efficiency equation of Leith and Licht is given as:
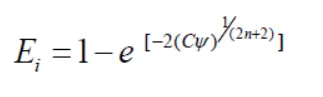
Where C = cyclone dimension factor; ψ = impaction parameter; n = vortex exponent
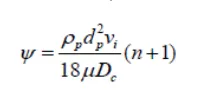
In this expression, c is a factor that is a function only of the cyclone’s dimensions. The symbol ψ expresses characteristics of the particles and gas and is known as inertia or impaction parameter. The value of n is dependent on the cyclone diameter and temperature of the gas stream. And ρp times vi expresses the particle’s initial momentum.
Pressure drop
Alternatively, it can be thought of as the amount of resistance the cyclone separator adds to the system flow. The pressure drop is a product of the gas flow rate, gas density and cyclone geometry. Pressure drop can be expressed as:
DR = Ra Inlet – Ra Outlet
Where:
DR = Cyclone Pressure Drop
Ra = Absolute Pressure
Factors affecting Cyclone Separator's Efficiency are:
There are several factors that can affect a cyclone separator's efficiency. These include particle density, particle size, volumetric flow rate, pressure drop, cone length, body length, a ratio of accept port to body diameter, and even the smoothness of the cyclone’s internal surfaces.
Four empirical models used to calculate the cyclone separator efficiency.
1)Iozia and Leith Model:
Iozia and Leith logistic model is a modified version of Barth Model, which is developed based on force balance. The model assumes that a particle carried by the vortex endures the influence of two forces: a centrifugal force, Z and a flow resistance, W. The collection efficiency E of particle diameter dpi can be calculated from
E =1/(1 + (dpc/dpi )^beta)
2)Li and Wang Model:
The Li and Wang model include particle bounce or re-entrainment and turbulent diffusion at the cyclone wall. A two-dimensional analytical expression of particle distribution in the cyclone is obtained.
The resultant expression of the collection efficiency for particle of any size is given as
E = 1 − exp{−lambda*theta(1)}
where
theta1 = (2*pie(S + L))/a
3) Koch and Licht Model:
Koch and Licht collection theory recognized the inherently turbulent nature of cyclones and the distribution of gas residence times within the cyclone. Koch and Licht described particle motion in the entry and collection regions with the additional following assumptions:
- The tangential velocity of a particle is equal to the tangential velocity of the gas flow, i.e. there is no slip in the tangential direction between the particle and the gas.
- The tangential velocity is related to the radius of cyclone by uRn = constant.
A force balance and an equation on the particles collection yields the grade efficiency E
E = 1 – exp*{-2*[((G*tau*Q)/(D^3))*(n+1)]^0.5/(n+1)}
4) Lapple Model:
Lapple model was developed based on force balance without considering the flow resistance. Lapple assumed that a particle entering the cyclone is evenly distributed across the inlet opening. The particle that travels from inlet half width to the wall in the cyclone is collected with 50% efficiency.
The efficiency of collection of any size of particle is given by
E =1/(1 + (dpc/dpi )^2)
Where, dpi is particle diameter and dpc is cut diameter.
Discrete Phase Modelling(DPM):
DPM is employed when we want to represent solid particles and gas or liquid or say liquid droplets in a gas or sometimes bubble in a liquid. So, PDM consists of two phases, one is called Continuous phase and another is called the Discrete phase. The continuous phase consists of fluid that is flowing within the fluid volume and the discrete phase consists of smaller particles that are supposed to be interacting with the continuous phase. The Discrete phase can also exchange momentum, mass, and energy with the fluid phase or continuous phase in this case.
SIMULATION:
Steps in Simulation:
Open Ansys Workbench. Drag and drop Fluid Flow (Fluent) onto Project Schematic.
Here, we will see Steps we need to follow to solve a particular engineering system from a CFD standpoint.
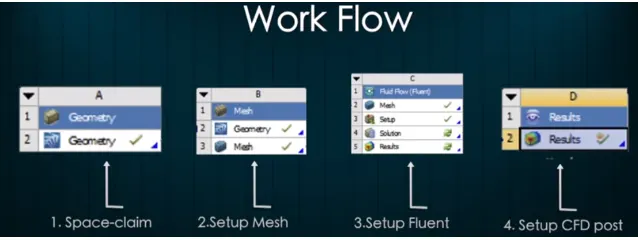
- Geometry: Spaceclaim, where we import the geometry.
- Mesh: Ansys Mesh, where Boundary naming, element sizing and mesh generation with required grid size will be done.
- Setup: Ansys Fluent, where the actual case setup will be done.
- Solution: Ansys Fluent, where runtime results visualization done.
- Results: CFD-Post, where Post Processing of Results will be done.
CAD Cleanup:
Import Graphics card geometry into Spaceclaim, Spaceclaim is CAD cleanup software that can be used to prepare CAD models for simulation setup. It could be for CFD or FEA.
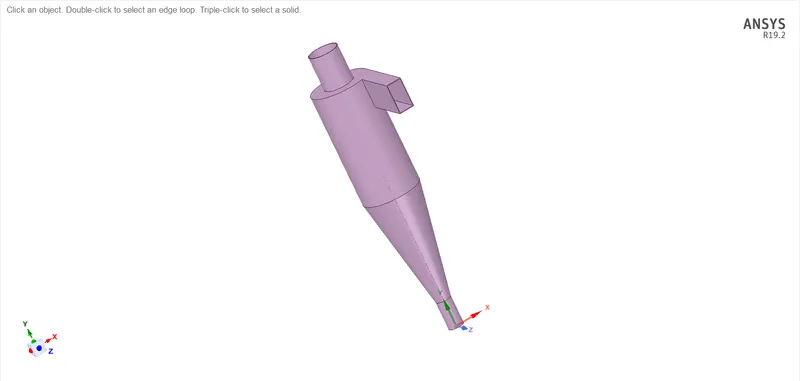
As we can see above figure is the Solid model. We need to carry out analysis on the fluid volume, so extract the fluid volume. Select Prepare, select volume extract, select edges. Select one inlet(in axial direction and two outlets in on top(accept port) and other is at bottom(trash /reject port).
Mesh Generation
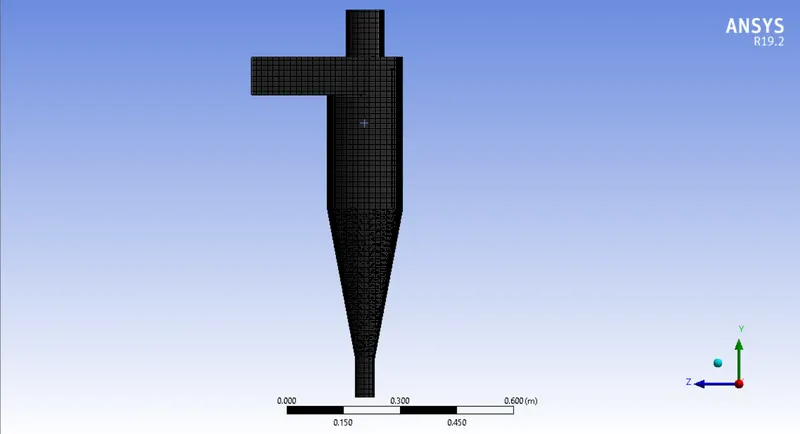
Named Selection:
Name one inlet(in axial direction and two outlets in on top(accept port) as outlet_1 and other is at bottom(trash /reject port) as outlet_2
Select cutcell meshing for the best results.
Mesh element size 5mm.
Fluent Setup:
Setting up physics:
Select k-epsilon, RNG, with swirl dominated flow terbulent model.
The renormalization group (RNG) K-epsilon turbulence model, derived directly from the incompresible Navier-Stokes equations for the near-wall asymptotic behavior of the eddy viscosity and the pressure transport term in the turbulent kinetic energy equation.
Solver:
Pressure-based as Mach number is less than 3.
Assign Time as Steady-State Solver.
Enable gravity in y axis -9.81 m/s^2
Material Selection:
For Gas- air
For solid particles- Anthracite.
Properties of Material:
For Air:
Density = 1.22 kg/m^3
Viscosity = 0.0000181 kg/m.s
For Anthracite:
Density= 1506 kg/m^3
Setting Boundary Condition:
For Inlet:
Velocity =1,3, 5m/s
Temperature = 300kelvin
In DPM:
Inlet and wall:- Reflect
Outlet:
Pressure= 0 Pascal. (Ambient Pressure)
In DPM:
Outlet(Top):- Escape
Outlet(Bottom/dustbin) – Trap
To enable the interaction between gas and solid particles, Turn on DPM
Click on Interaction with Continuous Phase to enable the couple flow (interaction between gas and solid particles).
Select Update DPM sources every flow iterations- to calculate particle source term at every iterations.
Select Contour plots for DPM variables – to allow cell average variable value which is use for Post processing.
Tracking parameter- select maximum number of steps 50,000 and Step length factor 5 - the larger the step length factor the smaller will be the time step(dt).
Now to specify the injection of the discrete particles on to the Continous phase,
Select Injections->create->particle type->inert->Material(Anthracite)->Injection type(surface injections)->Surface release(inlet).
Point properties: x-velocity-3m/s, Diameter – 5microns, Total flow rate- 1e-20 kg/s.
Solution:
Methods
For Turbulent Kinetic Energy-> 1st order Upwind Interpolation scheme as it is unconditionally stable.
For Turbulent Dissipation rate-> 1st order Upwind Interpolation scheme as it is unconditionally stable.
Control:
Pressure of particle 0.1 , momentum of particles 0.3.
Solving:
Standard Initialization->options->compute from inlet->Initialize and calculate.
After calculations, check DPM data from console and Export-> Particle History data from injection0 folder for CFD Post
CFD Result:
Import Particle data.
Double click on FLUENT PT for Anthracite->color(Anthracite Particle time)->apply.
Enable the Vortex Core region.
Create an animation of Particle tracking.
Calculate various properties like mass flow rate, pressure, velocity.
Plots and Results:
(1) CASE 1: For the particle diameter from 1,3 and 5 μm respectively and velocity of gas and particle is constant 3m/s
Residuals Plot:
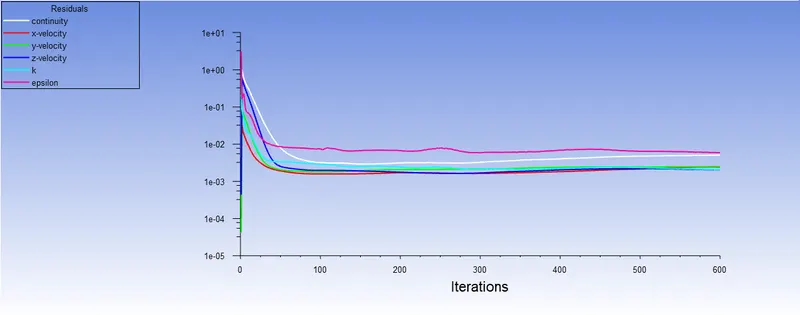
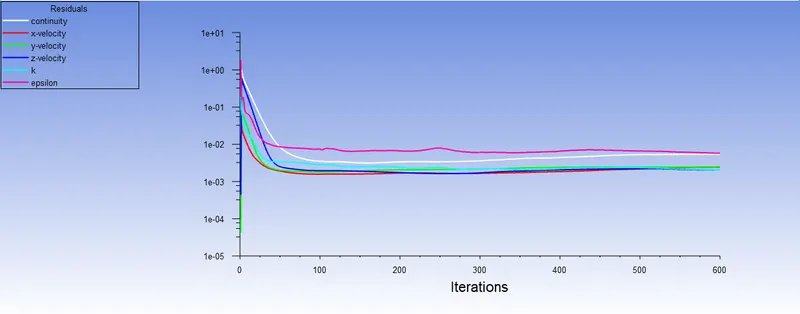
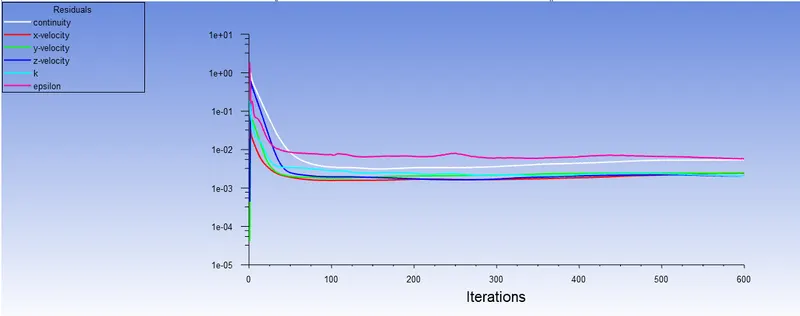
In all the above three Residuals plots the solutions become steady at 250 iterations approximately.
Anthracite Particle Time Plot:
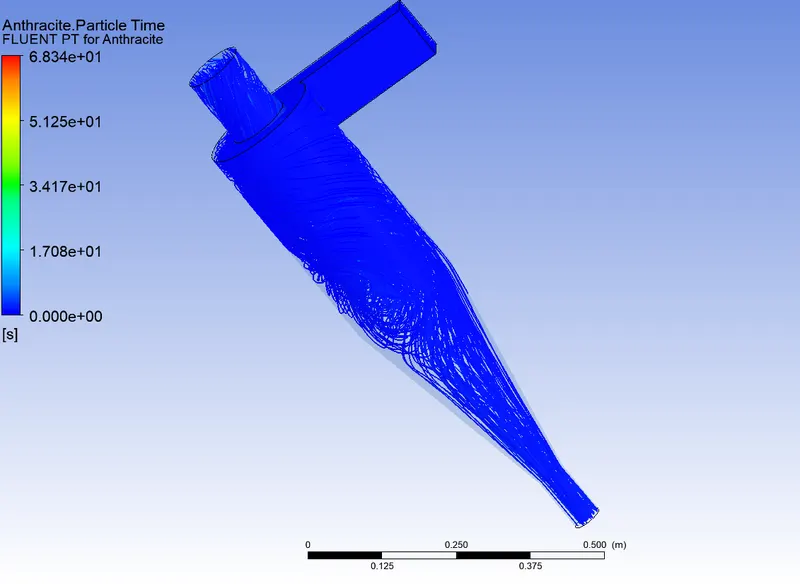
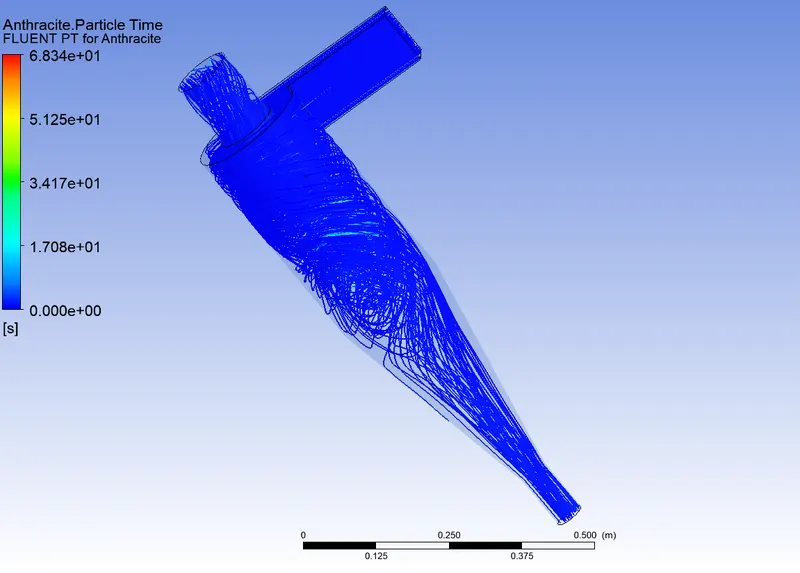
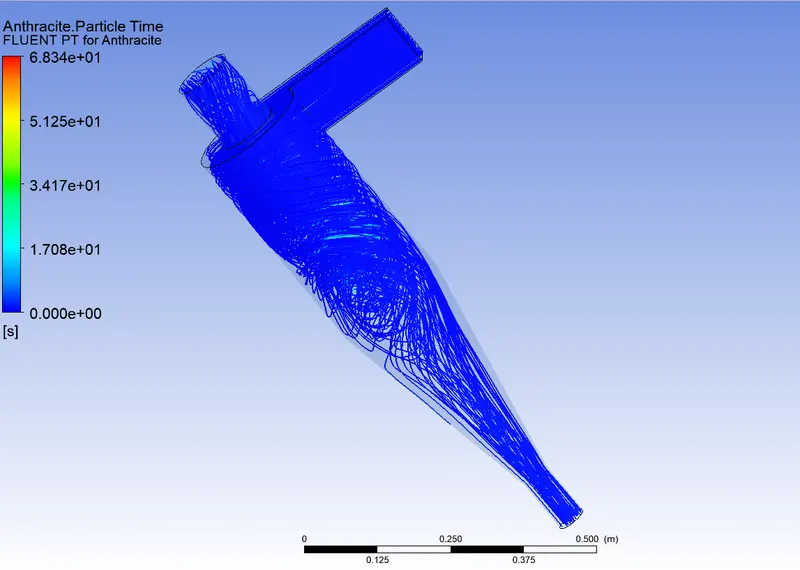
In all the above three plots the residence time of particles is almost same as the velocity of particles same.
Vortex core region:
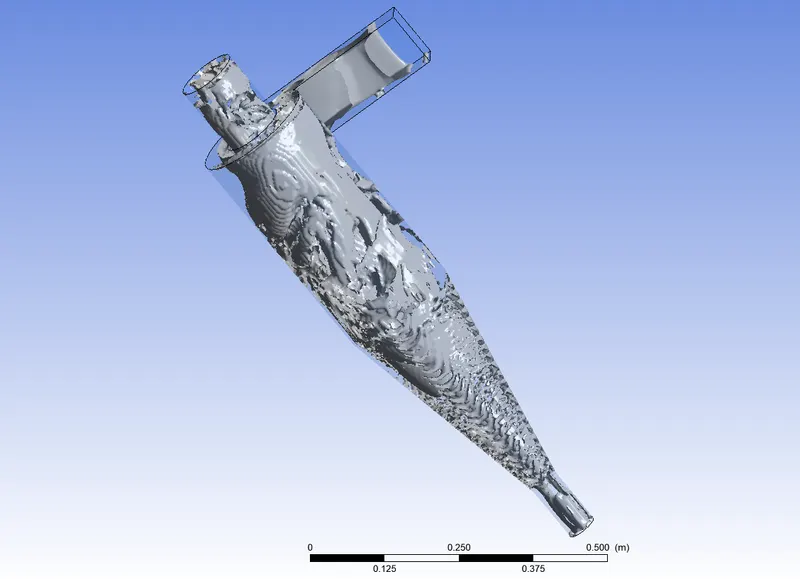
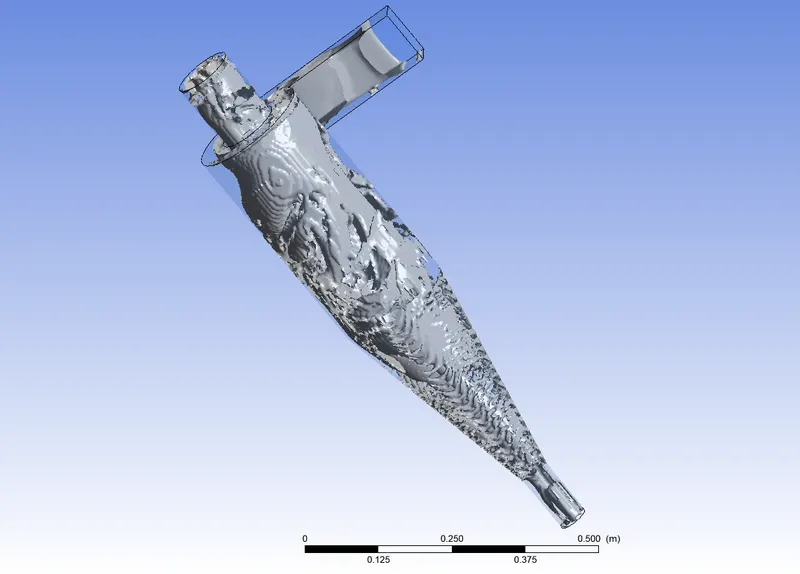
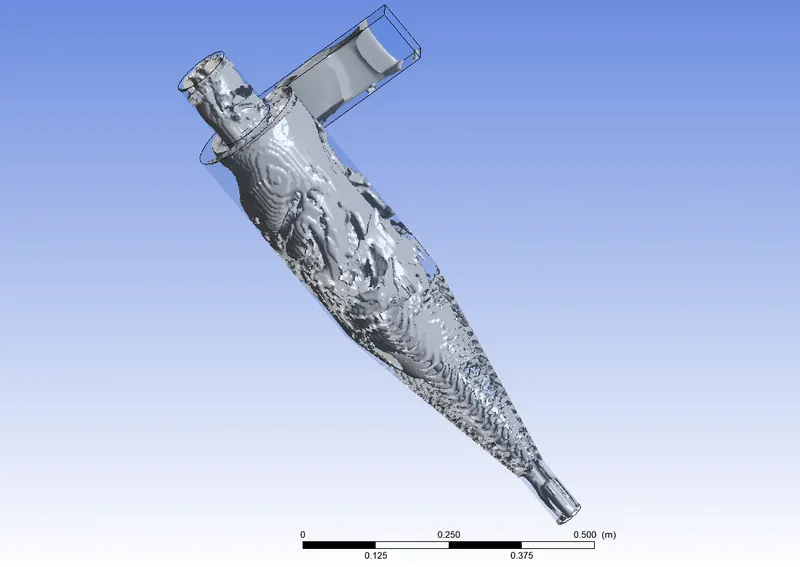
The density distribution of the vortex region increases with an increase in the size of particles.
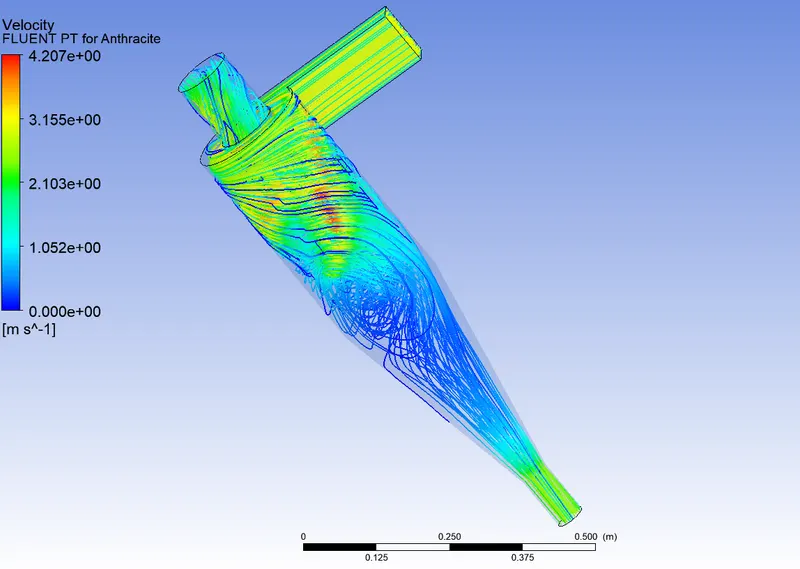
Velocity tracking of particles:
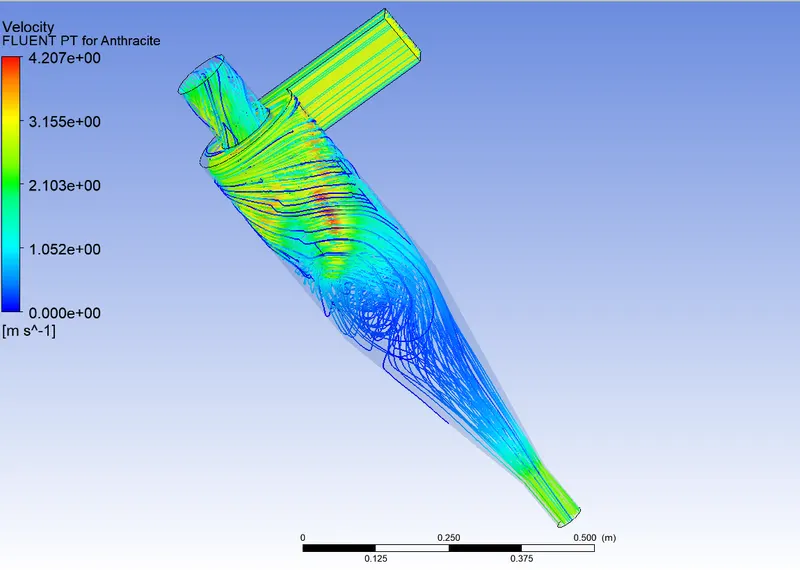
Pressure plots:
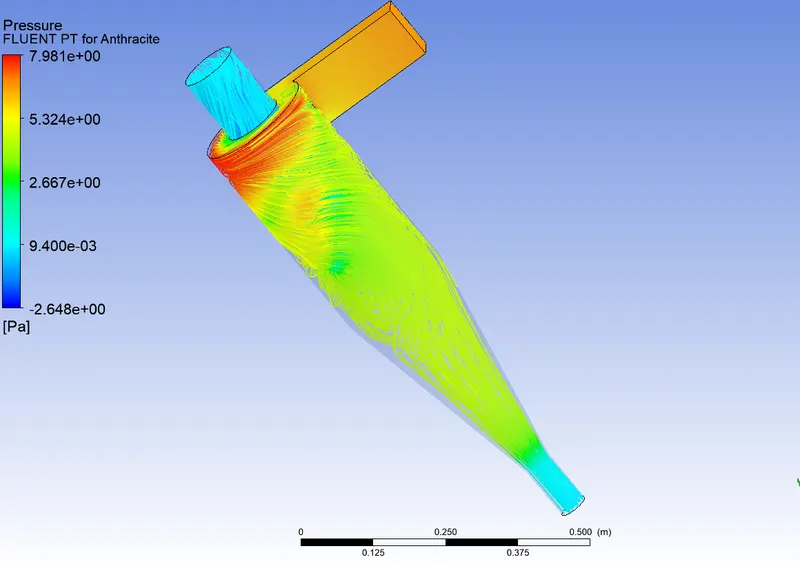
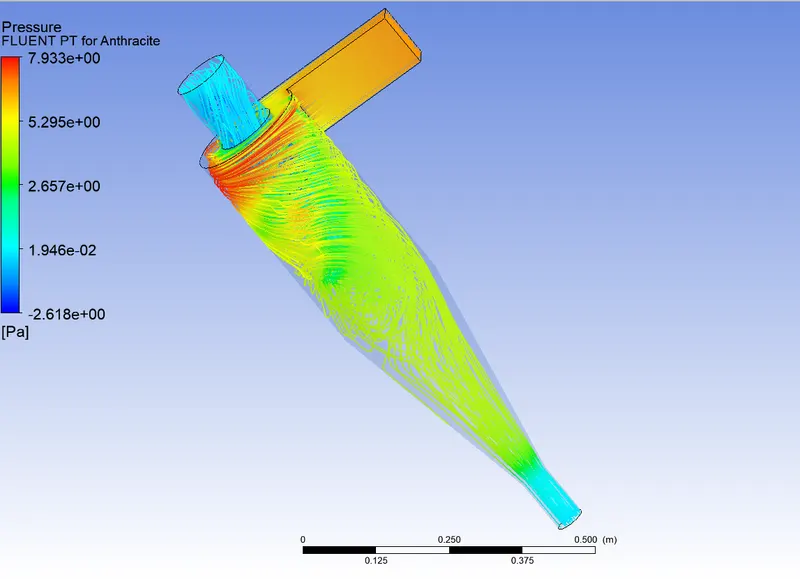
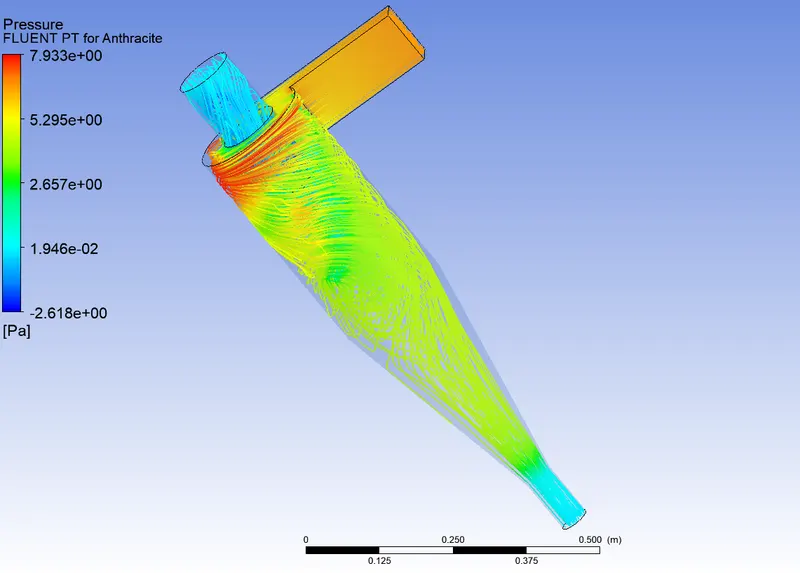
The Pressure drops are 6.011 Pascals, 6.0138 Pascals, and 6.47 Pascals for particle size 1,3 and 5 microns.
Efficiency and Mass flow rate:
At a velocity of particle and gas is constant 3m/s and,
For particle size 1micon
Mass flow rate at accept port= -0.0122859 kg/s
Mass flow rate at reject/trash port= -0.00608474 kg/s
Particle tracked=465; particle escaped=236; trapped=144, incomplete=85
E = Number of particle trapped/Number of Particles tracked=144/465=30.96%
For particle size 3micon
Mass flow rate at accept port= -0.0123436 kg/s
Mass flow rate at reject/trash port= -0.00602627 kg/s
Particle tracked=465; particle escaped=222; trapped=151, incomplete=92
E = Number of particle trapped/Number of Particles tracked=151/465=32.47%
For particle size 5micon
Mass flow rate at accept port= -0.0123436 kg/s
Mass flow rate at reject/trash port= -0.00602627 kg/s
Particle tracked=465; particle escaped=199; trapped= 160; incomplete=106
E = Number of particle trapped/Number of Particle tracked=160/465=34.40%
- As the particle size increases the Efficiency of Cyclone separator also increases.
- The mass flow rate is negative, indicates, the mass flows out of the separator. It is almost the same for the same magnitude of velocity.
|
Particle size(in inches- microns) |
Efficiency(%) |
Pressure drop (Pascals) |
Mass flow rate (kg/sec) |
|
|
Accept port |
Reject port |
|||
|
1 |
30.96 |
6.011 |
-0.0122859 |
-0.00608474 |
|
3 |
32.47 |
6.0138 |
-0.0123436 |
-0.00602627 |
|
5 |
34.40 |
6.47 |
-0.0123436 |
-0.0123436 |
(2)CASE 2: For the particle and gas velocities are 1,3 and 5 m/s respectively and particle size is constant 5μm
Residuals Plot:
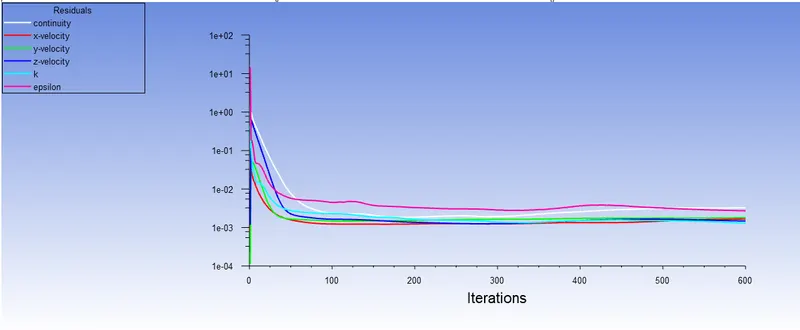
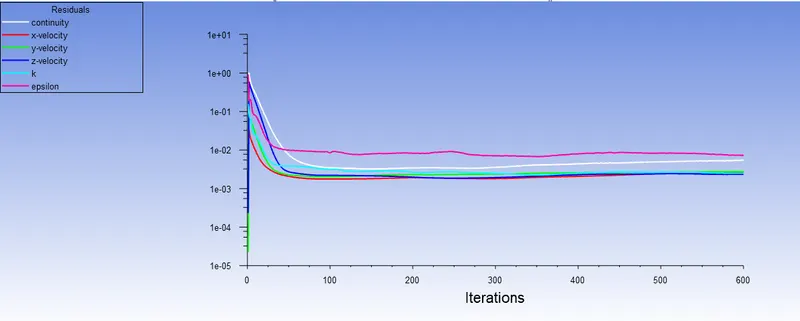
Anthracite Particle Time Plot:
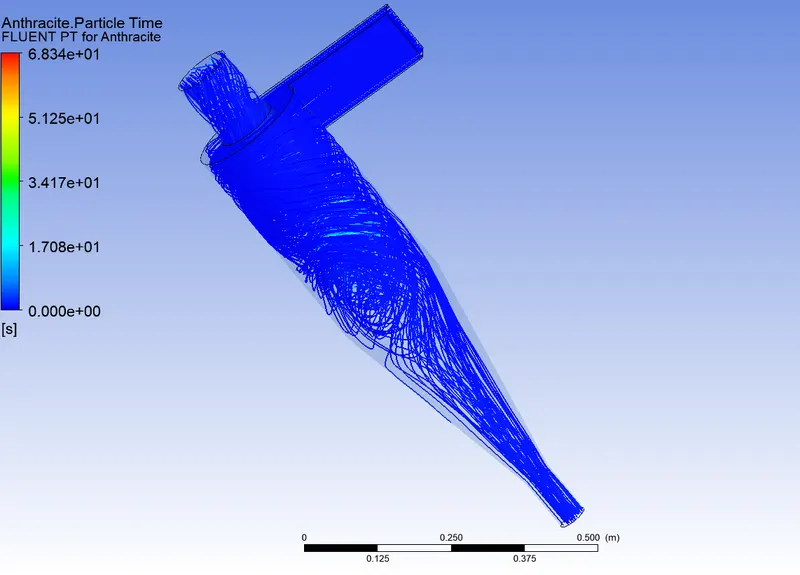
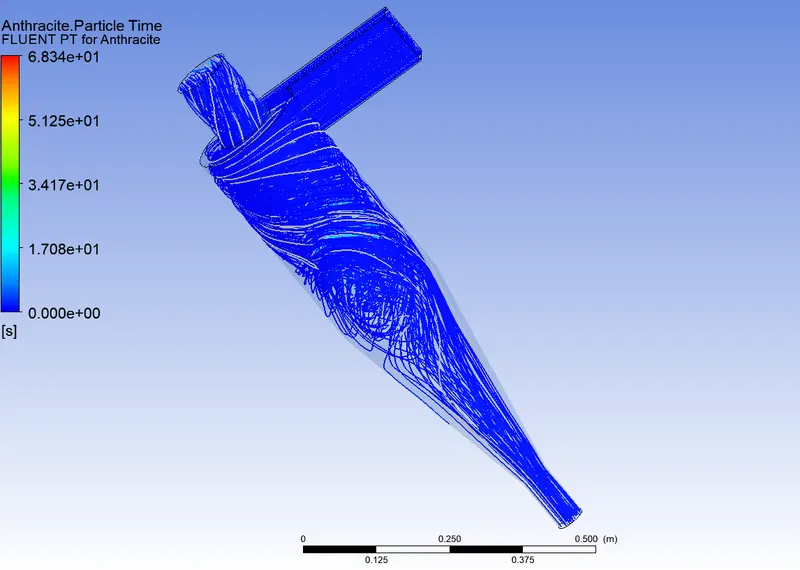
Vortex core region:
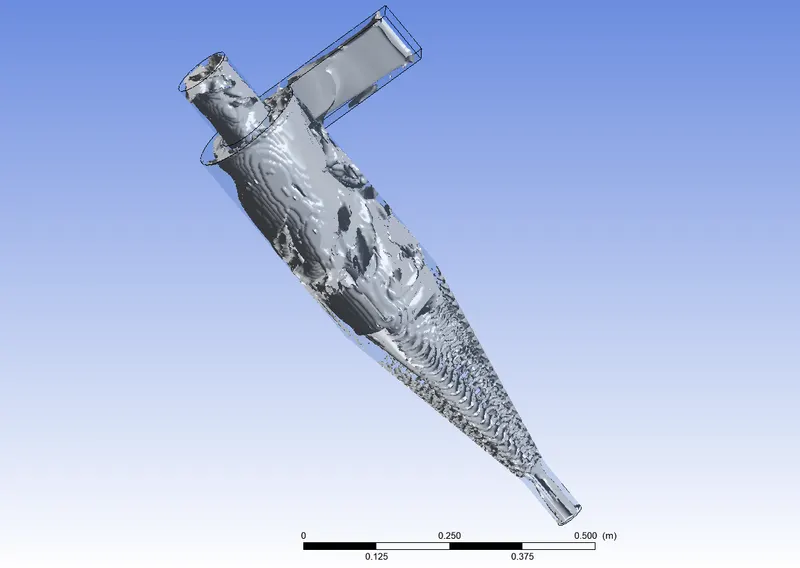
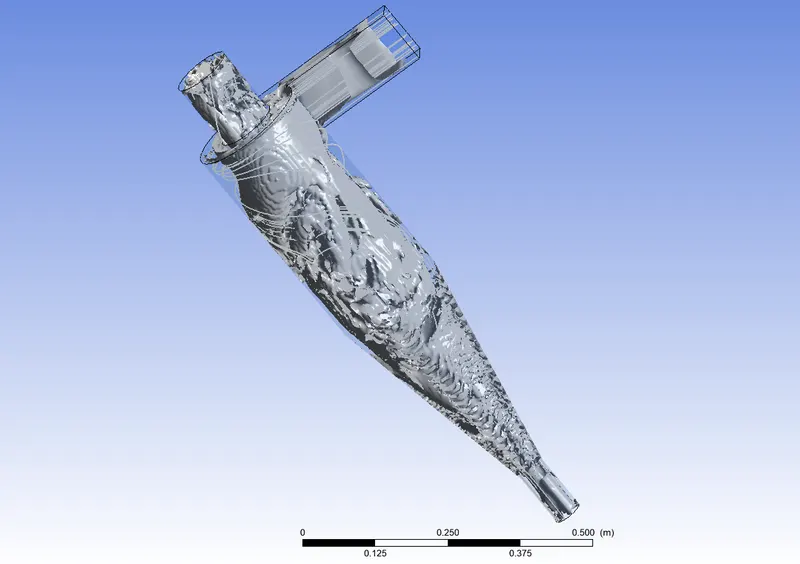
The density distribution of the vortices increases with an increase in the size of particles.
Velocity tracking of particles:
Pressure plots:
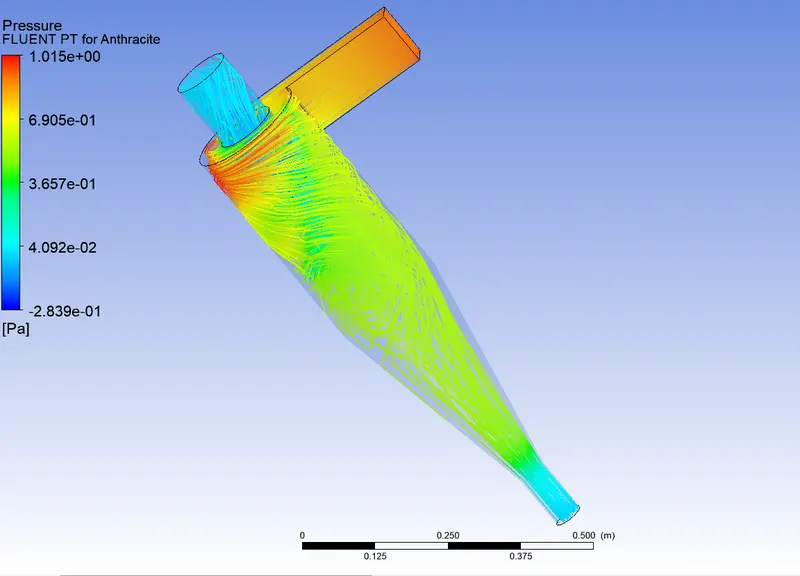
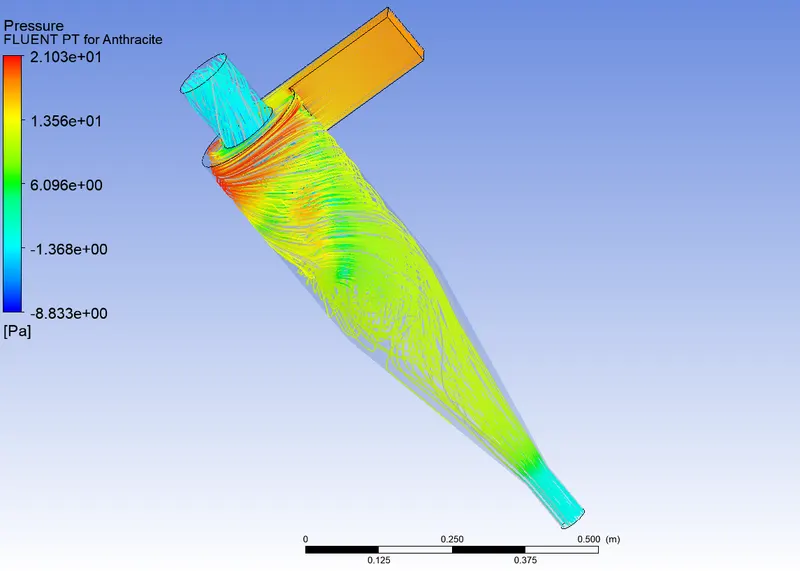
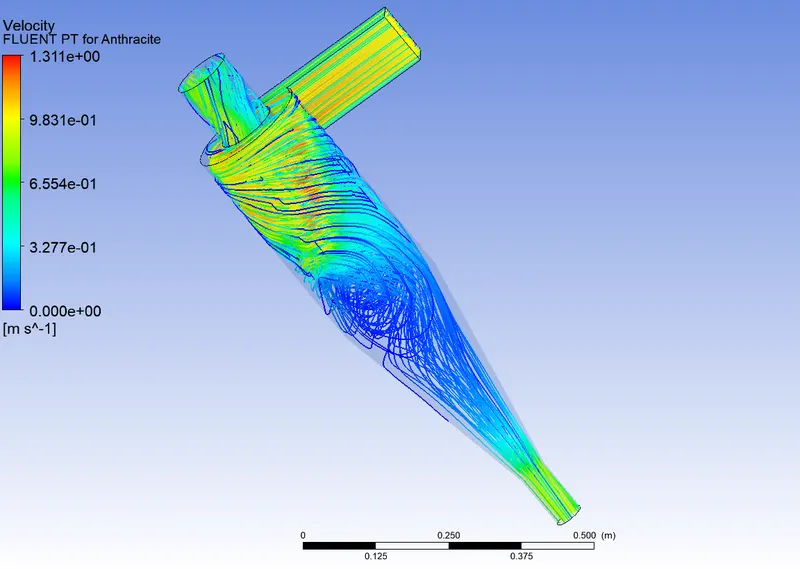
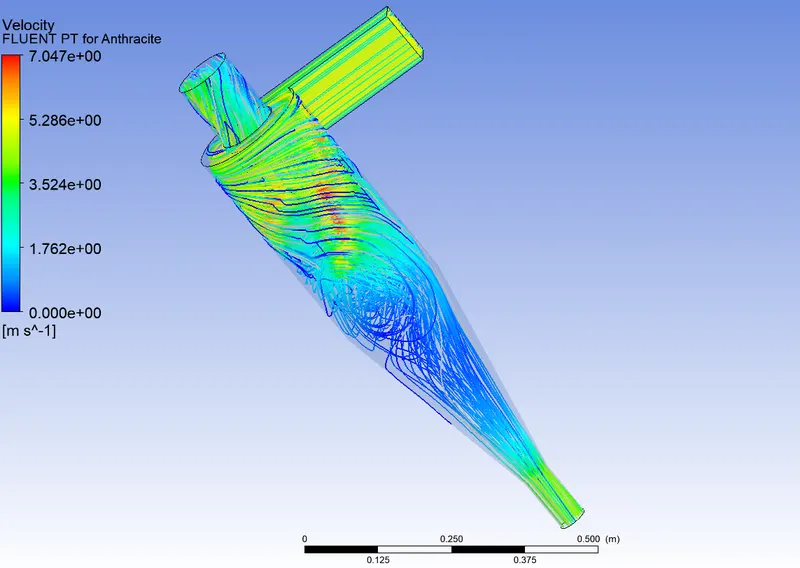
The Pressure drops are 6.01 Pascals, 6.76 Pascals, and 16.84 Pascals for particle and gas velocity for 1,3,5m/s.
Efficiency and mass flow rate:
At a velocity of particle size constant 5 microns and,
For particle and gas velocity 1m/s
Mass flow rate at accept port= -0.00418409 kg/s
Mass flow rate at reject/trash port= -0.00194002 kg/s
Particle tracked=465; particle escaped=227; trapped=131; incomplete=107
E = Number of particle trapped/Number of Particles tracked=227/465=48.81%
For particle and gas velocity 3m/s
Mass flow rate at accept port= -0.0123436 kg/s
Mass flow rate at reject/trash port= -0.00602627 kg/s
Particle tracked=465; particle escaped=199; trapped=160, incomplete=106
E = Number of particle trapped/Number of Particles tracked=199/465=42.79%
For particle and gas velocity 5m/s
Mass flow rate at accept port= -0.024619 kg/s
Mass flow rate at reject/trash port= -0.009121 kg/s
Particle tracked=465; particle escaped=178; trapped=162; incomplete=125
E = Number of particle trapped/Number of Particles tracked=125/219= 38.27%
- As the velocity of gas and particles increases for the same size of the particle, the Efficiency of Cyclone separator also increases.
- The mass flow rate is negative, indicates, the mass flows out of the separator. It increases with increasing the magnitude of velocity.
|
Particle and gas velocity (in m/s) |
Efficiency(%) |
Pressure drop (Pascals) |
Mass flow rate (kg/sec) |
|
|
Accept port |
Reject port |
|||
|
1 |
48.81 |
6.011 |
-0.00418409 |
-0.00194002 |
|
3 |
42.79 |
6.76 |
-0.0123436 |
-0.00602627 |
|
5 |
38.27 |
16.84 |
-0.024619 |
-0.0099121 |
Conclusion:
- As the velocity(tangential velocity) of gas and particles increases for the same size of the particle, the Efficiency of Cyclone separator and Pressure drop also increases due to inertia.
- As the particle size increases the Efficiency of Cyclone separator and Pressure drop also increases.
Animation Link:- https://drive.google.com/file/d/1CTMtEHIbbBrGPLRq3NV7hFF7eEVhfITw/view?usp=sharing