Project 1 - Parsing NASA thermodynamic data
AIM:-
To read and calculate the specific heat,enthalpy,entropy from all the species from the given NASA thermodynamic data file.
OBJECTIVES:-
1) To write a function that extracts the 14 co_efficients (a1-a14) and calculate the specific heat,enthalpy,entropy .
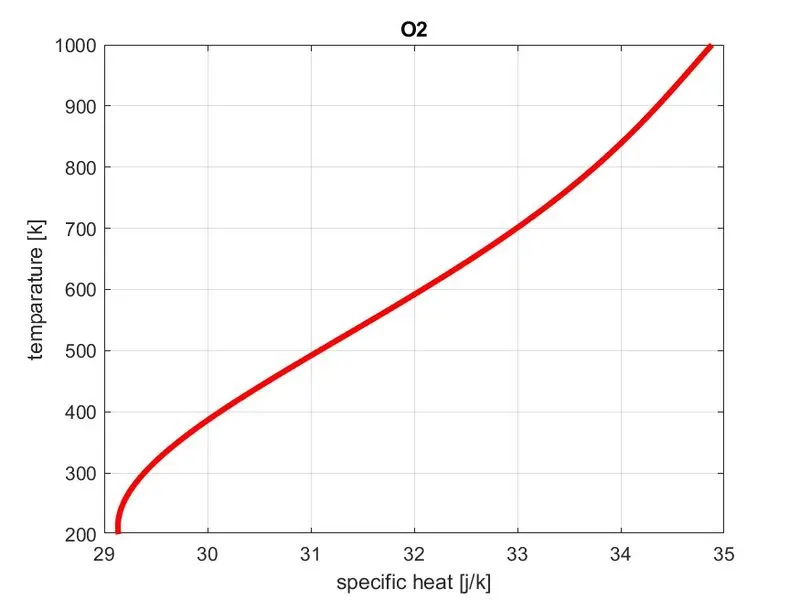
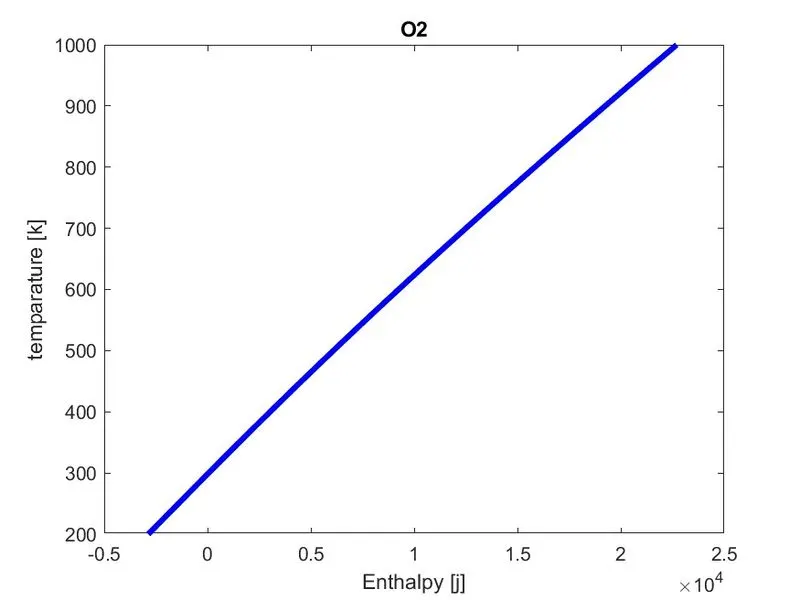
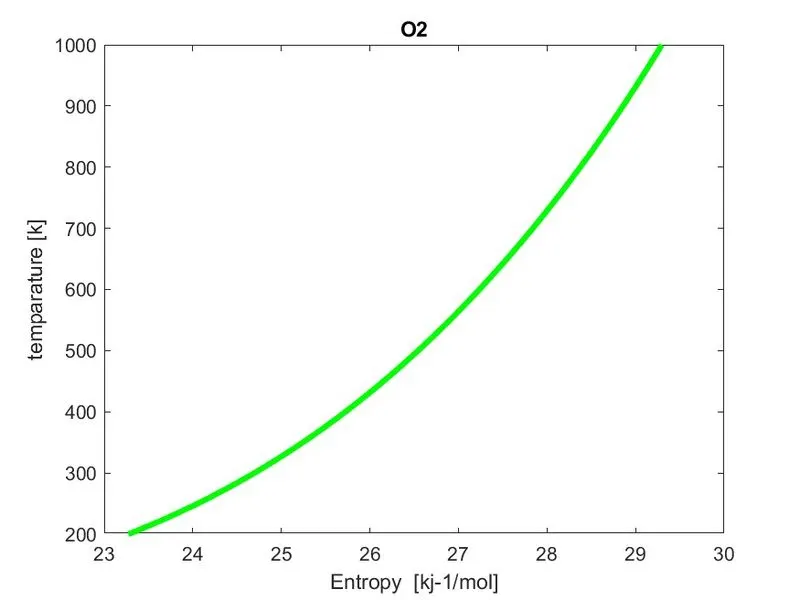
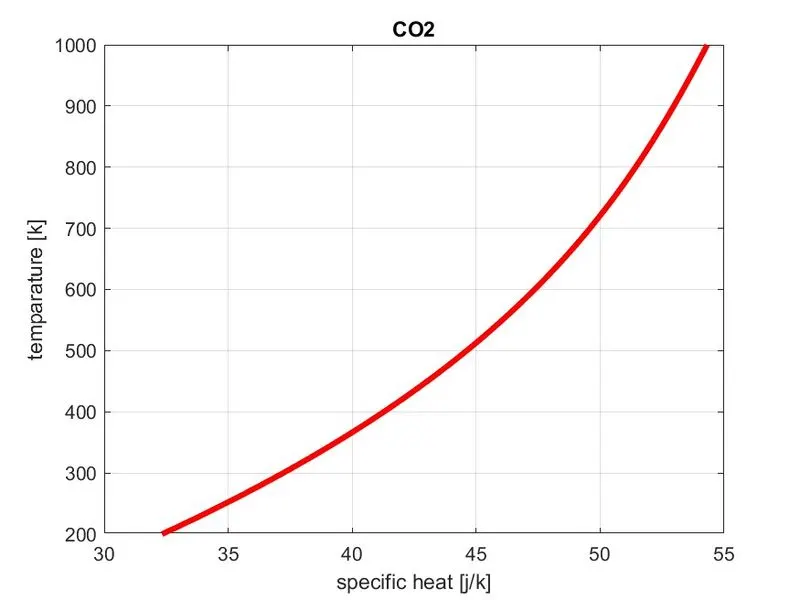
2) To plot the cp,enthalpy and entropy for the local temparature range of each species.
3) Saving the plots as images with corresponding species name and dumping them in separate folders for each species with suitable name.
INTRODUCTION:-
FILE PARSING:
This challenge having a NASA thermodynamic data file,inorder to read the data file line by line and for calculating the required parameters , evaluation of the polynomial,we are using some MATLAB commands to extract the data and evaluate,this process of parsing the data to obtain the objectives is called as file parsing.
COMMANDS USED:-
fopen - this command is used to open the data file from the folder
fgetl - used to read the required data and also to skip the data
strsplit - string splitting, used to split the string in to number of words
str2num - string to number, used to convert the string in to numbers
strfind / findstr - used to find the letter or a number in the data
mkdir - used to create a folder
saveas - used to save the plots as images
Main Code:-
clear all
close all
clc
% for getting the data file
f1=fopen('THERMO.dat','r');
fgetl(f1);
% reading the first line of the file
header_global_temp=fgetl(f1);
% splitting the string
A=strsplit(header_global_temp,' ') ;

%obtaining global max,medium and minimum temp:

global_min=strsplit(A{2});
global_mid=strsplit(A{3});
global_max=strsplit(A{4});

%ignoring the comments in the file
for i=1:3
    fgetl(f1);
end
% reading all line data
for i=1:53
    header=fgetl(f1);
    species_header=strsplit(header,' ');
    species_name=species_header{1};

%finding the string
    loc_temp=strsplit(header,' ');
    speciess_name=(loc_temp(1));
    loc_min_temp=str2double(loc_temp(end-3));
    loc_med_temp=str2double(loc_temp(end-2));
    loc_max_temp=str2double(loc_temp(end-1));

    %finding the coefficients a1 to a14
    tline1=fgetl(f1);
    tline2=fgetl(f1);
    tline3=fgetl(f1);


    a=strfind(tline1,'E');
    a1=tline1(1:a(1)+3);
    a1=str2double(a1);

    a2=tline1(a(1)+4:a(2)+3);
    a2=str2double(a2);

    a3=tline1(a(2)+4:a(3)+3);
    a3=str2double(a3);

    a4=tline1(a(3)+4:a(4)+3);
    a4=str2double(a4);

    a5=tline1(a(4)+4:a(5)+3);
    a5=str2double(a5);

 % finding strings and convert to numbers in line3
    a=strfind(tline2,'E');

    a6=tline2(1:a(1)+3);
    a6=str2double(a6);

    a7=tline2(a(1)+4:a(2)+3);
    a7=str2double(a7);

    a8=tline2(a(2)+4:a(3)+3);
    a8=str2double(a8);

    a9=tline2(a(3)+4:a(4)+3);
    a9=str2double(a9);

    a10=tline2(a(4)+4:a(5)+3);
    a10=str2double(a10);

    %finding strings and convert to numbers in line4

    a=strfind(tline3,'E');
    a11=tline3(1:a(1)+3);
    a11=str2double(a11);

    a12=tline3(a(1)+4:a(2)+3);
    a12=str2double(a12);

    a13=tline3(a(2)+4:a(3)+3);
    a13=str2double(a13);

    a14=tline3(a(3)+4:a(4)+3);
    a14=str2double(a14);

    % creating folder
    mkdir(['C:\Users\kajendrakumar\Desktop\Matlab_Codes\species_name\2',species_name]);

T=linspace(loc_min_temp,loc_max_temp,1000);
R=8.314;
%for getting the array of cp,h.and s
for k=1:length(T)
    % TO compare the temparature to assign the coefficients
    %a1-a7 is high temparature coefficients
    %a8-a14 is low temp coefficients
    if T(k)>loc_med_temp
        % high temparature coefficients
        cp=(a1+a2.*T+a3.*T.^2+a4.*T.^3+a5.*T.^4)*R;
        H=(a1+(a2.*T)/2+(a3.*T.^2)/3+(a4.*T.^3)/4+(a5.*T.^4)/5+(a6./T))*R.*T;
        S=a1.*log(T)+a2.*T+(a3.*T.^2)/2+(a4.*T.^3)/3+(a5.*T.^4)/4+a7;
    else
        %low temparature coefficients
        cp=(a8+a9.*T+a10.*T.^2+a11.*T.^3+a12.*T.^4)*R;
        H=(a8+(a9.*T)/2+(a10.*T.^2)/3+(a11.*T.^3)/4+(a12.*T.^4)/5+(a13./T))*R.*T;
        S=a8.*log(T)+a9.*T+(a10.*T.^2)/2+(a11.*T.^3)/3+(a12.*T.^4)/4+a14;

    end

end

 % plotting the curves
 %cp v/s T
 figure(1);
 plot(cp,T,'LineWidth',3,'Color','r');
 grid on
 title(species_name);
 xlabel('specific heat [j/k]');
 ylabel('temparature [k]');
 saveas(1,'cp_vs_temp.jpeg');

 % H v/s T
 figure(2);
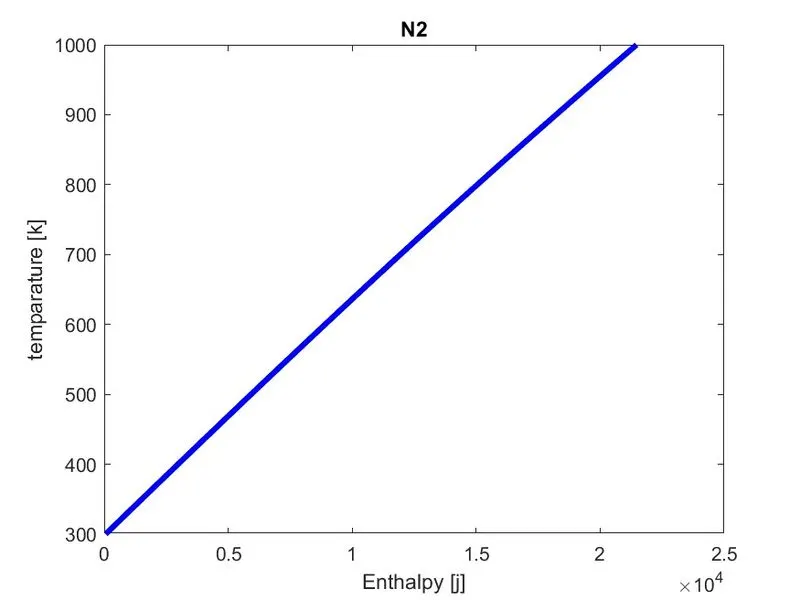
 plot(H,T,'LineWidth',3,'Color','b');
 title(species_name);
 xlabel('Enthalpy [j]');
 ylabel('temparature [k]');

 % entropy v/s  temparature
 figure(3);
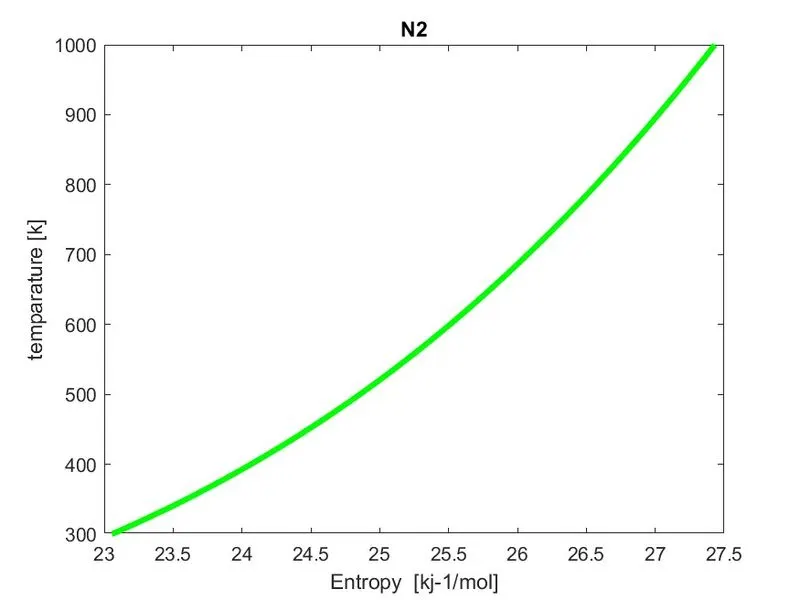
 plot(S,T,'LineWidth',3,'Color','g');
 title(species_name);
 xlabel('Entropy  [kj-1/mol]');
 ylabel('temparature [k]');

% changing the directory and saving the file
saving=(['C:\Users\kajendrakumar\Desktop\Matlab_Codes\species_name\1',species_name]);
cd(saving)
saveas(1,'cp_vs_temp.jpeg');
saveas(2,'enthalpy_vs_temp.jpeg');
saveas(3,'entropy_vs_temp.jpeg');
Molecular_weight=mol_weight(species_name);
end
% for h=1:length(species_name)
%
%fprintf('\n molecular weight of %s= %fn',species_name,Molecular_weight);
% end
function[w]=mol_weight(species_name)
atomic_names=['H','C','O','N','A'];
atomic_weights=[1,12,16,14,40];
w=0;
for i=1:length(species_name)
    for j=1:length(atomic_names)

    if strcmpi(species_name(i),atomic_names(j))
        w=w+atomic_weights(j);
        pos=j;
    end
    n=str2num(species_name(i));
    end
    if n>=1
        w=w+atomic_weights(pos)*(n-1);
       k=fprintf('\n Molecular weight of %s = %f',species_name,w);
    end
end
end
Plots:-
Plots for O2 species:-
Plot for CO2:-
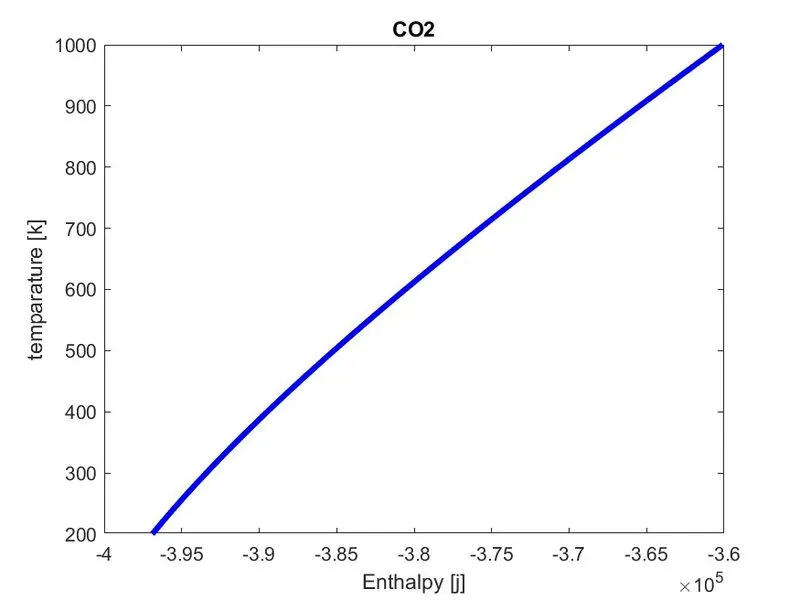
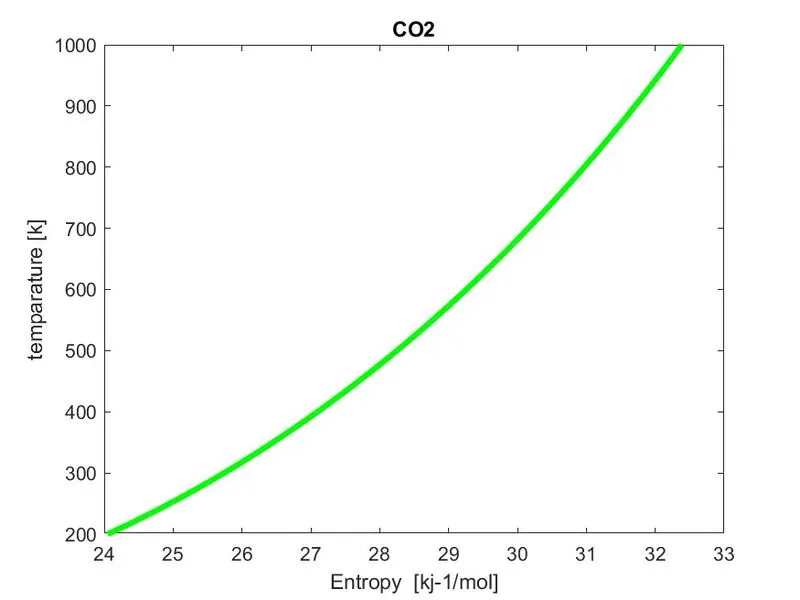
Plot for N2:-
Screenshot of the saved folder of the each species:-

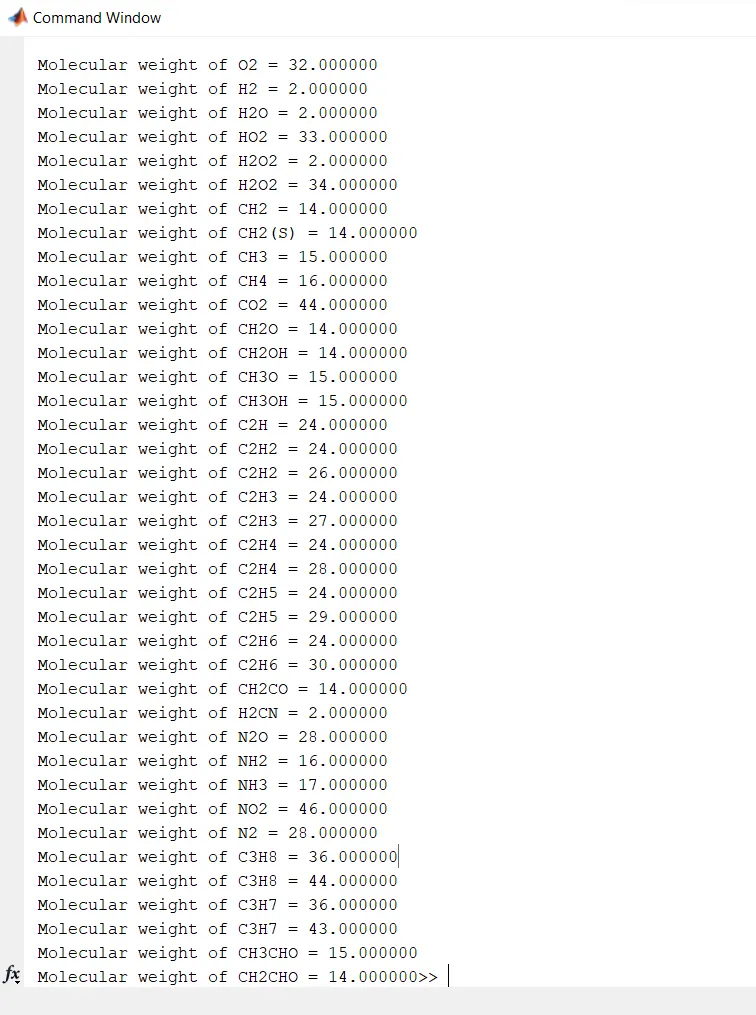
Molucular Weight Calculation Output:-
Conclusion:-
The required data is read using MATLAB by extracting the given NASA thermodynamic data file and programmed to plot the enthalpy,entropy,specific heat for all 53 species. the molecular weight is also calculated for all species.