Week 7 State of charge estimation
AIM:
1.Simulate the 3 test cases from harness dashboard and write a detailed report on the results
2.What is coulomb counting? Refer to the above model and explain how BMS implements coulomb counting for SOC estimation ?
1.
Simulating the 3 test cases from the harness dashboard
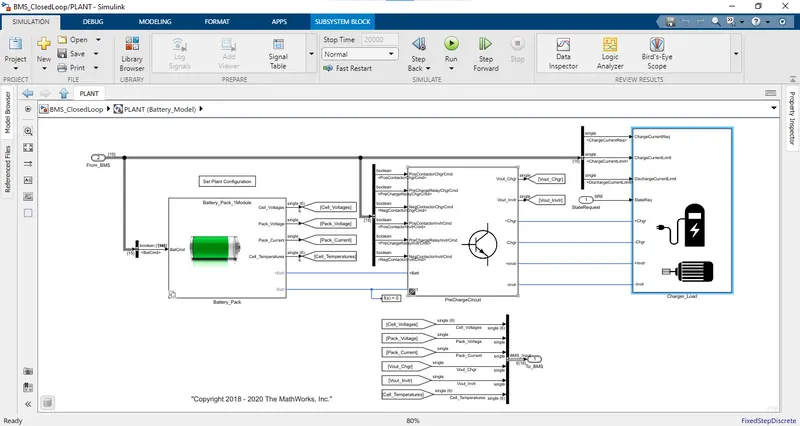
From the MATLAB model we are simulating 3 test cases from harness dashboard where to find out the fault condition in BMS. And the below image shows the dashboard where we can get the information related to faults like over voltage, under voltage, high temperature, over current and if there is any fault current the indicator will turn red colour other wise it will be in green colour.
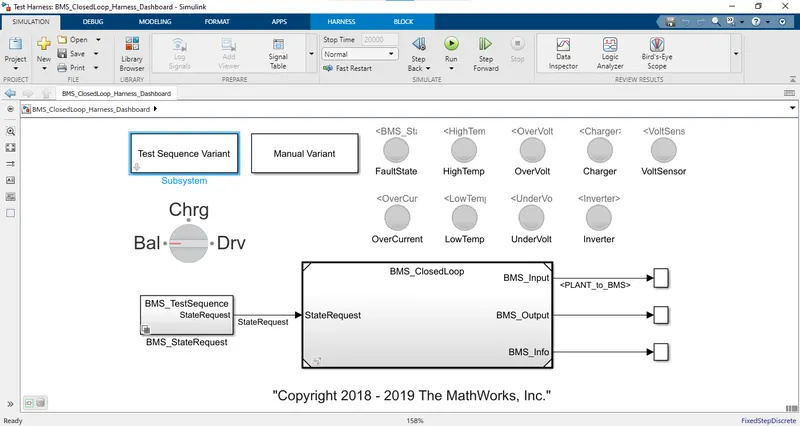
Now by running the test cases by double clicking the test sequence variant there are three cases in this so we will select the 1st case case and run it.
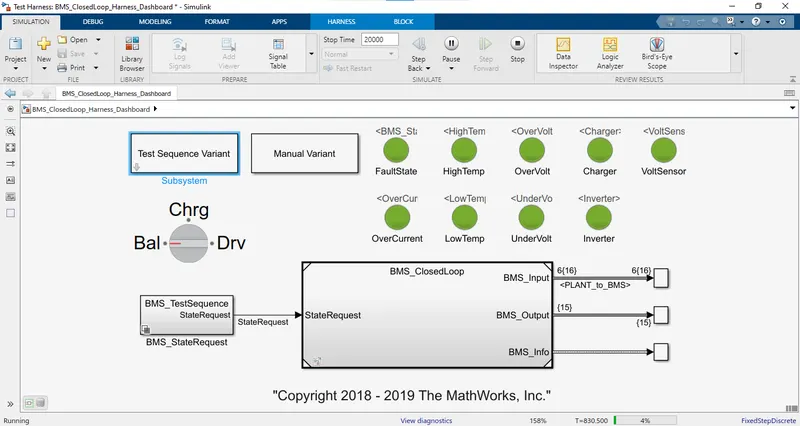
By running the test we get the result as:
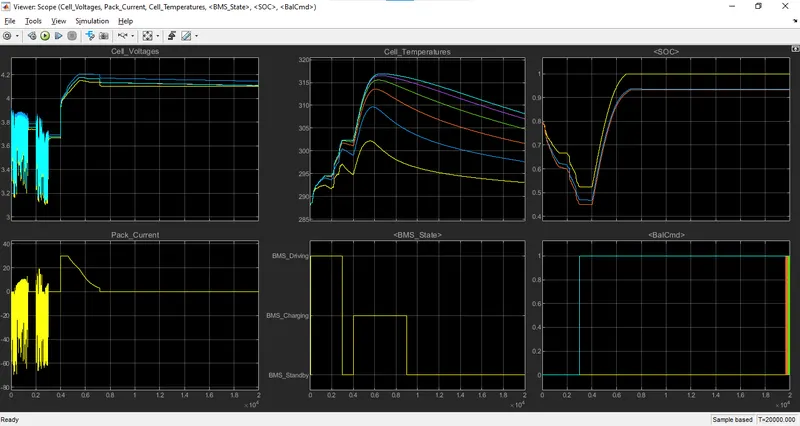
The first plot shows us the individual cell voltages for 6 cell voltages. The fluctuating voltage between 3.2 V and 3.7V is provided during the driving state (between 0 to 3000 seconds ) indicating that the nominal voltage was 3.7 and 3.2 per cell. During the charging phase it rises to 4.2V (4000 to 9000 seconds). The fully charged voltage of the battery is 4.2 V becausethe BMS was in standby mode.
The entire battery pack current is shown in the second plot because the battery looses the current while in driving mode. It is displayed in the negative direction (till -60A). The current rises to 30A during charging and then drop to zero during standby.
The 3rd graph represents battery pack temperature which range from 290K to 315K. The temperature of cells rises during battery depletion and gradually drops during charging and standby mode. We can observe from the graph that sixth cell has the highest temperature indicating that it discharged the most.
And the 4th grsph is BMS states are depicted the driving time range from (0 to 3000 seconds) the charging time ranged from 4000 to 9000 seconds and the standby time range from 9000 to 20000 seconds.
The 5th graph depicts the SOC in three seperate graphs with SOC rapidly decreasing to 0.4 during driving and fully charging back to 100% during driving. In standby mode the SOC will not change.
The cell balancing signals are shown in the sixth block from the sixth cell of the battery pack to first cell the balancing of cells is presented in descending sequence.
BMS harness test 2:
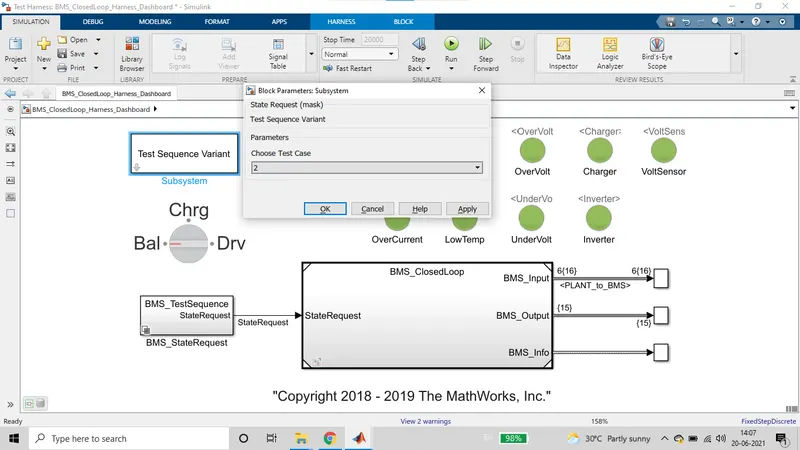
The scope results for the second test are shown below:
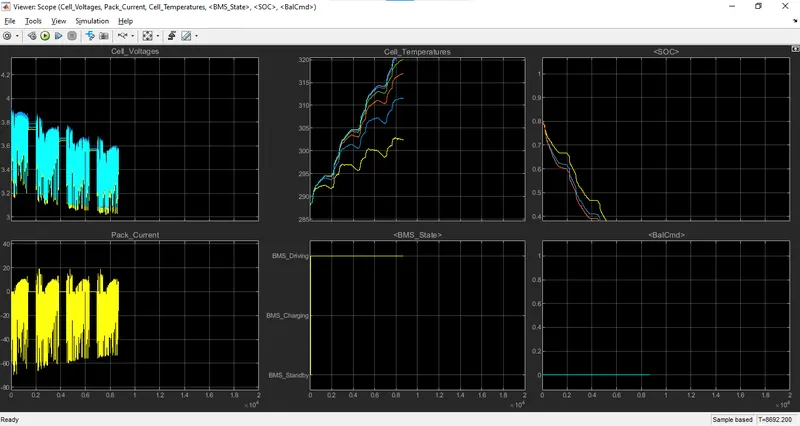
The BMS enters driving mode in this second situation untill the battery packs SOC is depleted. The battery pack discharge current for 8962 seconds as seen in the graph. We may deduce from this that battery pack asts 8962 seconds on a single charge. Here there is no cahrging or standby mode. The electric vehicle continues to run untill the battery pack is entirely depleted.
The voltage ranges from 3.7 V to 3 V this 3V is the indiviual cells cutoff voltage. The battery pack can discharge upto 60A of current. The temperature of cells continues to rise as a result of the constant discharge of current. The SOC continues to fall untill it hits 0% because the battery pack has not been charged or stood by, cell balancing is not performed while charging. The cells have been discharged evenly until they are shut off hence there is no cell balancing signal
Using this sort of case scenario will allow us to better grasp the battery's endurence and life duration.
BMS harness test 3:
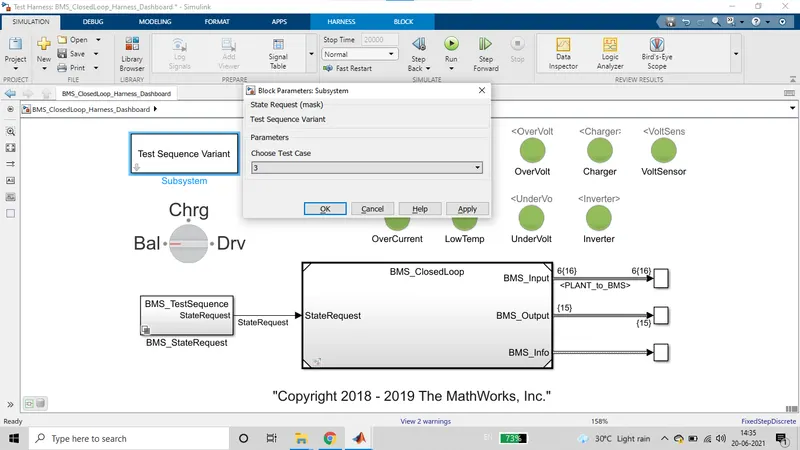
The result for 3rd test outputs are:
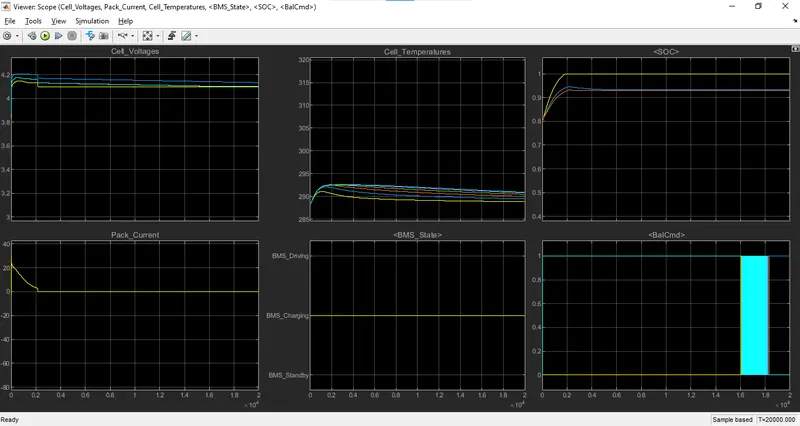
The charging is fully in this third circumstance. There is no such thing as a driving or standby state. The SOC was set to 80% at first and then the pack was fully charged after being fully charged the current the pack current incresed to zero. The in rush current is limited by the contractor circuits and SOC is 100% and it stops charging.
The fully charged voltage range for the cell is between 4 and 4.2 V. The cell temperature is also little higher at first due to intial charging current but they quickly stabilized thanks to the contractors and the balancing oders are followed by the 6th cell.
As a result the BMS system was throughly examined and the three sepearte test cases situations were throughly discussed.
2.What is coulomb counting? Refer to the above model and explain how BMS implements coulomb counting for SOC estimation ?
The Coulomb counting method measures the discharging current of a battery and integrates the discharging current over time in order to estimate SOC [20]. Coulomb counting method is done to estimate the , which is estimated from the discharging current, , and previously estimated SOC values
The SOC is one of the most important parameters for batteries, but its definition presents many different issues. In general, the SOC of a battery is defined as the ratio of its current capacity () to the nominal capacity. The nominal capacity is given by the manufacturer and represents the maximum amount of charge that can be stored in the battery. The SOC can be defined as follows:
The various mathematical methods of estimation are classified according to methodology. The classification of these SOC estimation methods is different in the various literatures. However, some literatures [5, 7] allow a division into the following four categories.(i)Direct measurement: this method uses physical battery properties, such as the voltage and impedance of the battery.(ii)Book-keeping estimation: this method uses discharging current as the input and integrates the discharging current over time to calculate the SOC.(iii)Adaptive systems: the adaptive systems are self-designing and can automatically adjust the SOC for different discharging conditions. Various new adaptive systems for SOC estimation have been developed.(iv)Hybrid methods: the hybrid models benefit from the advantages of each SOC estimation method and allow a globally optimal estimation performance. The literature shows that the hybrid methods generally produce good estimation of SOC, compared to individual methods.
Table 1 presents the specific SOC estimation methods in view of the methodology. The applications of specific SOC estimation methods in battery management system (BMS) are consequentially different.
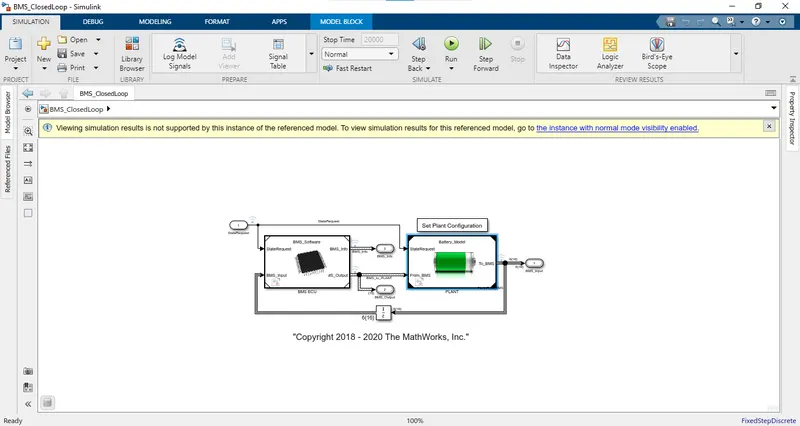
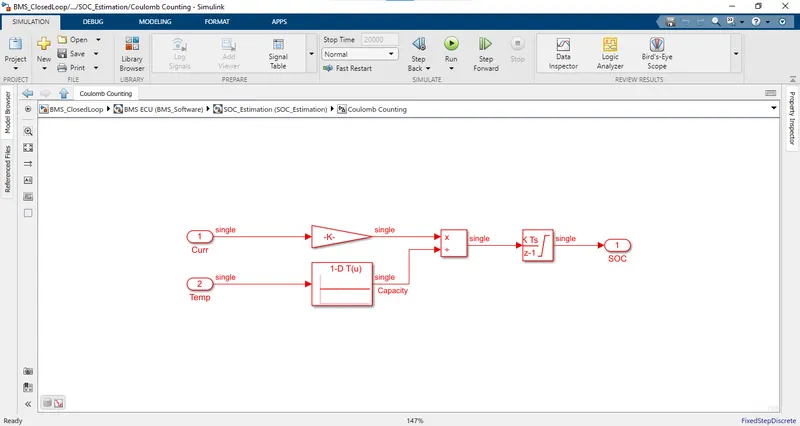
Three distinct state of charge estimating strategies are shown in the SOC estimate block. Each strategy has its own set of benifits and drawbacks. Coloumb counting is the first apporach while unscented (UKF) and extended kalman filter are the other two we are talking about Columb counting apporach here.
In coulomb counting method block it accepts two signals ie current and temperature with the current signal going out to the gain block and temperature signal going to the battery time and current lookup tables. Both blocks are linked to thwe split block and these signals are sent to the discrete time integrator to track the charge which then aids in the calculation of the state charge.
Conclusion:
One of the most difficult aspects of the coloumb counting is calibrating the initial battery SOC. In various applications rest is requried for the startup and the initial SOC is calculated using the Voltage.
Kalman filltering is a technique for estimating unknown variables based on observations collected over the time.
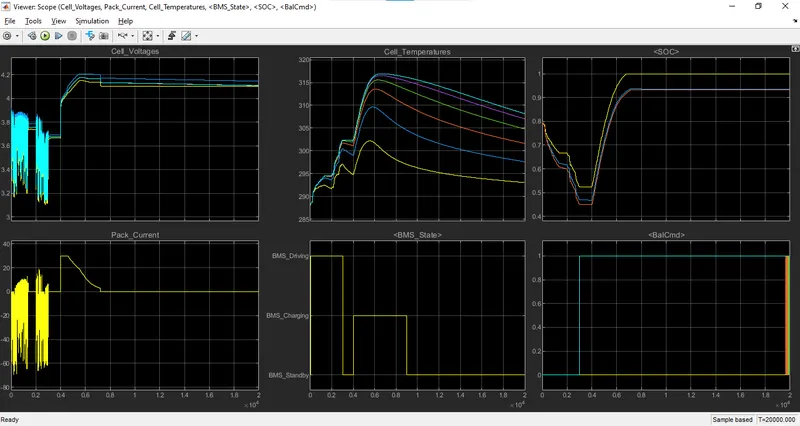
Obeservation: As the test ends we get 6 graphs considering the BMS is an operation for electric vehicle
The 1st graph (Cell voltage):This voltage involes all the cells capacity or the pack in the graoh we
observe that the cell voltages changing as the current flowing in and out at the beginning ofthe simulation. There is a slight difference in the cell voltages varing from 3.1 V to 3.9V for the time period of 0.3*10^4sec and then there is a blance