Week 7 State of charge estimation
In this challenge as from the above link I dowloaded above file from that I extracted files.
From That files I opened simulink File called BMS_closedLoop_harness_Dashboard in matlab.
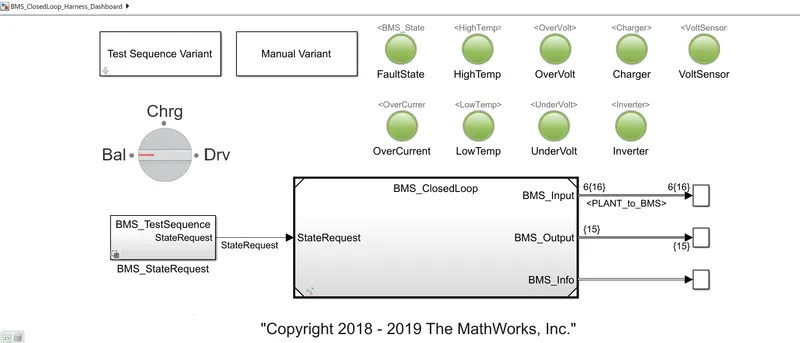
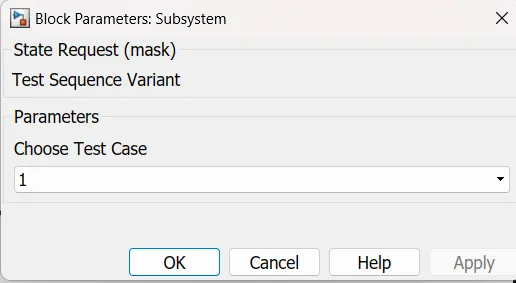
This is Test case 1
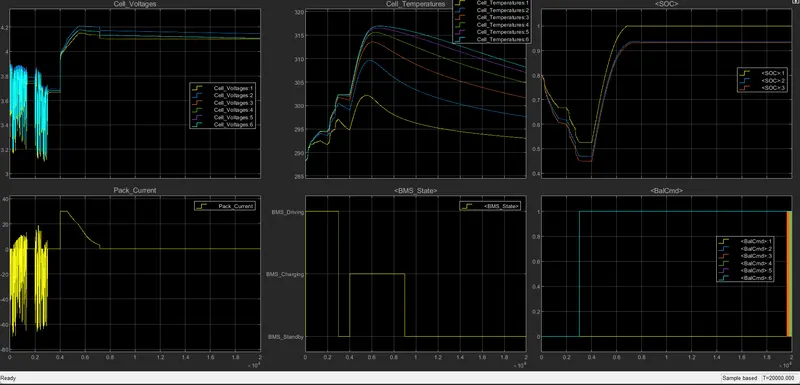
As From above graphs car is now driving state.when car is in driving state SOC is decreasing.
When comes to charging mode.SOC is increased because battery is charging.Cell Temperature is increased and voltage is increasedd to 4 to 4.2V.Current is decreased.
when car is in standBy mode as we can see BMS state is standby mode. SOC is constant.Cell Temperatures is dropped.current and Voltage is constant.
Test 2:
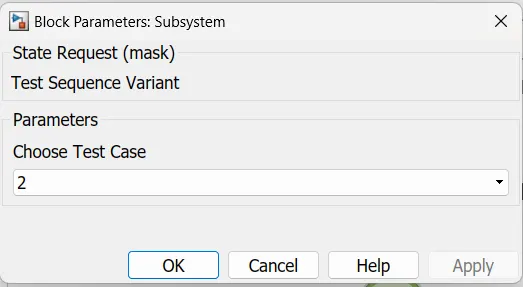
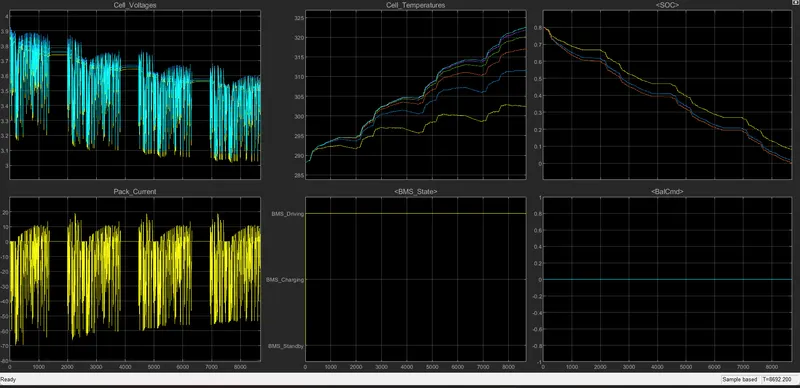
As from the above Graph I changed to state 2 and graph.
we can see this test case is in driving SOC is gradually decreases and cell Temperatures are increasing due to continous usage.
current and voltages are fluctuating.
Test 3:
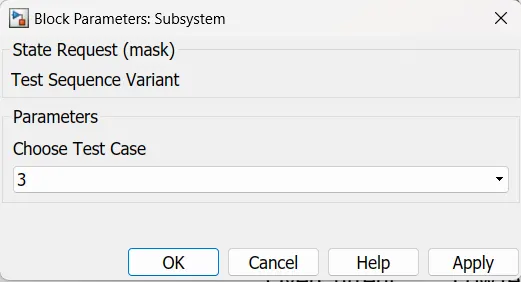
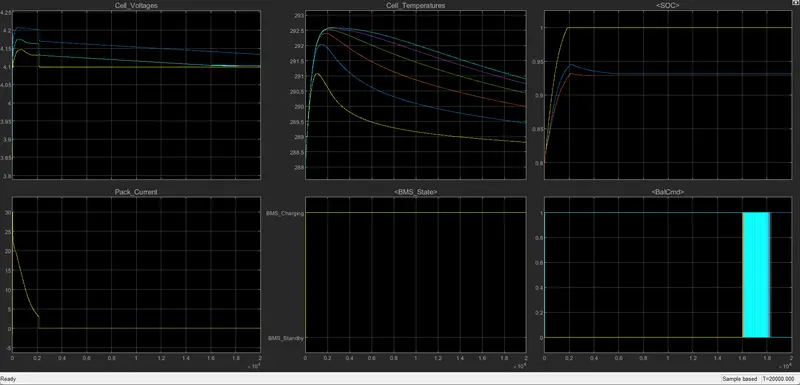
Now Its a Test 3 as from the above figure
Now Its charging As we can see SOC is increased and constant at 100 percent charged.cell Temperature increases.
Columb Counting:
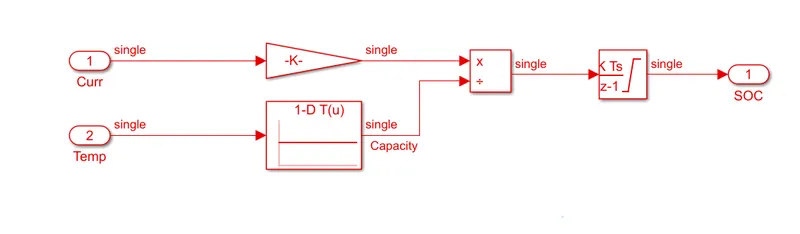
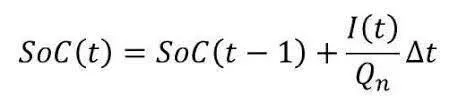
The Columb Counting method measures the discharging current of Battery and integrates the discharging current over time in order to estimate SOC.
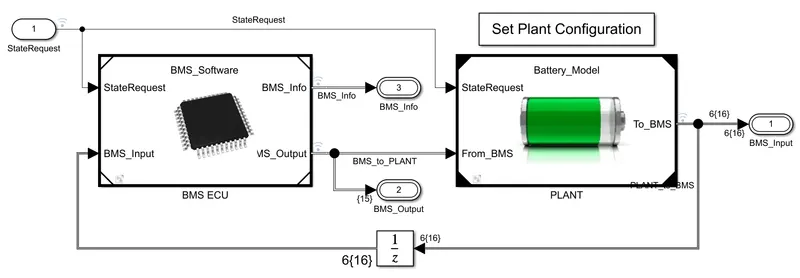
As in below BMS model
If I open BMS_ECU
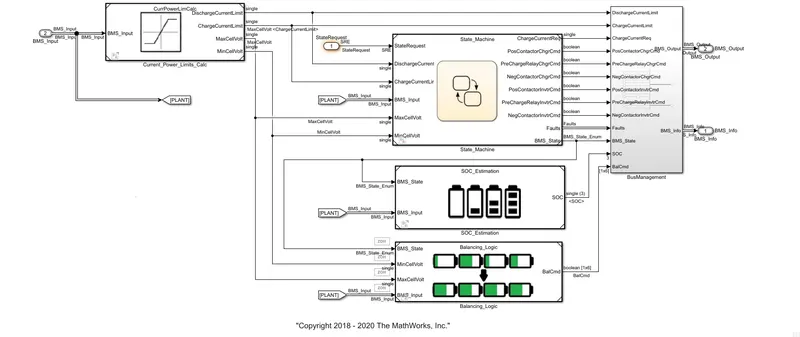
above blocks will open.If i open SOC_estimation.
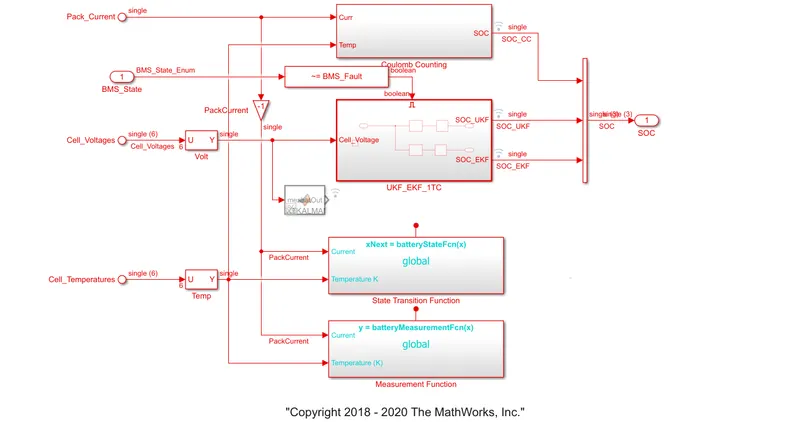
If I open Columb Counting Block.