Week 7 State of charge estimation
1. Simulate the 3 test cases from harness dashboard and write a detailed report on the results
ANSWER:
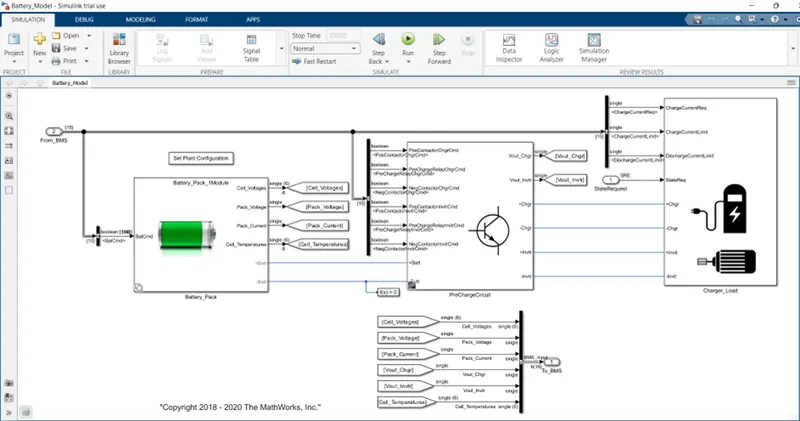
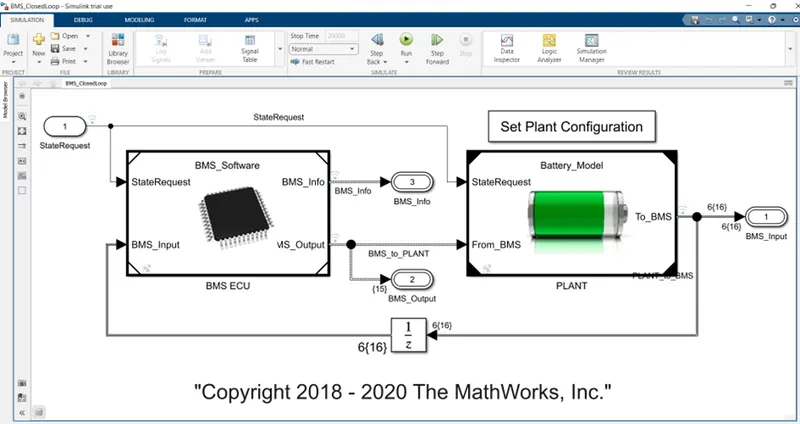
- The BMS model consists of BMS ECU and PLANT model. This model contains two versions of the battery packs, a small one with just 6 cell series and a larger 16- module pack. Each module containing a 6 cells series string. The configuration is 6S1P and 96S1P packs respectively.
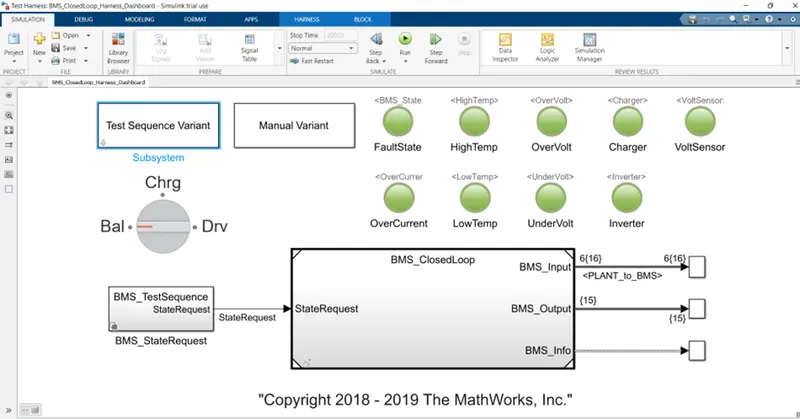
2. The harness dashboard is shown below. It consists of the test sequence variant subsystem which hold three different test cases. This model shows the fault states. Green color indicates that the system is working without any errors while red signal will indicate that there is a fault in the system.
Test 1 step
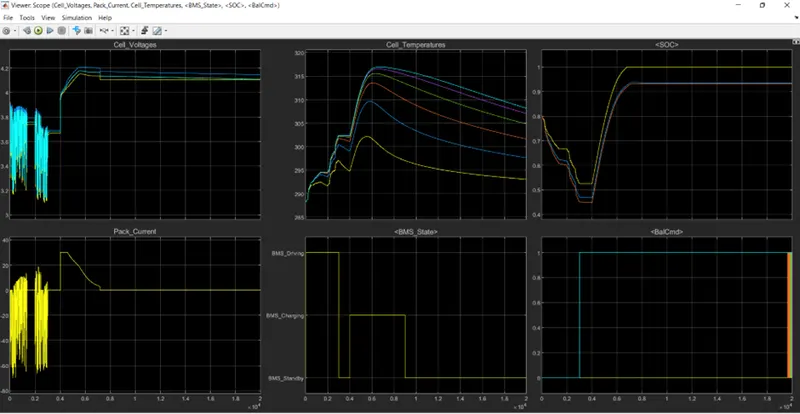
- From Test sequence Variant, we selected test case1, we have to run the simulation. The dashboard shows there is no error and faults.
- We got scope of test case 1 which consists of the measurement of cell voltages, cell temperatures, SOC, pack current, BMS state.
- The value of BMS_State seen that the vehicle initially undergoes driving then BMS charging up to 90% and then goes in standby state.
- During charging the battery pack voltage in goes up to 4.2V.
- The cell temperature increases during driving and charging state. Starts falling in standby mode.
- During driving cycle, SOC values go down to 45%. Then it goes up to 100% in charging cycle.
- Once driving cycle starts, current values decrease from 30A to 0A as indicates vehicle standby mode.
Test 2 step
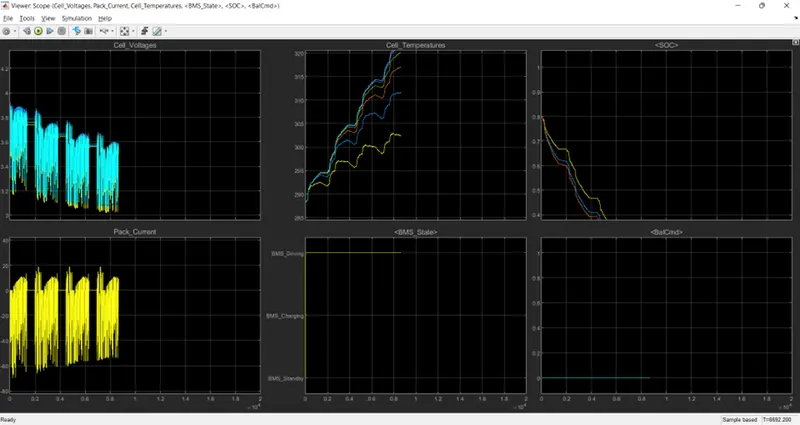
- From below scope of Test 2, we observed very high temperature during Driving cycle phase and it get stop at 8692.2 second time period.
- Due to very high temperature value, charging cycle not run. Hence battery not going charged further.
- Also, SOC discharged in faster rate from 80% to below 40% in short duration of time.
- This high temperature also effect on battery voltage and current parameter badly.
Test 3 step
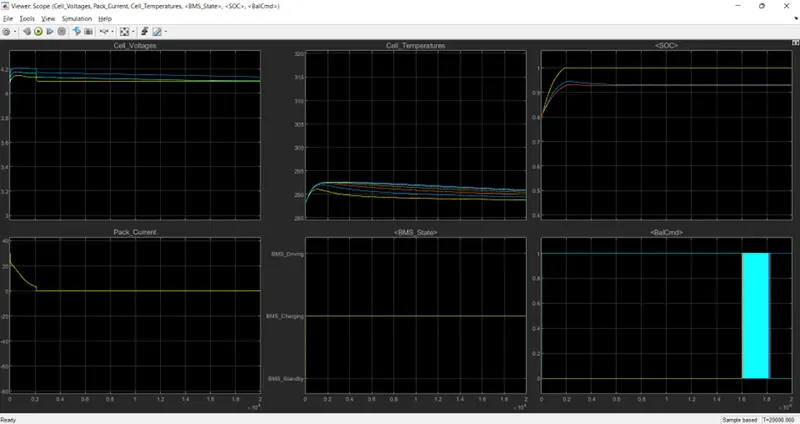
- From Test sequence Variant, we selected test case 3, we have to run the simulation. The dashboard shows there is no error and faults.
- We got scope of test case 3 which consists of the measurement of cell voltages, cell temperatures, SOC, pack current, BMS state.
- From below graphs, there is only single line i.e. charging cycle.
- From SOC graph, it increases from 80% to 100% and then standby mode.
2.What is coulomb counting?
Refer to the above model and explain how BMS implements coulomb counting for SOC estimation?
ANSWER:
Coulomb Counting:
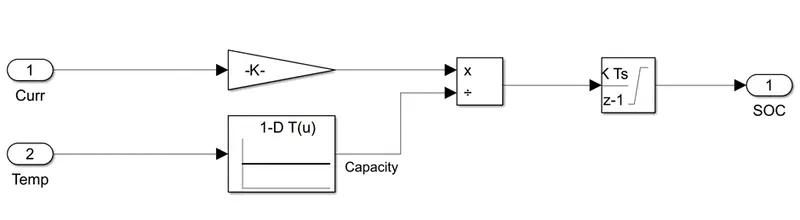
The coulomb counting measures the discharging current of a battery and integrates the discharging current over time in order to estimate SOC.
Coulomb counting method is done to estimate the soc values, which is estimated from the discharging current and previously estimated SOC values.