Week 7 State of charge estimation
ANSWER:
INTRODUCTION:
Lithium-ion battery packs are the predominant energy storage systems in aircraft, electric vehicles, portable devices, and other equipment requiring a reliable, high-energy-density, low-weight power source. The battery management system (BMS) is responsible for safe operation, performance, and battery life under diverse charge-discharge and environmental conditions. When designing a BMS, engineers develop feedback and supervisory control that:
- Monitors cell voltage and temperature
- Estimates state-of-charge and state-of-health
- Limits power input and output for thermal and overcharge protection
- Controls the charging profile
- Balances the state-of-charge of individual cells
- Isolates the battery pack from the load when necessary
DESCRIPTION OF THE SIMULINK MODEL USED:
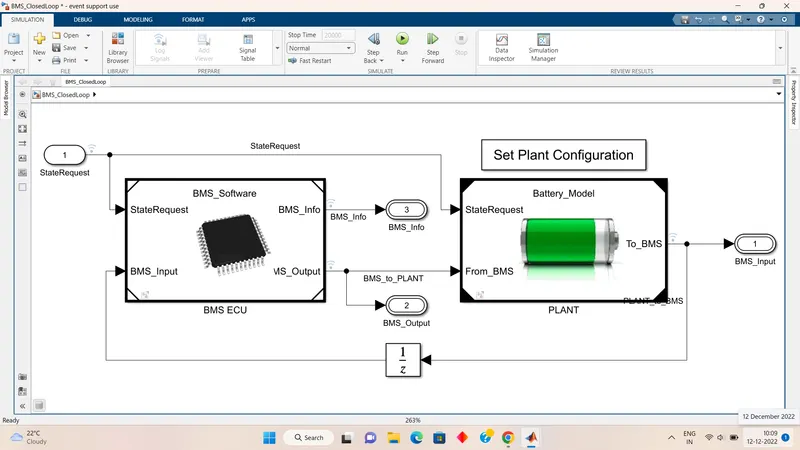
- This model has two main blocks BMS ECU and PLANT block.
- The plant represents a battery and ECU represents software in Matlab and Simulink environments.
- These two are like heart(PLANT BLOCK) and memory(ECU) of the system.
Plant subsystem:
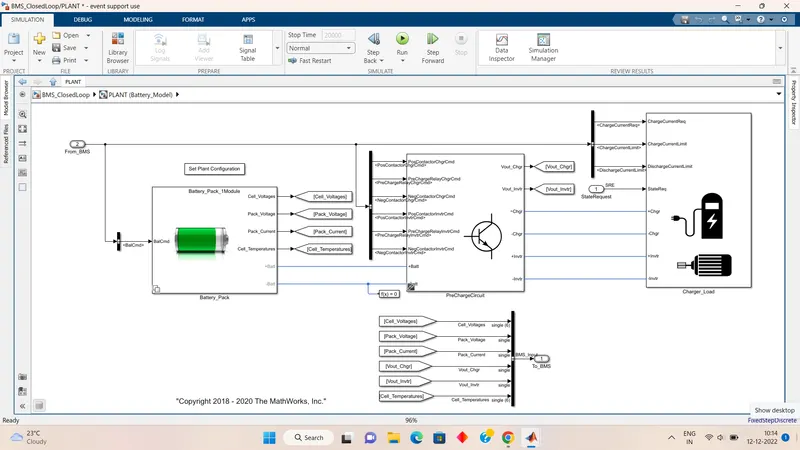
- The heart of the system included the following subsystems.
- This plant subsystem consists of 3 blocks battery pack, pre-charger circuit, and charger block.
- The Pre charger circuit is connected to the charger and loaded as the motor which is connected through the inverter and charger wires to the precharge block.
- Charger and load subsystem consists of charger and motor block which are connected in a parallel configuration.
Charge and load subsystem: Charger:
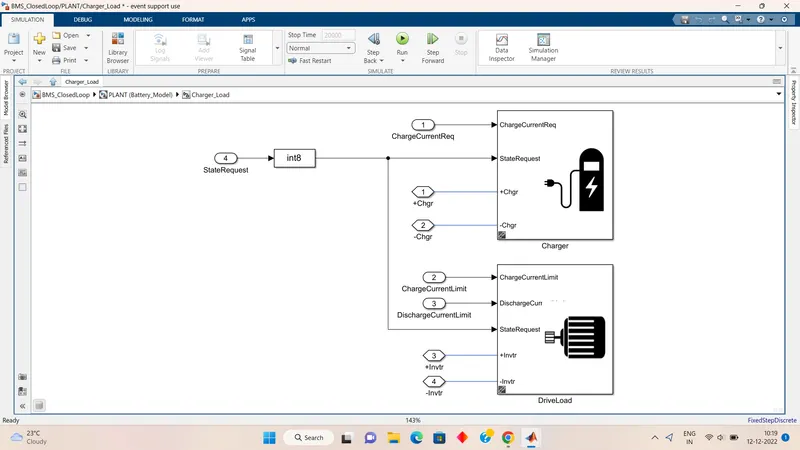
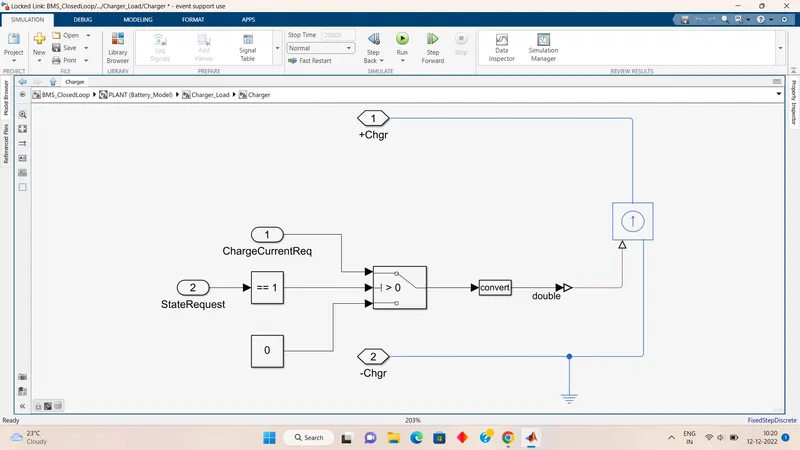
- This subsystem represents the DC driver load.
- This will implement the battery current from the drive cycle this is virtually creating the current draw.
- The current source depends on the battery current drive cycle block.
- This will charge and discharge the battery block.
Driver load:
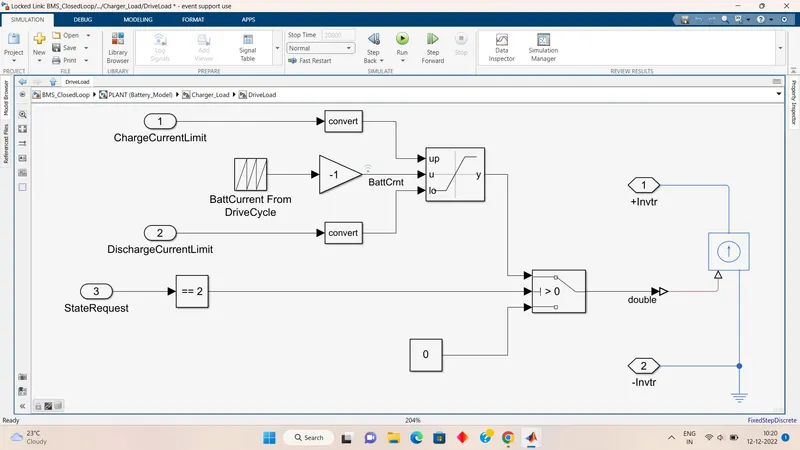
- This will charge the battery in the reverse direction.
- Here the equations represent the charging of the battery in a continuous state.
- This is a continuous charging source.
Battery pack subsystem:
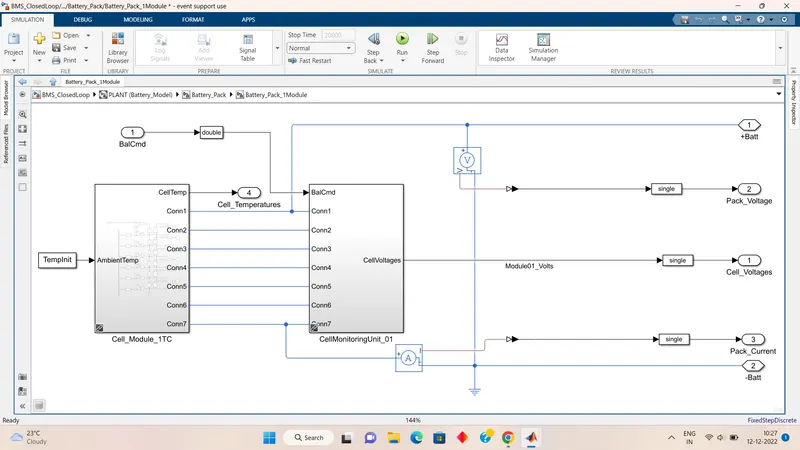
- This represents a cell module block in which we have two sets one is 6 cell and another is 16 cell modules.
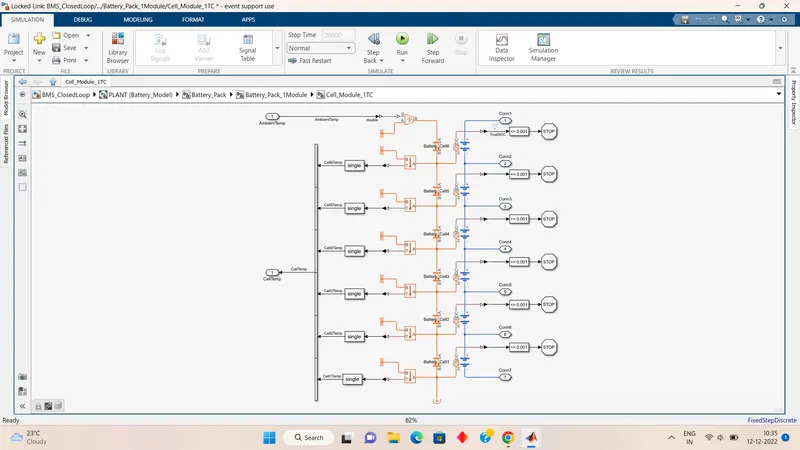
- From 1 cell module block, we get 6 cells connected in series with the temperature port enabled to calculate each cell's temperature and given to the multiplexer through which it will be given to the BMS circuit.
- Connection 1 port gives us the battery positive and the 7 connection port gives us the battery pack negative.
- We can observe here that the current sensor block is been connected in series to the negative port which will give output as pack current value.
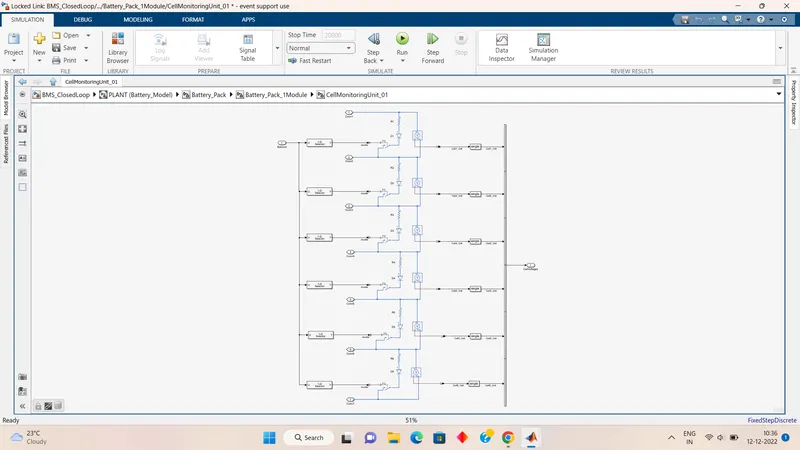
CELL_MODULE_1TC: CELLMONITORINGUNIT_01
Precharge circuit subsystem:
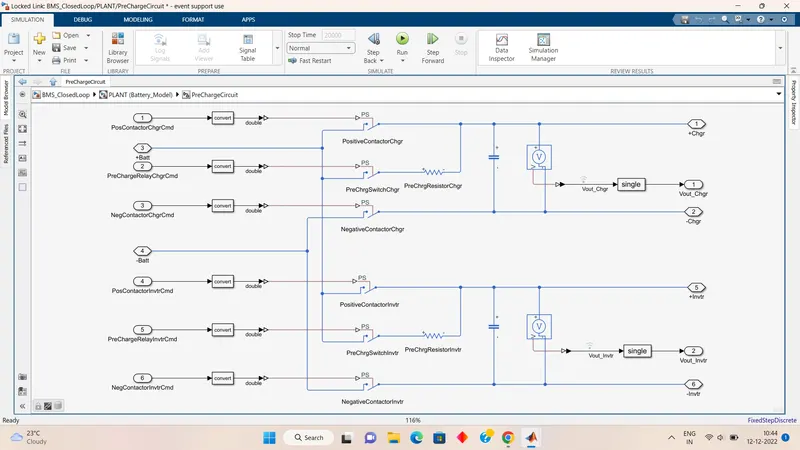
- Basically, the precharge circuit connects and disconnects the pre-charge resistor for the inverter of the charger.
- Here two resistors are used as the current direction is reversed in the circuit.
- precharge relay commands are the input signals used to control the circuit's contactor, which will be on and off.
Testing harness dashboard model:
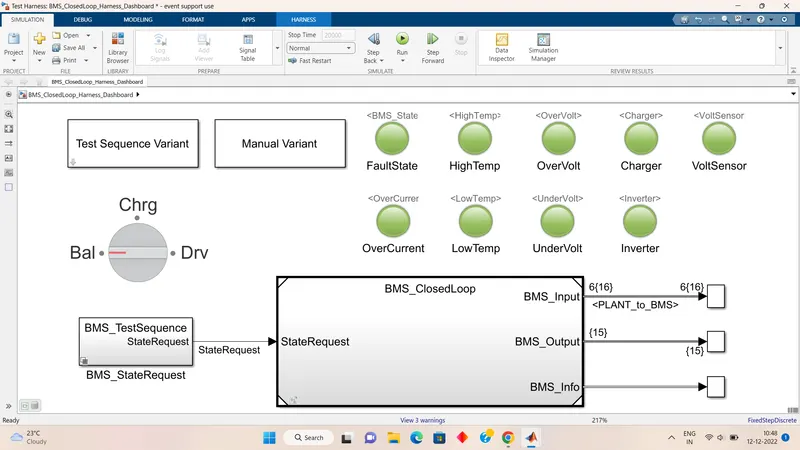
- This dashboard will show us the BMS's current situations and the system's faults.
- If there is green light glowing then there are no faults or if a red bulb glows then there is some fault in the system.
- We also can observe the BMS status on the left-hand side knob like a block which it will show whether the BMS is charging or driving or in a balanced state.
BMS ECU subsystems:
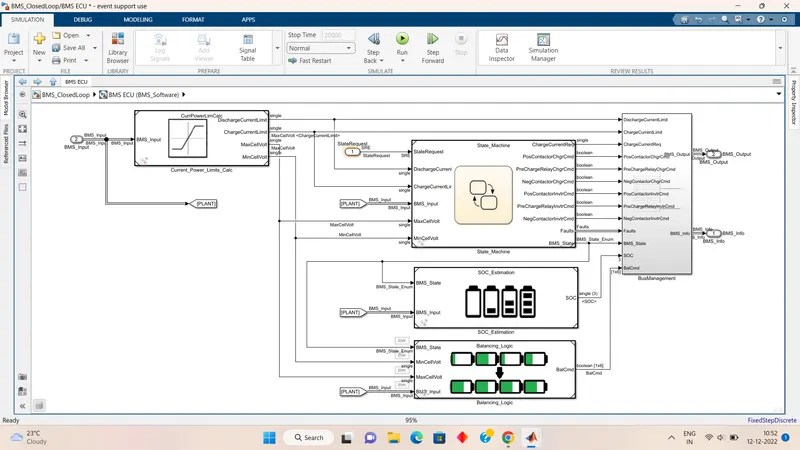
- It consists of 5 sub-blocks which include current power limits calculation, state machines, SOC estimation, balancing logic, and bus management.
Charging and discharging block:
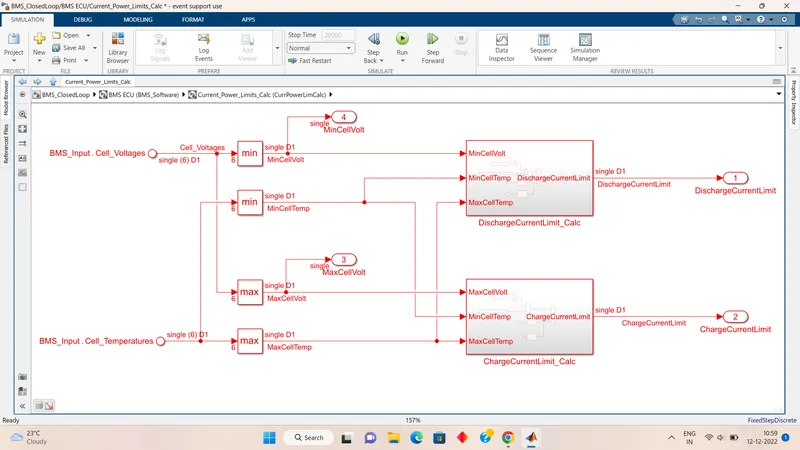
- In this block current and power, limit is controlled by two blocks one is for the charge current limit and another is the discharge current limit.
- Based on 6numberof cells connected in series and minimum or maximum cell voltage current or temperature the limits are calculated for discharge and charge.
- Below are the equation representation in blocks format for discharge and charging calculations.
STATE MACHINE:
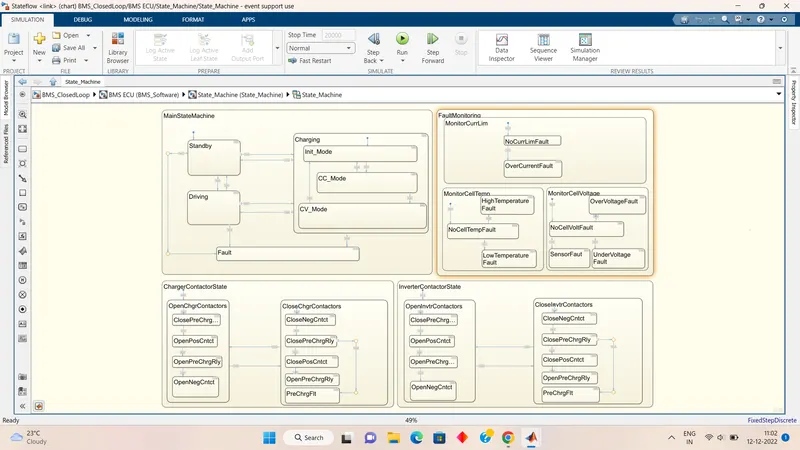
- These all are the algorithms that are going to run inside the state machine block.
- There will be a blue indication while which block or which algorithms are running.
- All cell voltage cell current and also temperature-related calculation algorithms are going to run inside the state machine block.
- The output of the state machine is given to the BMS dashboard.
- There are 3 states in which we have to run the Matlab BMS model.
SIMULATION RESULT:
Input test signal-1:
Here initially battery is 100% charged and the battery is in the driving condition for 3000 sec then it goes under standby condition for balancing the circuits it is for 1000 sec and then after standby, there is a charging period where the SOC of the battery is raised to 100% this process takes 5000sec and the ageing same procedure continues.
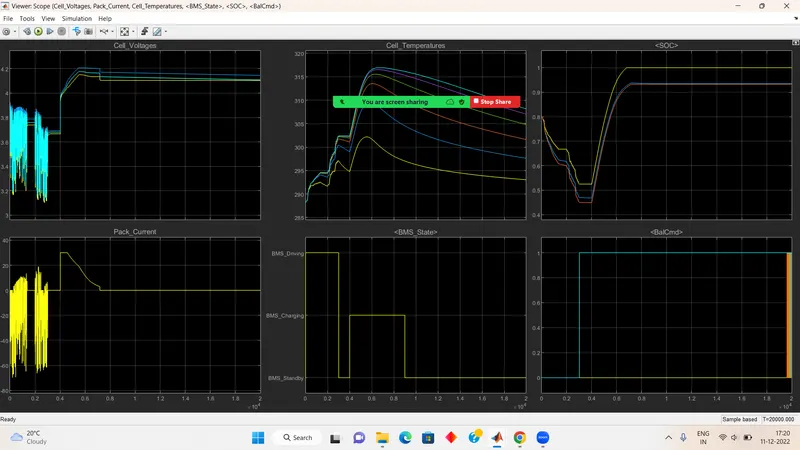
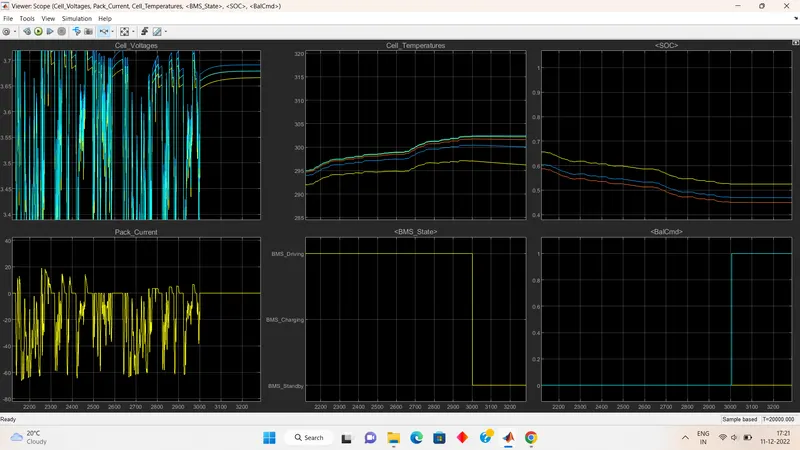
We have a total of 6 plots in the output scope.
- The first plot shows us the cell voltage where it is in driving condition and the maximum voltage attend by the cell is 4.2V. While in the driving state we can observe the fluctuations in the voltage which shows the drive cycle and when the battery is in balancing mode there is stand voltage there is no voltage drawn from the circuit.
- Pack current plot shows the combination of the drive cycle and as we know the load current is implemented by repeating cycle block which will discharge in form of a signal with different certain magnitudes. Negative current represents the discharging state and positively represents the charging state.
- While BMS is rising cell temperatures are increasing. We have different temperatures of each cell this is due to the placement of each cell being different as we go to the center of the battery pack the cell temperature will be more as compared to the outside cell.
- We have to control the difference between these temperatures this should be not the maximum as this would change the capacity of that particular cell with a higher temperature.
- As the Initial state of SOC was 75% then while in driving condition SOC reduces to 60% and there is a standby period where the SOC is constant and after the charging period, the SOC level rises to 100% again.
- The sixth plot shows the cell balancing command for all six cells. The 1st cell is having the lowest voltage and does not need balancing thus we can see that all the other cells signal to have a
the magnitude of 1 whereas the 1st cell signal is at zero magnitudes.
Input test signal-2:
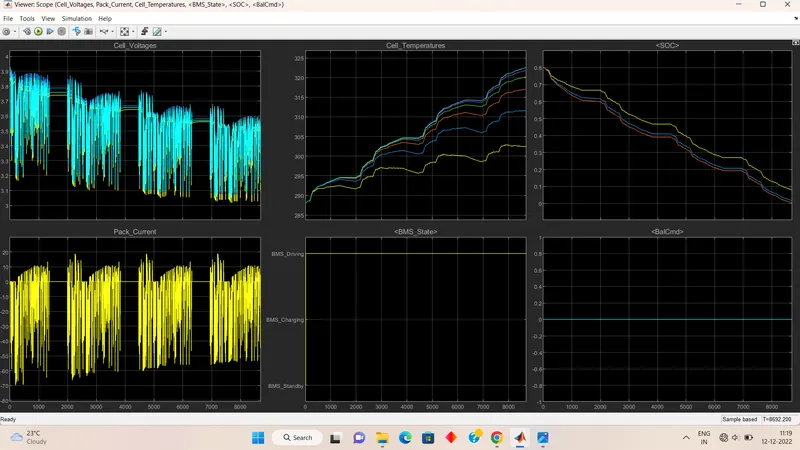
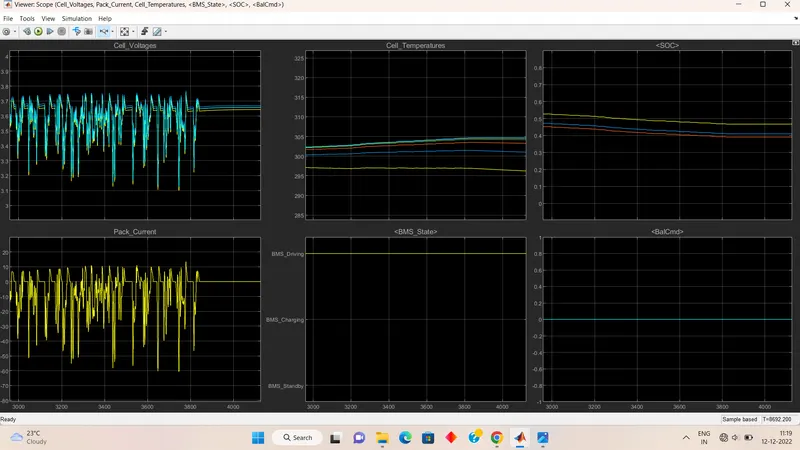
- After 10,000 sec when the driving cycle is over, the fault condition occurs and so the SOC does not increase even for the charging phase.
- cell temperature increases during driving, and since it is higher than recommended, BMS stops the battery from charging, so we can see a gradual decrease in temperature
- The first plot shows us the cell voltage where it is in driving condition and the maximum voltage attended by the cell is 3.9V. While in the driving state we can observe the fluctuations in the voltage which shows the drive cycle and when the battery is in balancing mode there is stand voltage there is no voltage drawn from the circuit.
- Pack current plot shows the combination of the drive cycle and as we know the load current is implemented by repeating cycle block which will discharge in form of a signal with different certain magnitudes. Negative current represents the discharging state and positively represents the charging state.
Input test signal-3:
-
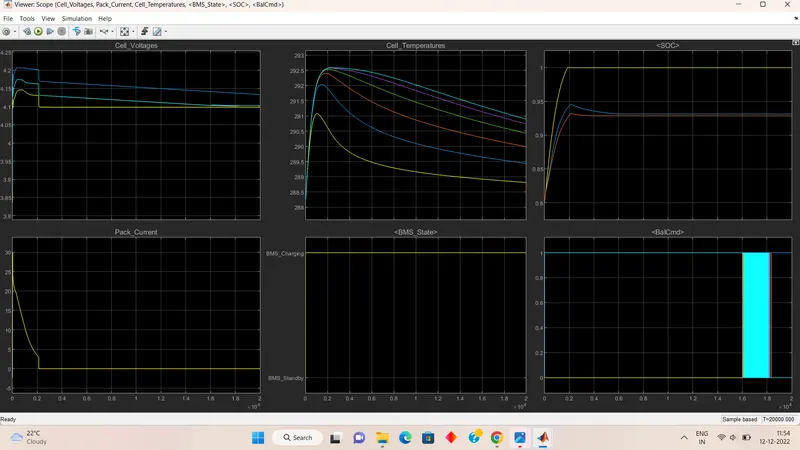
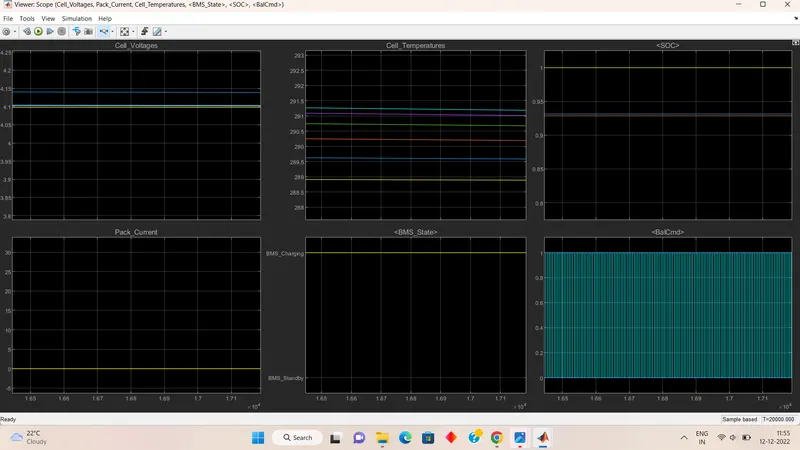
Cell temperatures increased from an initial 288 to a maximum recorded as 292.5 with the difference in temperature rise recorded with another cell temperature estimation graph.
Cell Balancing is operating in this period to ensure the maximum capacity is reached by all the cells while charging in the equal mode of operation and at the period of 1.8 sec, the cell balancing is cut off.
- Cell voltages from 4.2V is deceased to 4.1V and it has been gone constant throughout the system.
-
we can observe the constant current (CC) and constant voltage (CV) characteristics of a battery pack. From Initially 0 sec the cell current increased to 30A and the cell voltages also gradually reached 4.2V this phase of operation is called constant current or CC Mode.
At a time instant of 0.2sec, the cell voltages are gradually becoming constant till the end of the full charging voltage capacity of the battery pack and at this time instant, the current is gradually reduced to 0. So, this mode of operation is called constant voltage or CV Mode of operation.
Generally, cell manufacturers design the CC Mode till the cell reaches 80% of its full capacity and from there the remaining 20% will be considered CV Mode.
- SOC is initially 80% at a time instant of 0.2 sec this is increased to 100% or 1 to its full capacity with variation in different SOC Estimation methods.
2. What is coulomb counting? Refer to the above model and explain how BMS implements coulomb counting for SOC estimation.
Coulomb counting is a technique used to track the State of Charge of a battery pack. It works by integrating the active flowing current (measured in amps) over time to derive the total sum of energy entering or leaving the battery pack. This produces a capacity that is typically measured in Amp-hours.
As we observe the SOC of the cells were different this is due to the different calculation which is done in SOC simulation and balancing block.
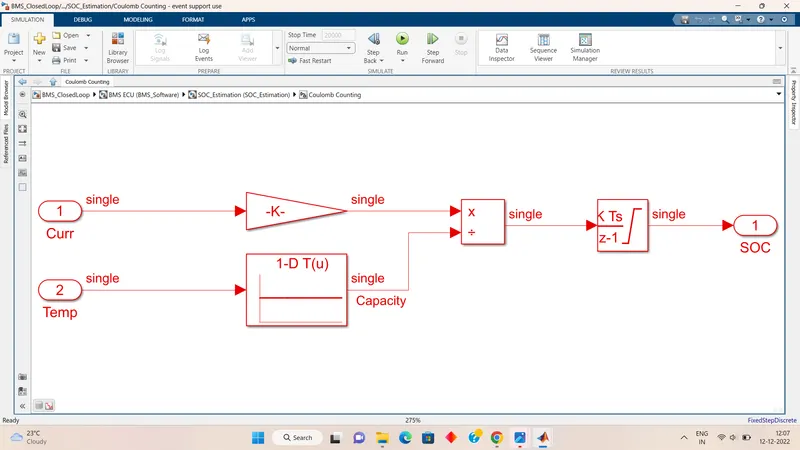
- SOC estimations work in 3 different formats. The first block represents the coulomb counting block and the second block represents UKF and EKF blocks.
- In UKF and EKF there are a set of algorithms that will calculate the SOC values using the Kalman filtering process.
- The coulomb counting is the integration of the current over the period of time in the discrete-time integrator.
- Here the current is been integrated by taking temperature into consideration.
- Discrete-time integrator blocks work in Z-domain.
- Temperature values taken into consideration are fed in lookup table form.
- Here the SOC idea is to get simply by Discrete-time integrator block.
References:
https://youtu.be/5L2ki33tkpg.