Week 7 State of charge estimation
EV Live Batch-21
1.Simulate the 3 test cases from harness dashboard and write a detailed report on the results
Answer:
We are selecting a harness dashboard to perform tests of BMS. In this model, we perform our system's three cases: Driving, Charging, and standby.
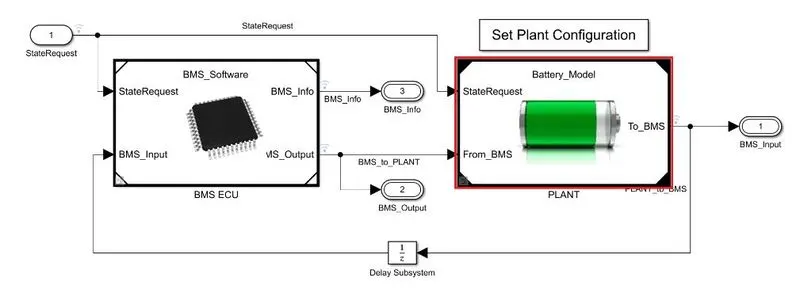
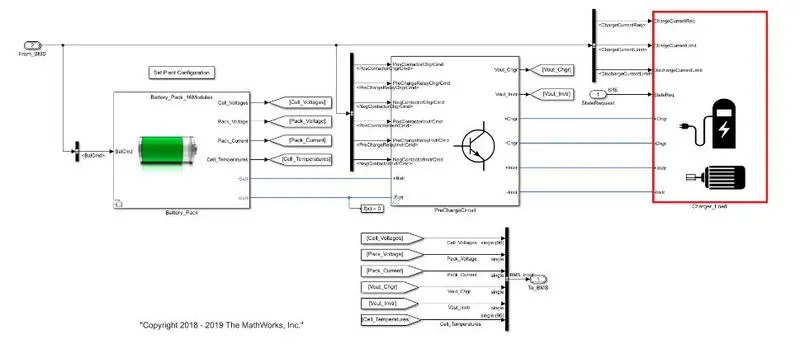
The BMS model consists of a BMS ECU ( Electrical Control Unit ) and a plant. BMS performs supervisory tasks, SOC estimation, contactor management, isolation monitoring, fault detection and recovery, thermal management, and current power limits.
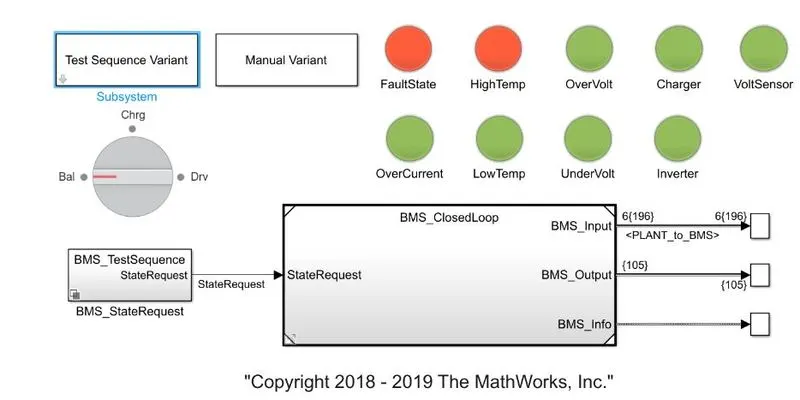
The harness dashboard is shown below. It consists, of the test sequence variant subsystem. This dashboard helps in determining the fault states and other parameters as shown in the figure.
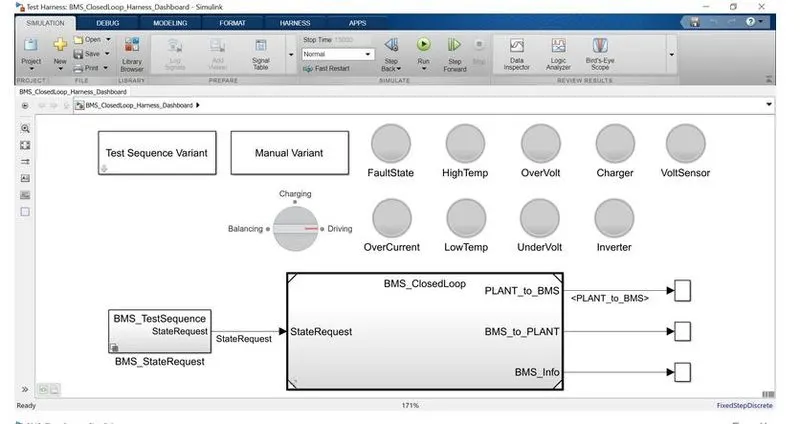
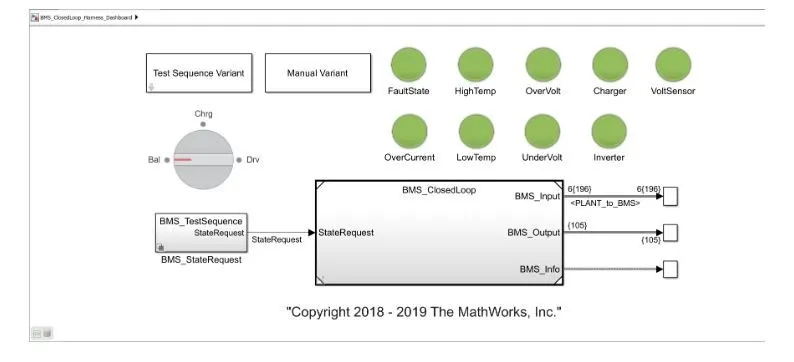
In this system, the green colour indicates that the system is working properly while the red signal will indicate that there is a fault.
Test case -1:
We have to go test case variant subsystem and select test case -1 from there and click OK.
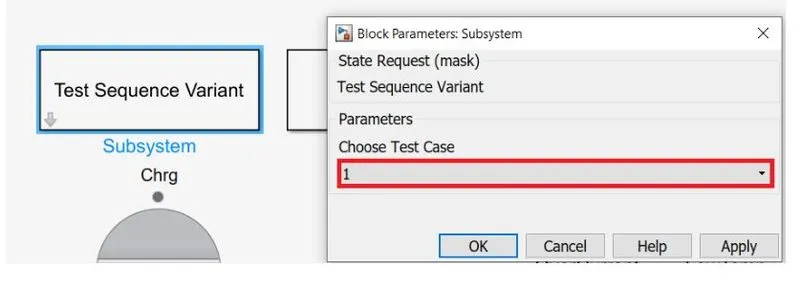
Selecting the first test sequence we check the condition for this particular condition.
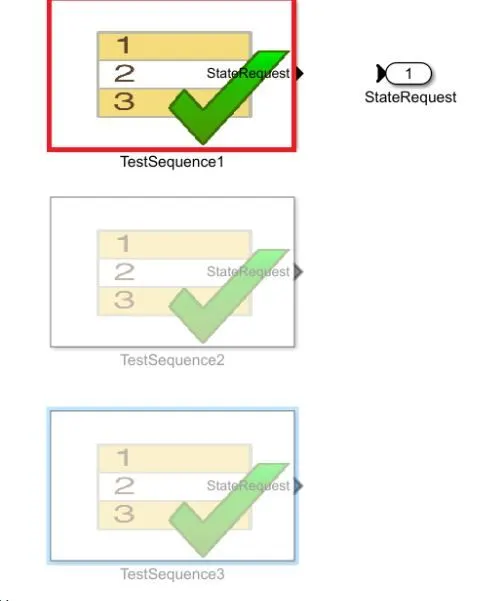
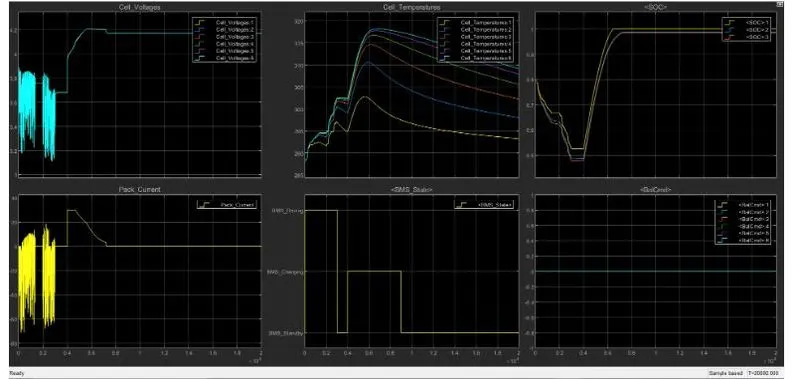
In the system when we start the simulation, the model will be in driving condition, after 3000 sec. it will be in standby mode after 1000 sec. it will be in charging mode.
Now by running the simulation we get,
Conclusion of Test-1:
- Here the thing is Ok, we can see that all the signals are green.
- From the plot we can see that the vehicle is initially in a driving state and charging was done till 90%. After charging it reaches standby mode. It can be seen in the BMS state plot. Battery temperature increases in driving and charging. Battery Voltage was increased to 4.2V while charging. The current plot shows the value of current supplied to the vehicle while driving. SOc decreased up to 50% in driving conditions and it was increased while charging.
Test Case -2:
In this case, has two phases for the battery pack i.e. driving and charging phases. If We click on "BMS_state request" the following system opens up. Now we have to select "BMS_Test Sequence".
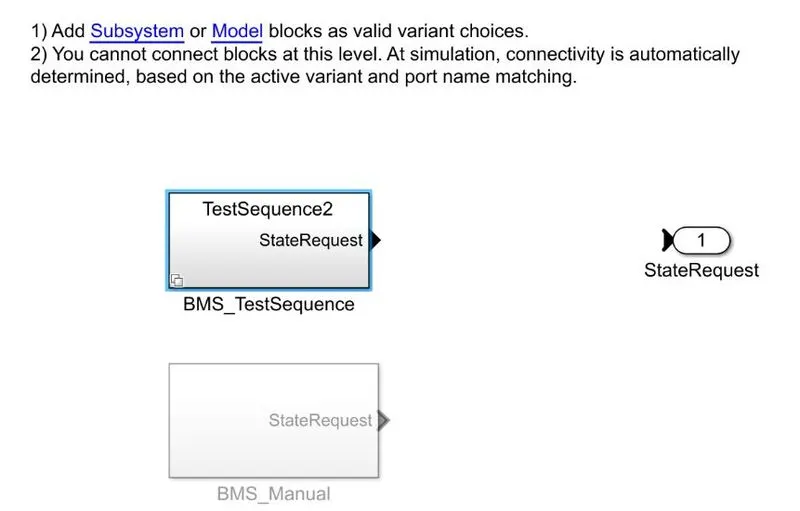
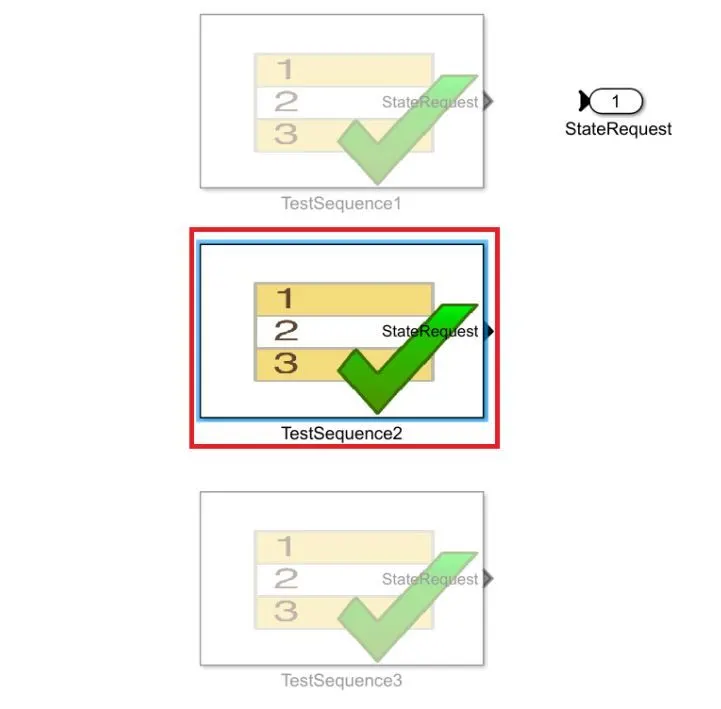
Selecting the second test sequence we check the condition for this particular condition.
The harness dashboard is in this condition.
In this simulation for the first 10,000 seconds battery was tested on driving conditions after that charging phase will be started.
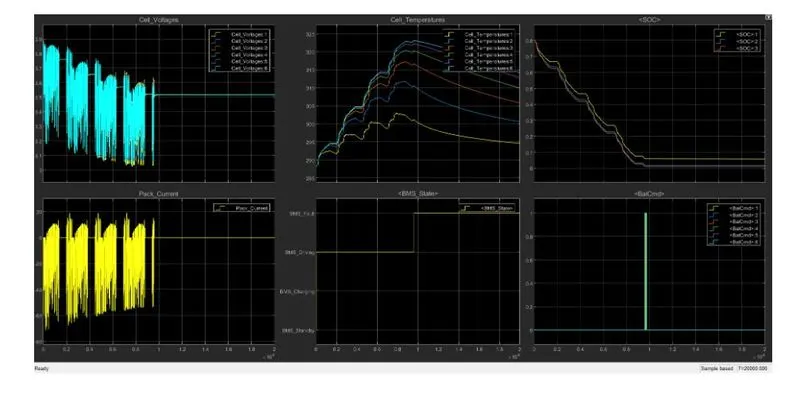
Result:
- Here we can see that faults are generated in this condition, this is " High temp.".
- From the plot, we can see that in the driving state temperature of a few calls are high, due to this our SOC is settling down from 80% to 0% which means the battery is completely discharged due to temp. of battery is high so the charging is not possible because it's lead the permanent damaged or battery peak may catch fire.
Testing Case -3:
The last test is for the third test sequence. For this, we have to go to the test case variant subsystem and select test case -3 from there and click "OK".
In this case only a single phase here for the third case, i.e. the charging phase.
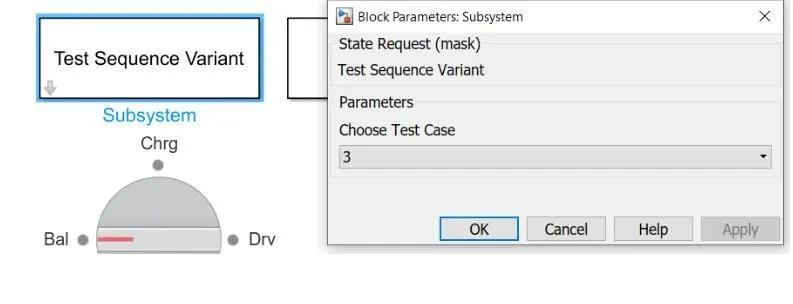
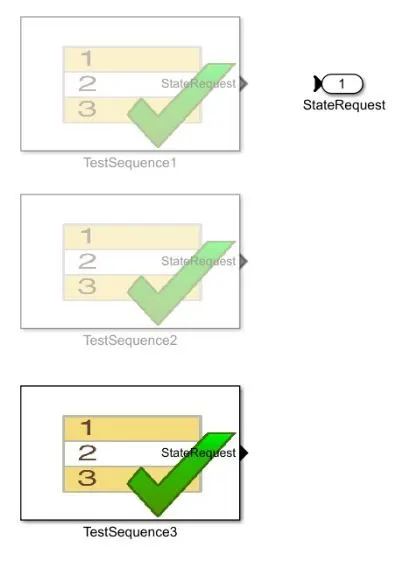
Selecting the third test sequence we check the condition for this particular condition.
for this, condition harness dashboard be like,
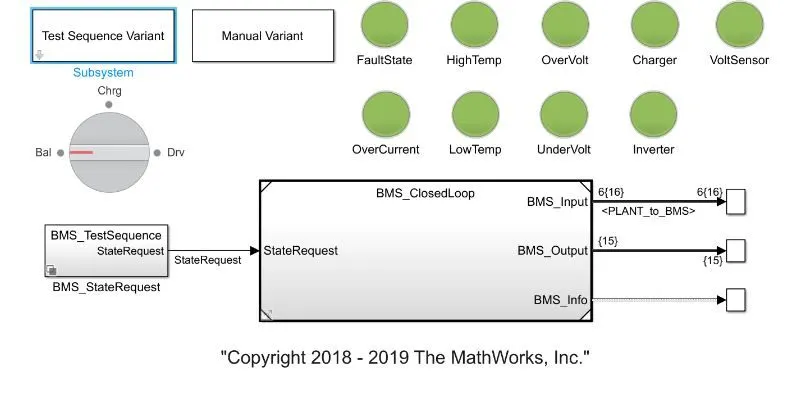
result of this simulation,
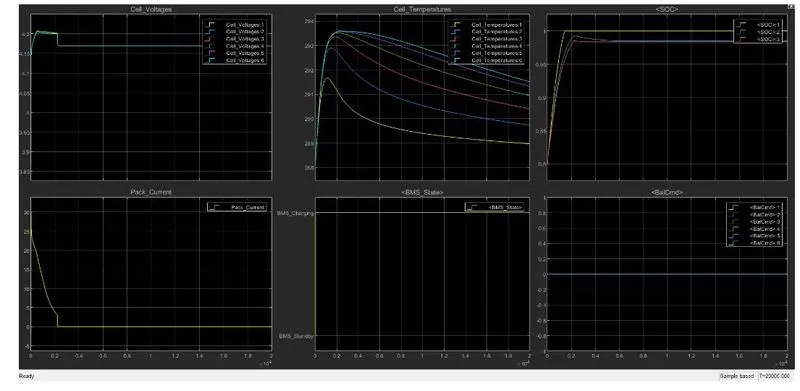
Results:
- From the above results we can see that thing is normal in the charging state our SOC is increased from 80% to 100% and the battery temperature rises when charging takes place after that temperature of the battery just settle down.
2. What is coulomb counting? Refer to the above model and explain how BMS implements coulomb counting for SOC estimation ?
Answer:
Coulomb Counting Method:
The coulomb counting method measures the discharging current of a battery and integrates the discharging current over time in order to estimate SOC. The coulomb counting method is done to estimate the SOC(t), which is estimated from the discharging current i(t), and previously estimated SOC values, SOC(t-1). SOC is calculated by the following equation.

But there are several factors that affect the accuracy of the coulomb counting method including temperature, battery history, discharging current, and cycle life.
Modified Coulomb Counting method:
To improve the coulomb counting method a new technique called the modified coulomb counting method is proposed. The modified coulomb counting method uses the corrected current to improve the accuracy of estimation.
The corrected current is the function of discharging current. There is a quadratic relationship between the corrected current and discharging current of the battery. By the practice of experimental data, the corrected current is calculated in the following form.

Where k2, k1 and k0 are constant values obtained from the practice experimental data.
In the modified coulomb counting method, SOC is calculated by the following equation:
The experimental results show that the accuracy of the modified coulomb counting method is superior to the conventional coulomb method.
From the given model by MathWorks as shown below of the BMS closed-loop model, when seen inside the BMS ECU,
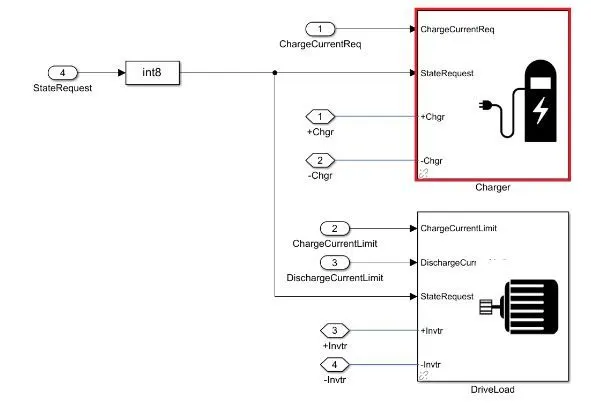
Inside the plant subsystem:
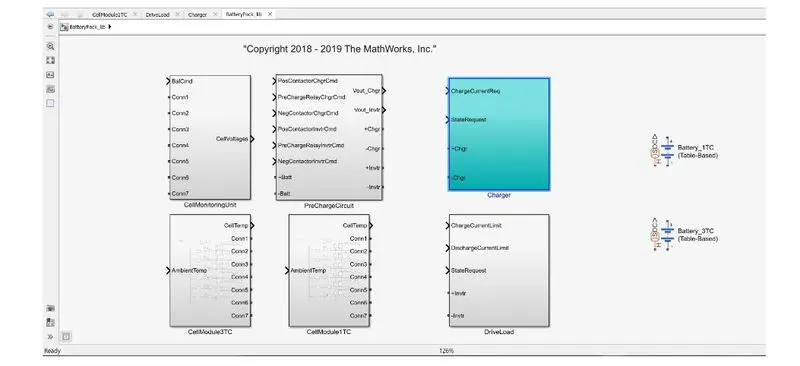
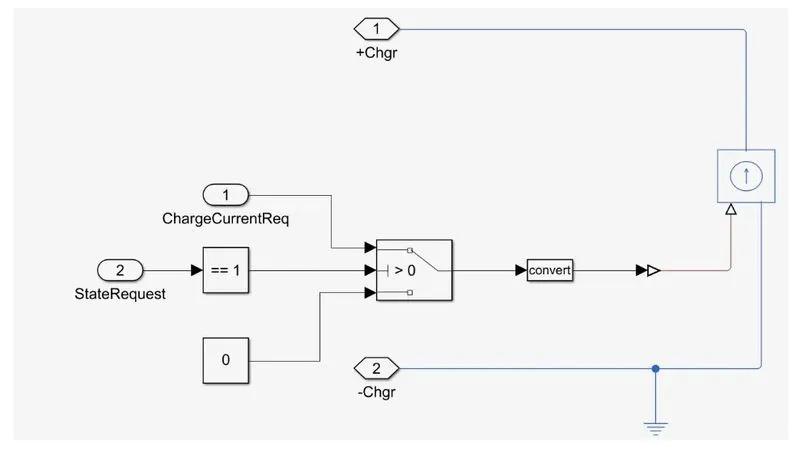
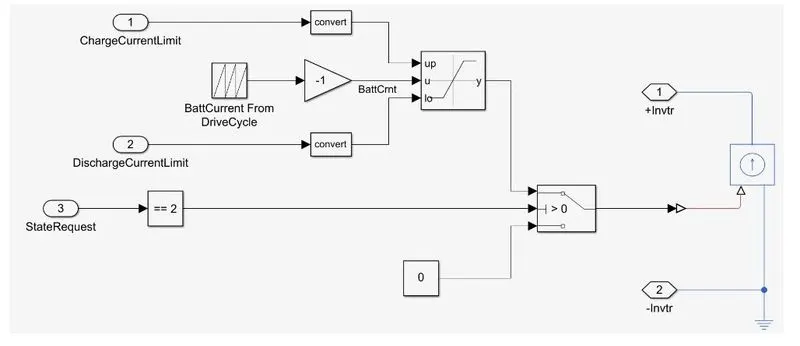
The main advantage of coulomb counting is its simplicity and low computational cost. Temperature and current are taken as input from the battery. The current signal is given to the gain block and the temperature is given to capacity as it varies according to the temperature. This output is given to another block where it is divided by capacity and henceforth the SOC is estimated.