Week 7 State of charge estimation
1.Simulate the 3 test cases from hardness dashboard and write a detailed repot on the result.
2.What s columb counting? Explain how BMS implements coulomb counting for SOC estimation?
1.Simulate the 3 test cases from hardness dashboard and write a detailed repot on the result.
Objectives:
First thing we are downloading the document from the given link .then extracting the zip file to get file from the floder.
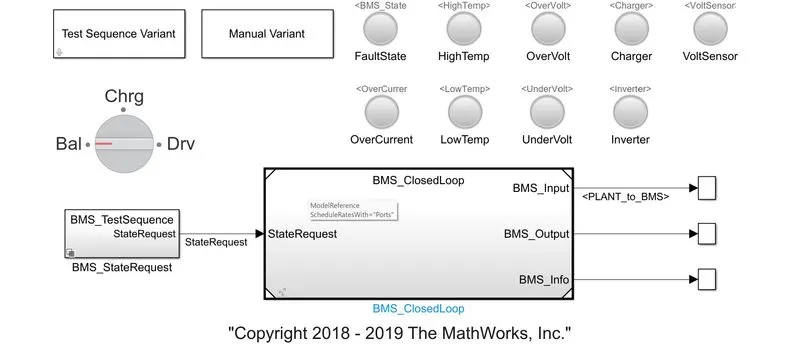
1.Dashboard
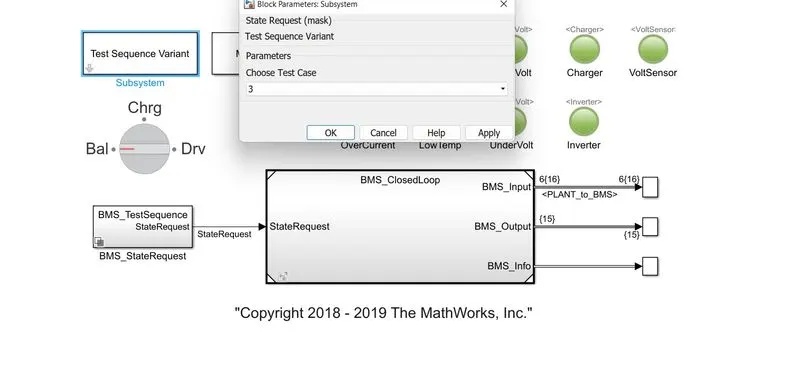
- Select the test Sequence varient
- Manual varient
- BMS-test sequence state to provide sate request commonds
- Lamp are indicated faluts sate,high temperture,over voltage,over current,charging,voltage sensor,low temperture,if any falut in these cases it indicates in red color and if it is all in good condition it will indicates in green colour.
- Rotating switch for manual varient changes while running simulation.
- In the scope the result will be displayed.
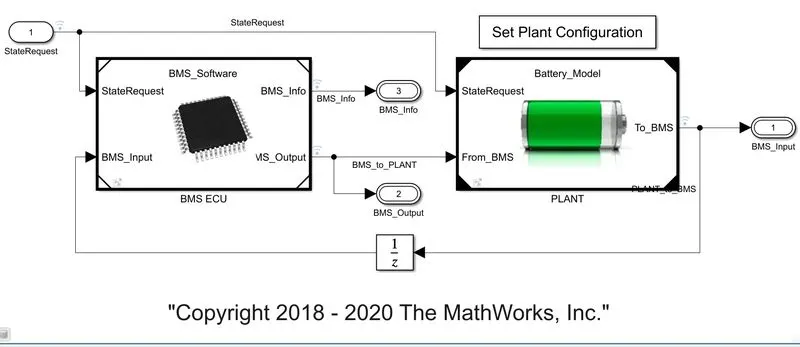
2.BMS CLOSED LOOP
In this main block it consists of two subsystems,BMS ECU and PLANT UNiTS
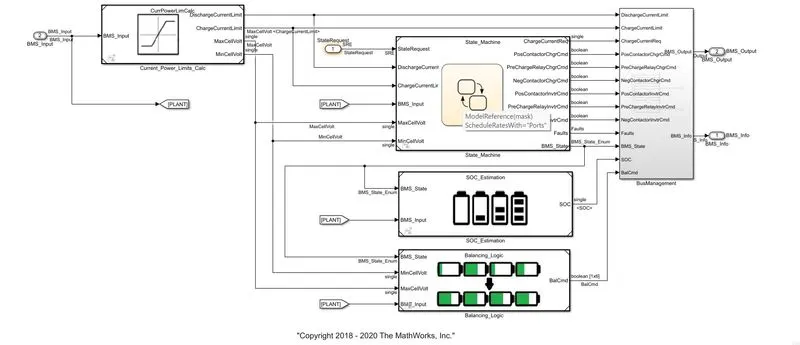
In this BMS ECU unit the current power calculation are done used in sate machine block,SOC,estamination,cell balancing logics.
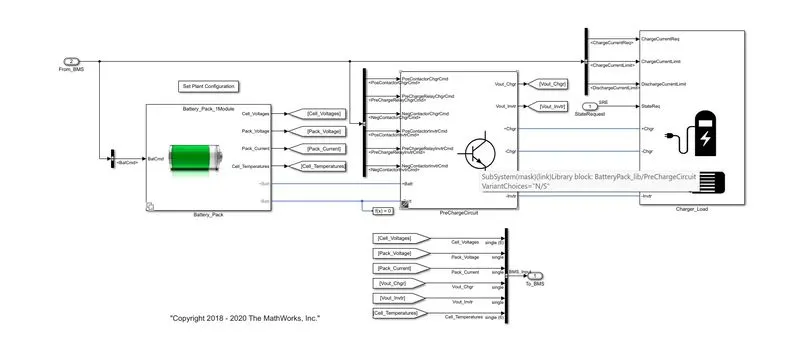
In plant unit battery pack pre charging unit are created.
In battrey pack there are two types of configurationas 1 module(6cells) abd 16 modules(90 cells).
A. To run case we have to test the three cases for thid model by selecting test sequence varient and case one by one.
Test case 1.
Selecting the test sequence varient dialogbox.
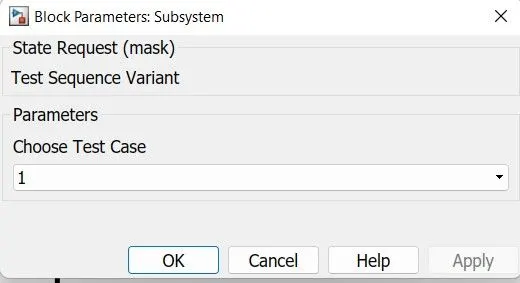
Than selection consists of selection changes in masked BMS_State request subsystem as
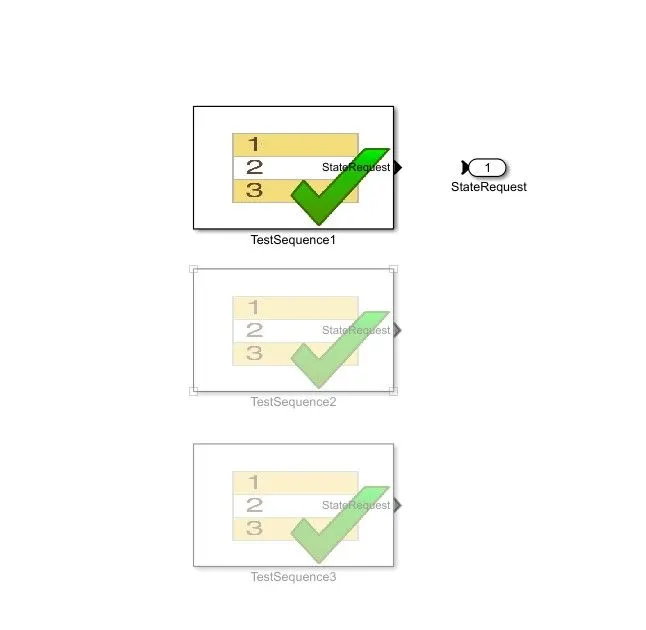
Here the above sequence
- Driving fro first 3000 sec
- After 3000 sec satrt balancing occures for next 1000 sec.
- Then charging and balancing occurs for next 5000 sec.
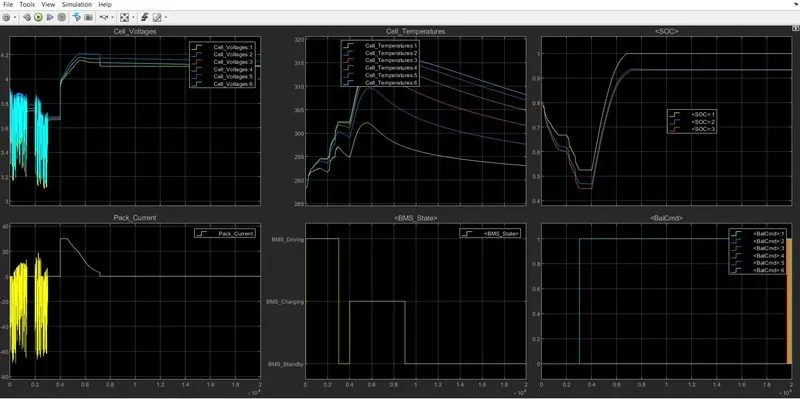
From the result we understand the resukts like voltages tempertures of cells through this graph as shown
For first 300 sec all 6 cells are in drive model where discharging occurs majority and in standby model for lesser duration at approximately 1000 to 2000 range.
The voltage varies from 3.1V to 3.9 v in this range
From 3000 sec to 4000 sec cell balanceing ocuurs and in this stage the module i standby mode and voltage is constant at nearly 3.7V.
After 4000 sec charging occurs,voltage raised from 3.7V to 4.2V at constant current as nearly 30A abd after 4.2V as constant current reduces from 30A to 2.6A
At end of discharge and cell balnecing occurs upto 9000 sec.
After 900 sec post charge cell balanceing starts,All cell voltage are balanceing to a voltage with respest to cell 1 to 4.1V as shown below,in this stage the pack is in standby mode.
intally upto 3000 sec balanceing was not performing.
After 3000 sec cell balanecing start with a cell 6 and 2 they raised
Test Case 2
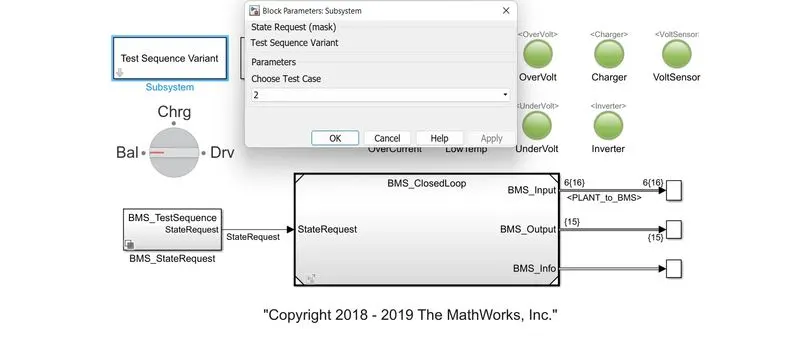
Then seclection consists of selection changes in masked BMS_state request subystem as
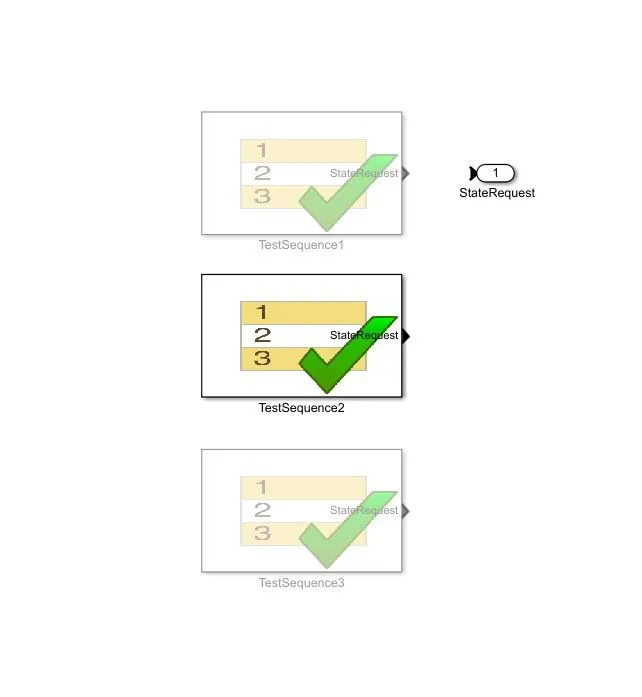
Now run the model and result can be viewed.
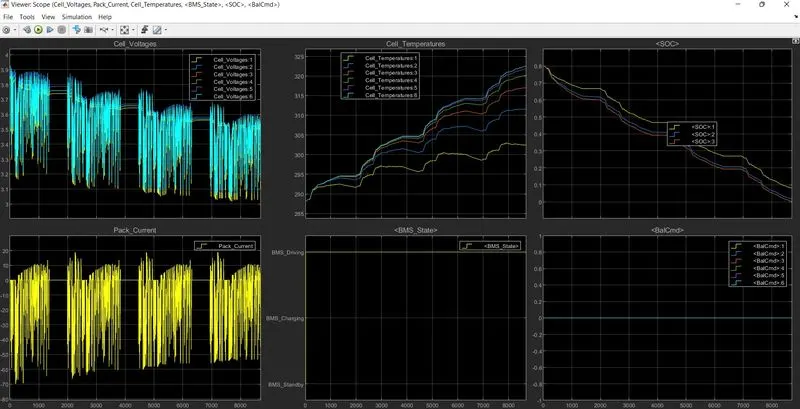
Here in these plots only driving mode of battery is plotted.
Cell voltage and cyrrent pack.
THE cells voltage varies maximum 3.9 v and reduces to 3.05V cut off voltage upto 9000 sec.Entire capacity drained at 9000 sec.
THE pack current discharge upto maximum 70A and sight charging ocuurs during the overall drive.
Some standby by mode condition are in between the drive modes.
Cell tempertures
Here cell 1 having lesser temperture variation from 288K to apporximately 302.K
Cell 6 having higher temperture varation from 288K to apporximately322.5K.
The cellstemperture are sightly reduceing in between the drive modes as thease durations are in stand by modes.
Battery module state
Entire sequence is performing in drive mode as shown from the above plot.
Small duration of standby modes are not plotted in this plot as simulation upto 10000 sec command is give as drive mode.
But in actual practical situtaion standby modes are not present as battery current drains by other small auxilaries of EV'S.
Test case 3
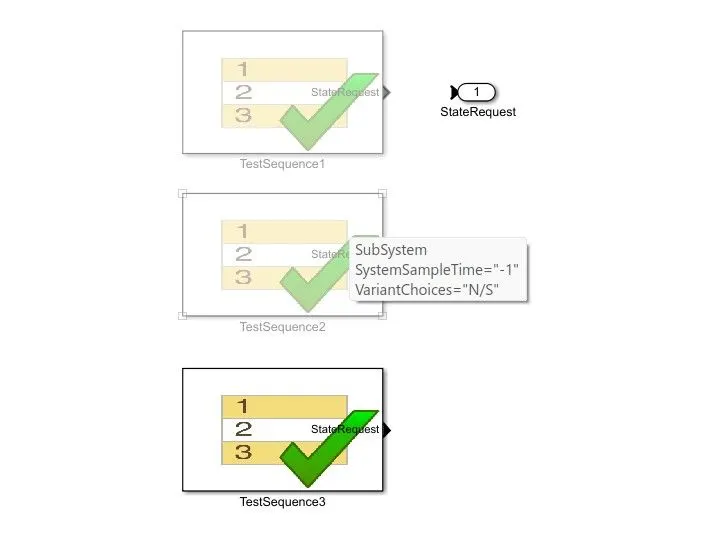
Resuls
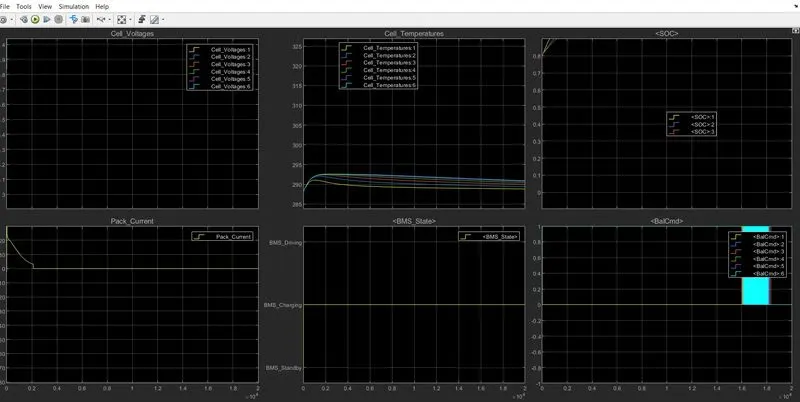
Intially cell 2 ,voltage rises from 3.9V to maximum 4.2 V and stabilised to 4.15V
Cell 1 reises from 3.85V to 4.1V and stabilisssed tom 4.0V
The battery pack detalis raised from 0A to 30A andd starts to reduse t garadually at end of full charging upto 2000 Sec.
At 2000 sec the pack is fully charged to 100%.
After full charge crrent flow will be cutoff as shown in result plot.
Concuision
Hence from the above three test cases the performance of BMS on various factors are discussied and analysed.
2.What is coulomb counting? Refer to the above model and explain how BMS implements columb counting for SOC estimation.
Columb counting is a technique used to travk the state of charge of a battery pack. IT works by intergrating the active flowing current over time to derive the total sum of energy or leaving the battery pack.This produces a capacity that is typically measured in Amp-hours.
The state of charge of battery describe the difference between a fully chaeged battery and the same battery in use. it is associated with the remaining quantiy of electricity available in the cell.
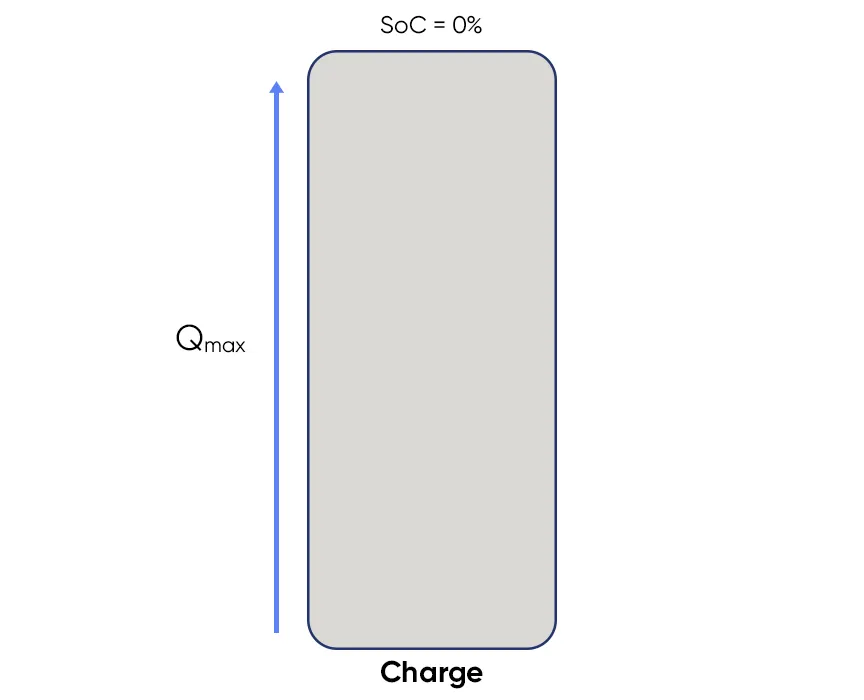
It is defined as the ratio of the remaning charge in the battery,divided by the maximum charge that can be delivered by the battery.it is expressed as percemtage as below.

Q0/mAh = initial change in battery.
Q/mAh = the quantityof electricity delivered by or supplied to, the battery.IT follows the convenstion of the current.It is negative during the discharge and positive during the charge
Qmax/mAh = The maximum charge that can be stored in battery.
SOC0/% = THe initial satae -of-charge(SOC/%) of the battery.
- If the battery is new:Qmax =Cr and Q0 =-0.5Q max generally.Cr is the rated capacity of the battery as given by the manufracturer
- If the battery is fully charged Q0 =Qmax and SOC0 = 100%.
. 
The state -of-charge may also be considered the other way around and it is called the depth ofdischarge DOD.It is calculated as followed.
