Week 7 State of charge estimation
So, Basically Our question is divided into 2 parts:-
For first part we have subdivision into 3 more parts i.e 3 test to be simulate & second part is coulomb counting and explaining the BMS implements
So dealing with first part i.e 3 test cases:-
TEST-1
So, first test was run for 20000 seconds i.e 5hrs 33min 20secs & the varing parameters are cell voltage, cell temp, soc, current, bms, balancing.
Lets analyse the test,
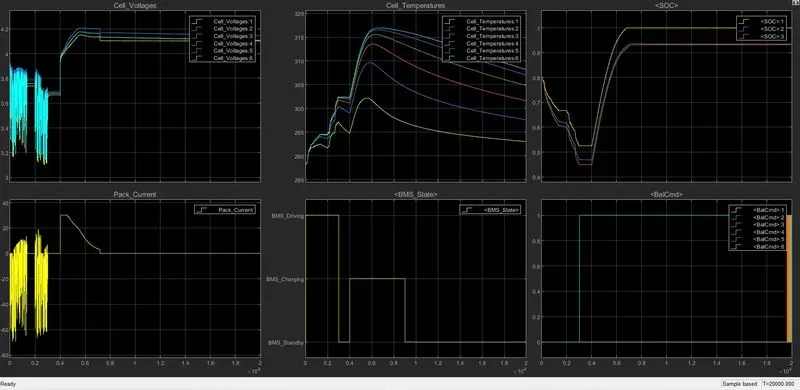
When we see BMS state graph we found that for 3000 secs the vehicle is driving , so for 3000 secs the voltage, current changes drastically and in very irregular manner this is because while driving there is load, friction, drag, accn, de-accn, brake all these are changing by road condition thatswhy there is very irregular , very often frequent , peak & valley type pattern is generated. Similarly for temp & soc (in driving zone) , temp is ultimately increasing with very irregular pattern this is because battery is discharging, so by resistance & chemical reaction the temp increased, also for SOC it falls from 80% to 45% in irregular pattern , the reason is same i.e road loading conditions. One last parameter i.e balancing , so during driving period the graph is at zero level means there is no balacing occurs during this zone.
Now next zone is BMS standby & it occur for about 1000 secs i.e (3000 to 4000sec) so, basically during this time the voltage , current & SOC are truly constant , whereas For cell temperature, the most of the cell have constant temp in this zone except first 2 cell which have slope hence temp decreases while in standby mode, this is because I think the first 2 cell are more exposed to ambient compare to others so first 2 cell can readily do convection with outside air hence temp significantly decreases. While the last parameter i.e balancing occurs instantly within no time.
After That we have last zone i.e charging & it occurs for 5000 secs (4000 to 9000 secs) so, in this zone the voltage increased linearly and became constant while the current decreased rougly linear and became constant, while SOC became 100% linearly and then constant , Now for cell temp there is very steep increased in temp of each cell this is because the charging current and voltages are high as compare to discharging hence there will be more heat energy genrated as compare to discharging. And balancing had already occured.
After That the battery goes to standby mode again from 9000sec till last value and all the parameters are in constant except cell temp , so the cell temp linealy decreasing this is because no matter how the battery was packed but the law of nature still exist that is heat convection so heat flow was exist through convection which results in loss of heat from battery to environment hence the temp decreased linearly while in standby mode.
TEST-2
So, second test was run for 20000 seconds i.e 5hrs 33min 20secs & the varing parameters are cell voltage, cell temp, soc, current, bms, balancing.
Lets analyse the test,
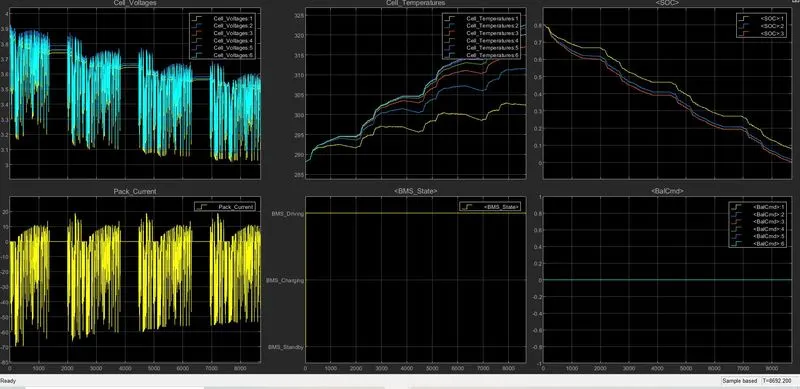
Basically 2nd test was failed in mid-way at about 8692 secs , when we observe the pattern of voltage & current we can see that there is 3 times interval in between the graphs and when I measure the interval by cursor I came to know that it is equal interval of time 645 secs , So i can conclude that these are from signal generator with in the coding of simulink & that has to run for 20000 secs, so basically it was repeating the whole signal. Now look at BMS state it shows that vehicle is in driving mode till end , after that see the SOC graph which basically shows 2 out of 3 battery has reached 0% which is fully discharged & 1 out of 3 battery is below 10% which is of no significant use . Thats why the simulation stops at 8692 secs because at that point of time the battery is fully dead. While the voltage was ultimately decreased due to driving load & cell temperature was increased due to discharge & when there is constant voltage then temp lines in that range also become constant this is because at that point of time there we can assume standby and Finally the balancing parameter has no effect .
TEST-3
So, third test was run for 20000 seconds i.e 5hrs 33min 20secs & the varing parameters are cell voltage, cell temp, soc, current, bms, balancing.
Lets analyse the test,
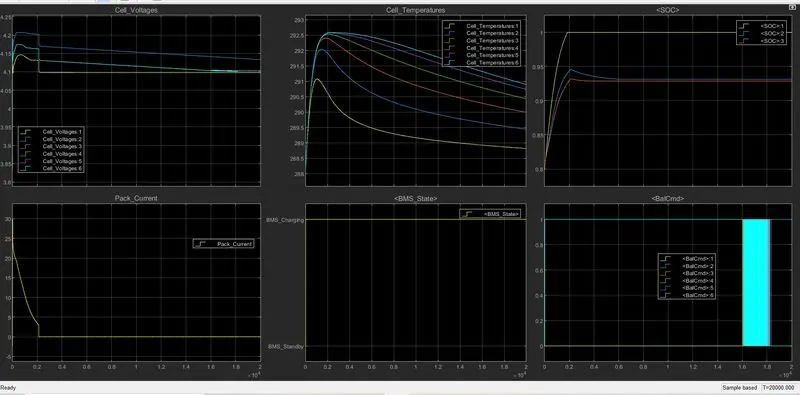
This is the case of charging only , So here we can see that all the battery have initial charge of 80% , and when charging process starts we can observe that the battery temp and SOC increased steeply linearly upto 2000 secs, after that one of the battery which is yellow in color had attained 100% of SOC. As one of the battery attained 100% the current goes to 0 (see the current graph).
From 2000 to 6000 secs 2 battery SOC are trying to attain same charge thats why they are coming close parabollically when it became constant they have about 94% charge.
From 6000 sec to last the SOC and current are constant i.e 94% and 0 respectively & from 2000 sec to last the cell temp decreased linearly followed by small parabollical path at stating phase, and from 2000 to 16000 the voltage of each battery falls linearly.
NOW we will deals with the main transient part of charging that is 16000 to 18300 secs , in this range all other parameters are same but voltage and balancing have critical changes , lets first see the zoomed graph of this specific part .
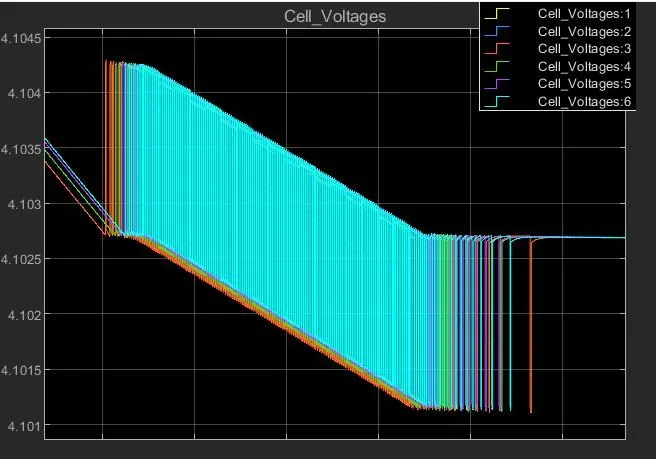
\\ This is zoomed Voltage picture-1\\
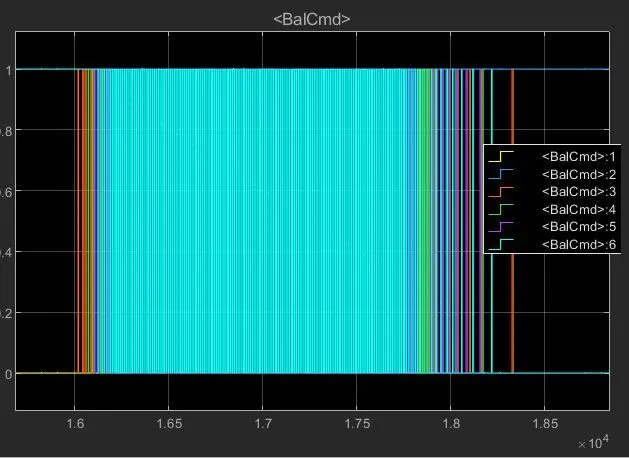
\\ This is zoomed Balance picture-1\\
Now lets see more zoomed pic of voltage & balance.
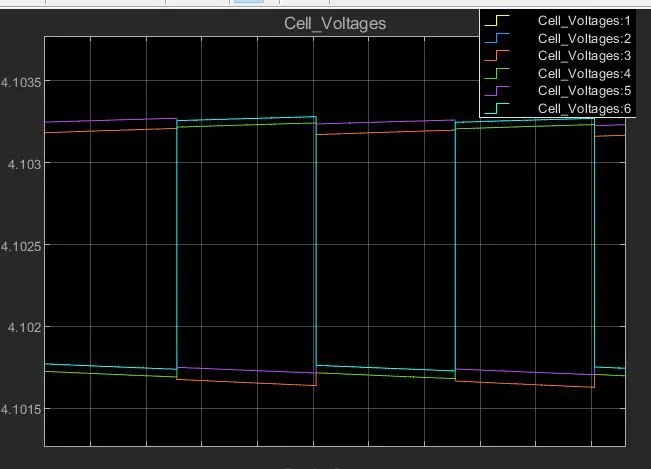
\\ This is zoomed Voltage picture-2\\
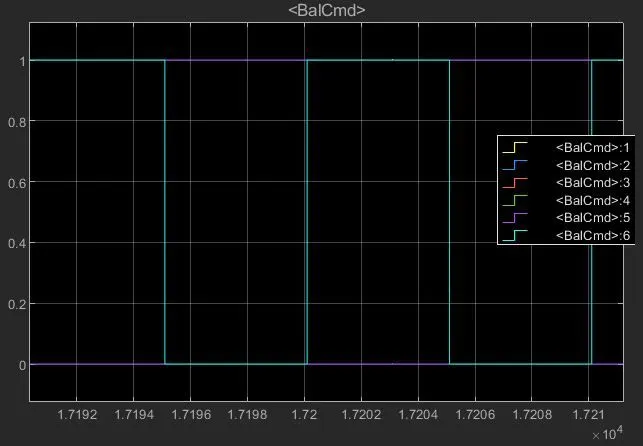
\\ This is zoomed Balance picture-2\\
Here we can see that there are 6 battery, and all have voltage very very near means all battery have voltage of 4.10V. Now all of the battery have voltage change of third digit after decimal say 4.103 or 4.102 volts .Now all the battery contineusly wants to charge one another, because 0.03 is greater than 0.02 , thats why we have spectrum like graph. See the zoomed picture 2 of voltage which clearly shows that when blue falls down purple goes up and vice-versa, we can say in lumsum language that there is voltage ocsillation in this range, In this way all battery voltages ocsillates within themself.
The same occurs for balancing purpose that is one try to balance other at same time it loose its own balance then again some other tries to balance and the process continues thats why we see square wave type of plots when we zoomed. plz see zoom balance picture 2 .
But after 18000 sec untill last all the parameters became constant.
Now dealing with second part i.e coulomb counting & BMS implements coulomb counting for SOC:-
The ‘coulomb counting’ or CoulCount method was developed by Schmitt et al. It depends on the recording of the current noise only. The signal is filtered with a high-pass filter with a cut-off frequency of 0.01 Hz. The filter may be either analogue or digital.The absolute value of the measured current samples is then summed over time.
To determine available capacity, coulomb counting relies on the integration of the current drawn from and supplied to a battery over time, as given by
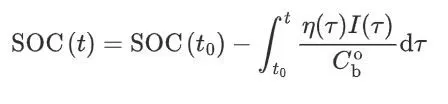
where "I" is the current and "n" is the efficiency during charge and discharge operations . Coulomb counting is advantageous in terms of a simple structure and its ease of implementation. However, some problems make it difficult to accurately estimate battery SOC by coulomb counting. Because battery capacity and efficiency are significantly influenced by operating temperature and current direction, these factors should be considered to correct for battery SOC. Sensor accuracy is also important because accumulated errors can lead to a drift in the estimated battery SOC. Furthermore, one of the main problems in coulomb counting is that it is necessary to calibrate the initial battery SOC. In several applications, the initialization involves rest and the initial SOC is estimated based on the voltage inversion method.
NOW EXPLAINING THE BLOCKS
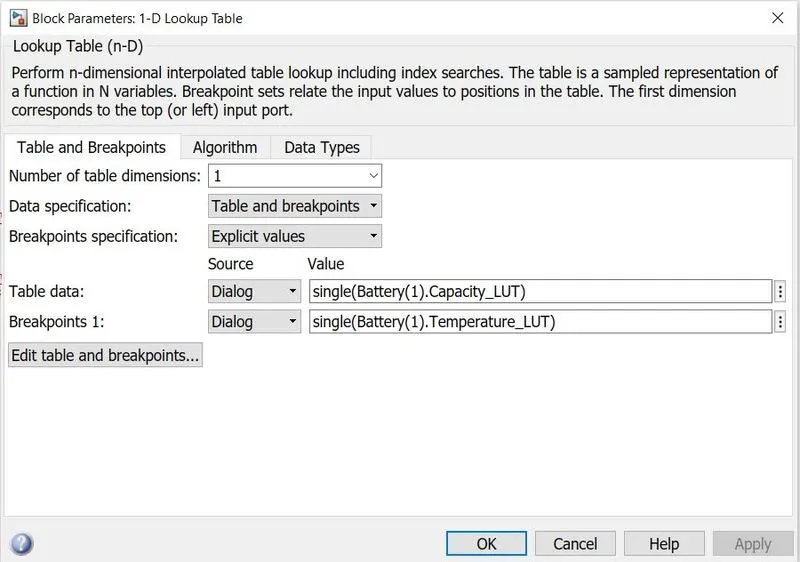
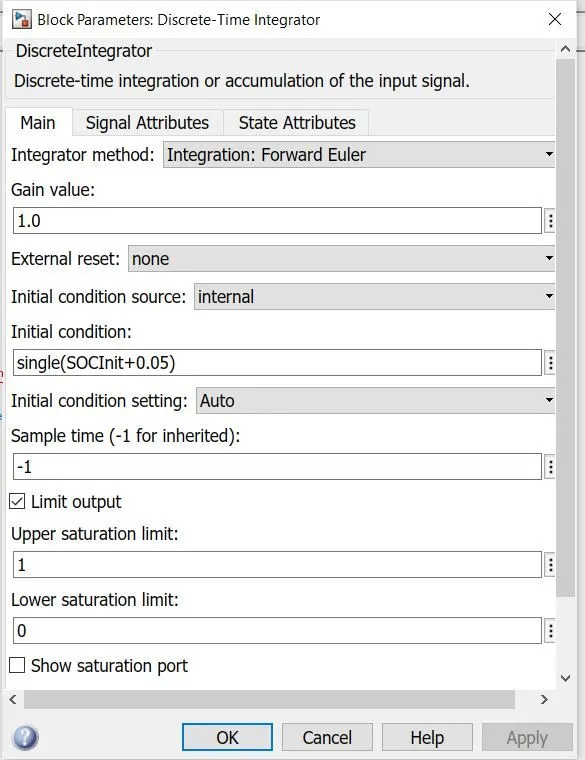
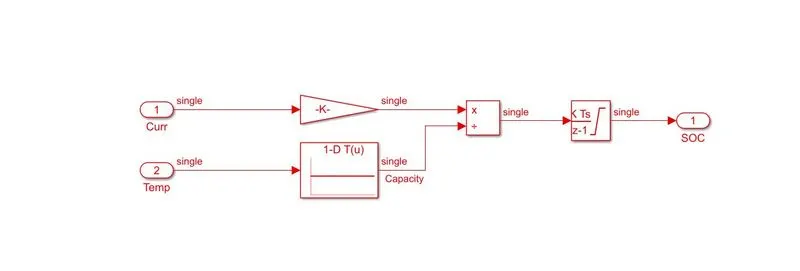
Port 1 is current & port 2 is temperature port , the signal from port 1 goes to gain block whose value is 1/3600 & then the signal from port 2 goes to 1-D Lookup Table whose parameters are shown below after that both signal are to be divided for that they used divide block as shown above, finally they are to be integrated over time thats why descrete time integrator is used finally the signal from Integrator goes to SOC port.