Week 7 State of charge estimation
Test Case - 1
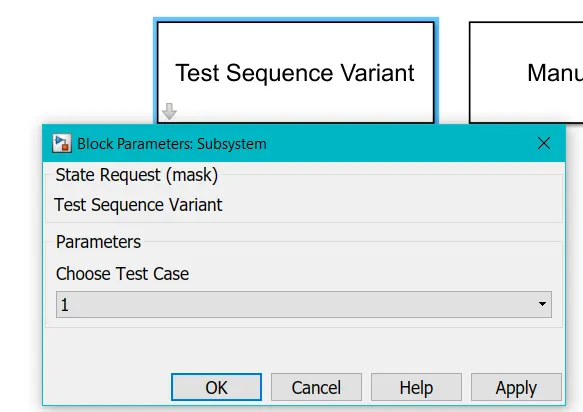
- From Test sequence Variant select 1 and press ok, run the simulation.
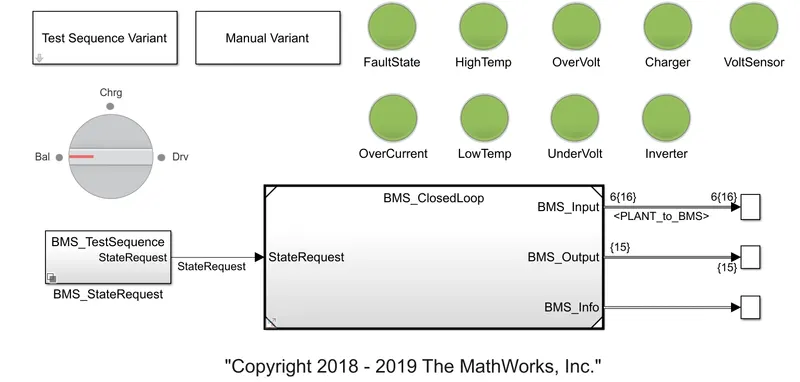
- After runnning the simulation no faults have been observed. All the signals are green. If there would have been fault orange would have appeared in place of green.
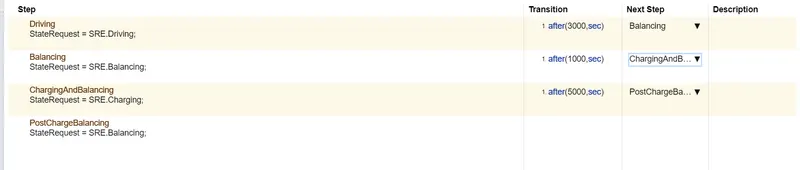
- Simulation completes in 3 steps first step is driving it goes till 3000 seconds.
- Then Blanacing after 3000 seconds, it continues for 1000 seconds.
- Then Charging and Balancing happens after 1000 seconds, it continues for 5000 seconds.
- After 5000 seconds the vehicle comes in standby mode. There is no post Charge Balancing.
RESULTS OF TEST CASE - 1
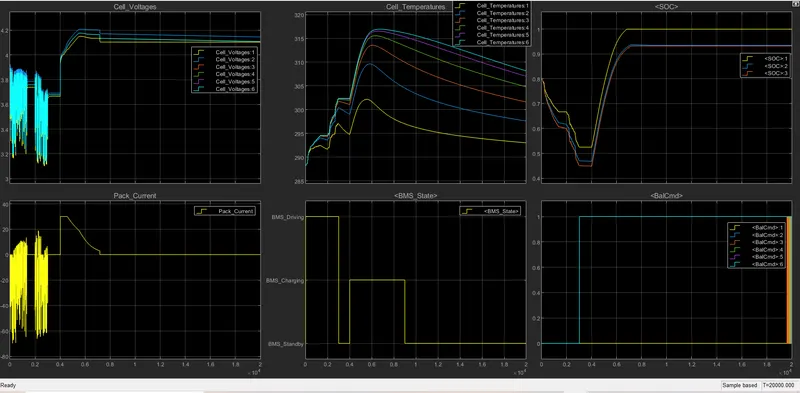
- When the vehicle is in driving stage for first 3000 seconds we can observe decrease in voltage of battery and sometimes it increases due to regenerative braking which recharges the battery while in driving condition. During Blancing stage for 1000 seconds the voltage remains constant and after that for charging and balancing state the voltage increases and gets balanced. These can be observe in cell voltage grap.
- For pack current graph we can observe that it increases and decreases for 3000 seconds in driving stage. When current decreases it is negative that means current is taken from the battery positive current in driving stage means current is supplied to the battery by regenartive breaking. During balancing stage current is zero and in charging stage current inreases and then decreases till the end of charging finally it becomes zero at stand by mode.
- The temperature increases in driving stage but it is less than the temperature when the battery pack is charging. While charging the temperature increases at faster rate than driving.
- SOC graph shows that soc of different pack reduces at different rate in driving stage and increases while charging but diffrent pack achieve different level of soc. Those pack discharged more recover less while charging like 'SOC 3' and vise versa.
TEST CASE - 2
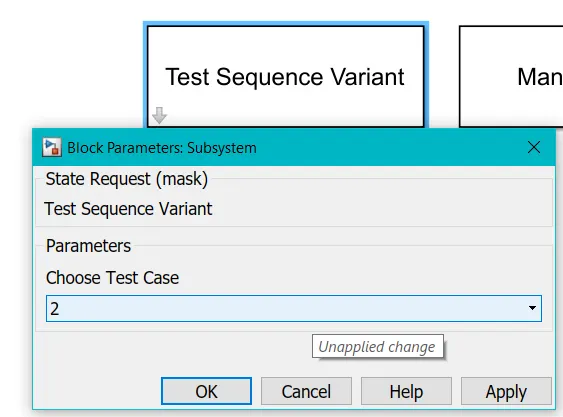
- From Test sequence Variant select 2 and press ok, run the simulation.
- After runnning the simulation no faults have been observed. All the signals are green. If there would have been fault orange would have appeared in place of green.
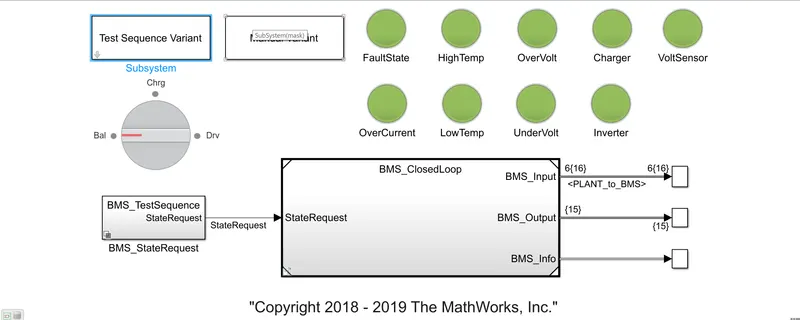
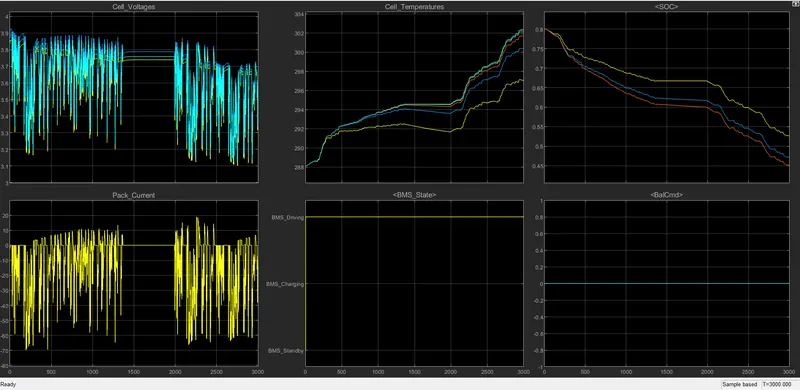
- The driving stage continues for 10000 seconds and there are no other different stages.

RESULTS OF TEST CASE - 2
- The voltage increases and decreases in the driving stage and ultimately it falls as the SOC values also falls.
- The current also increases and decreases in the driving range as explianed in test case 1.
- Temperature increases as current is drawn from the battery in driving range.
TEST CASE - 3
- From Test sequence Variant select 3 and press ok, run the simulation.
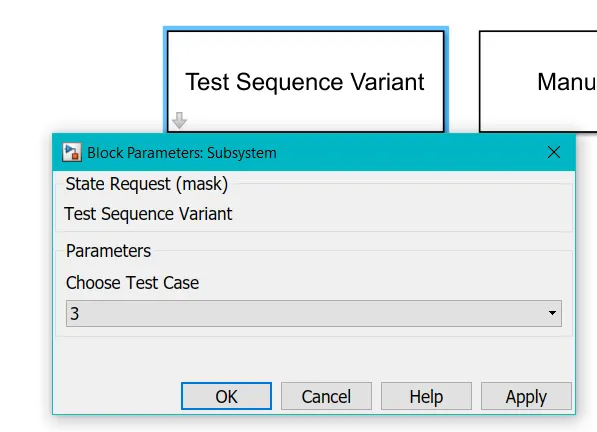
- After runnning the simulation no faults have been observed. All the signals are green. If there would have been fault orange would have appeared in place of green.
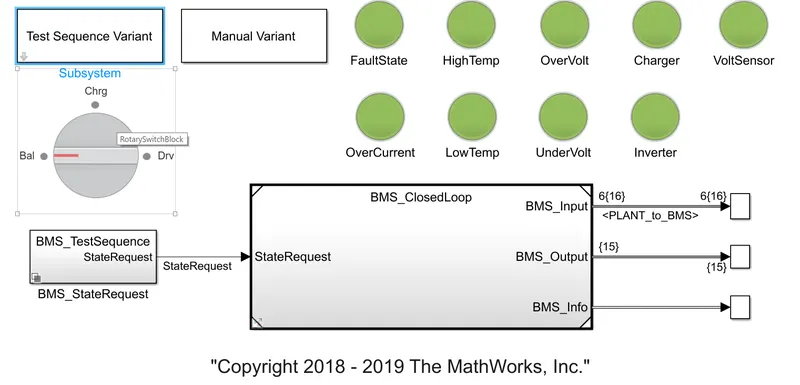
- There is only charging stage in this particular Test Sequence.

RESULTS OF TEST CASE - 3
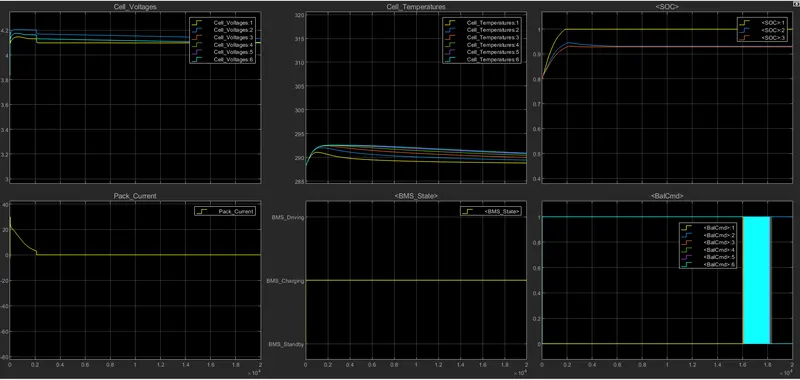
- The voltage increases during charging and gets balanced below 4.2 volt.
- The pack current increases while charging and becomes zero at the end of charging.
- There is increase in temperature while charing it can be observed from the graph, since there was no driving stage so increase in temperature is less than Test Case 1. Different cell show case different temperature range.
- Since only charging is happening at this stage so SOC increases SOC 1 reaches 1 and other are below it it.
WHAT IS COULOMB COUNTING
The Coulomb counting method is one of the most general and simple methods of estimating the SOC. It is a current integration method. It is a technique used to measure or track the state of charge of a battery. The method integrates the active flowing current measured in Amps over time to derive the total sum of energy or current entering or leaving the battery back. This produces the method of measuring the battery capacity in Amper-Hour. The limitations of this method are that measurement of inaccurate current leads to large errors and measuring accurate current is expensive.
Other factors such as temperature, battery history, initial SOC and cycle life also influence the precision of the SOC estimate. Practically speaking, some phenomena, such as decreasing SOC when the battery is resting and variations with temperature changes cannot be captured by the Coulomb counting method.
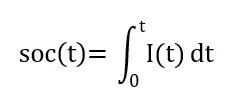
SOC of a battery is the ratio of the stored charged at time instant ‘t’ to the nominal capacity (µn). The SOC can be defined as:
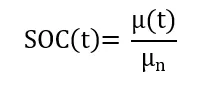
Where SOC(t) is state of charge of battery at time instant ‘t’ (in %)
µ(t) = stored charged in a battery at time instant ‘t’ in (Ah)
µn = Nominal capacity of battery in (Ah).
SOC MEASUREMENT FORMULA
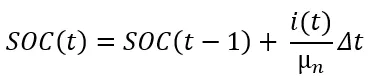
Where SOC(t) = Battery state of charge at time instant ‘t’.
SOC(t-1) = Initial SOC = Battery state of charge at time instant (t-1).
µn = Nominal capacity of battery in (Ah).
I(t) = Battery current at time instant ‘t’
Δt = Time in step time.
MODIFIED COULOMB COUNTING METHOD - Reffering to the above model In this way BMS implements Coulomb counting method explained below
To improve the Coulomb counting method, a new technique called modified Coulomb counting method is proposed. The modified Coulomb counting method uses the corrected current to improve the accuracy of estimation.
The corrected current is the function of discharging current. There is a quadratic relationship between the corrected current and discharging current of battery. By practice of experimental data, corrected current is calculated by the following form:
IC (t) = K2 I(t)2 + K1 I(t) + K0
Where K2, K1 & K0 are constant values obtained from the practice experimental data. In modified Coulomb counting method, SOC is calculated by the following equation:
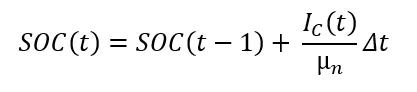
The experimental results show that the accuracy of the modified Coulomb counting method is superior to the conventional Coulomb counting method.
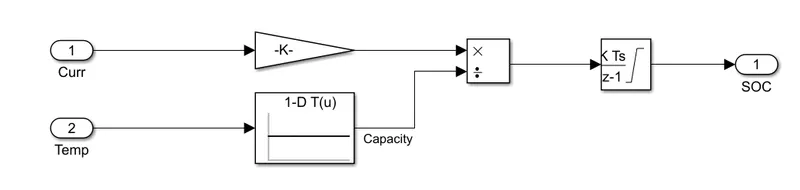
The above formula is applied in below blocks for coulomb counting.
- The subsystem block of coulomb counting takes input of current and temperature.

- When the subsystem block is opened we can see certain blocks that are use to relate to bove formula.
- The current passes through gain block where it multiplied by 1/3600 and get converted into Ampere hour.
- The tempearture passes through a lookup table where capacity of battery is taken into account.
- These current in Ampere hour and battery capacity in ampere hour goes to divide block.
- From there the signal from didvide block goes to discrete time integrator block. and finally SOC is calculated.