Week 7 State of charge estimation
1. Simulate the 3 test cases from the harness dashboard and write a detailed report on the results
Answer:
Case: 1
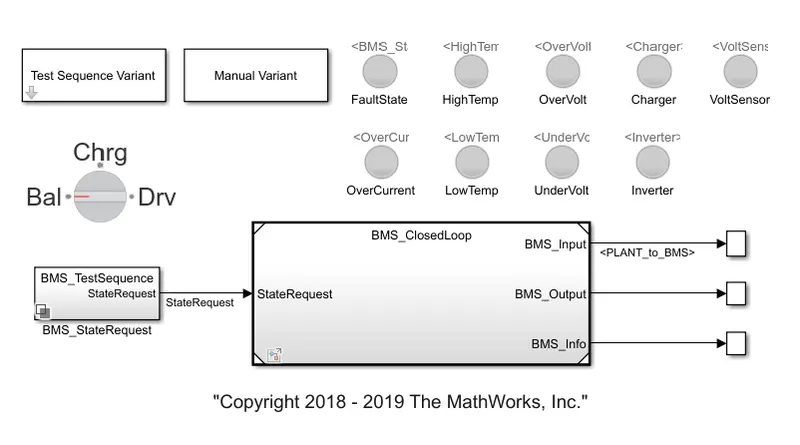
Go to the Simulink model to simulate the 3 test cases from the harness dashboard. The Simulink model is shown below.
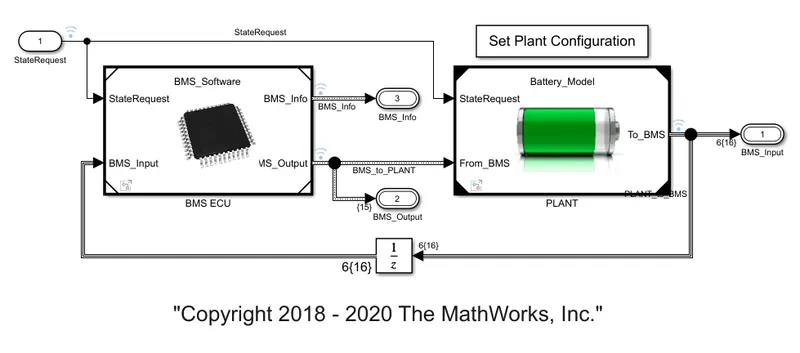
Now go to the "BMS closed-loop" model, which consists of BMS ECU & Plant. This model includes two different battery packs, select the battery 1 pack in the set plant configuration block.
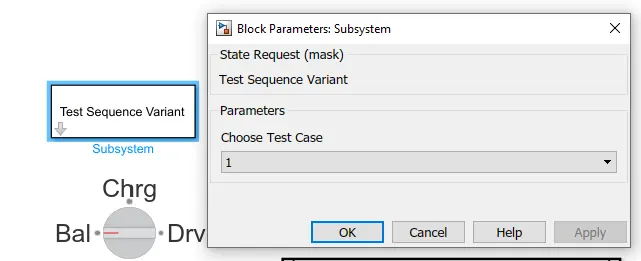
To select the test case, click on the "Test sequence variant" block and select test case 1.
For test sequence 1, the transition period is as shown in the figure.
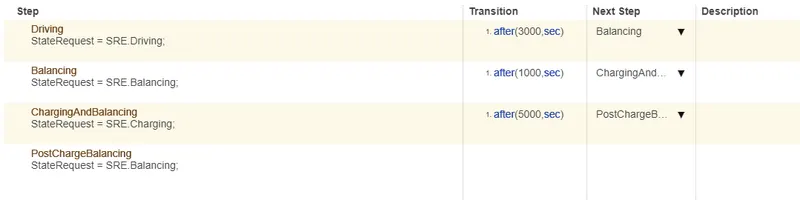
When the simulation will start, the model will be in a driving condition for up to 3000 sec. After 3000 sec, balancing will occur which means the model will be in standby mode for up to the next 1000 sec. After this model will move to the charging & balancing mode for the next 5000 sec. Run this model now.
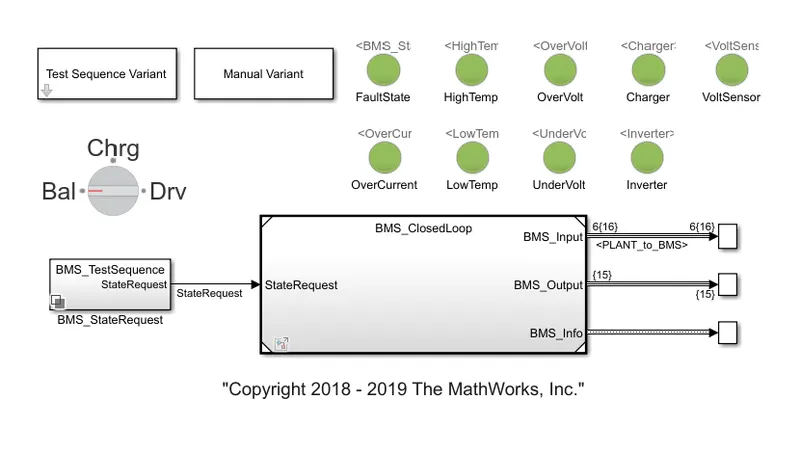
It can be observed in the dashboard that there are no faults in the model.
Result:
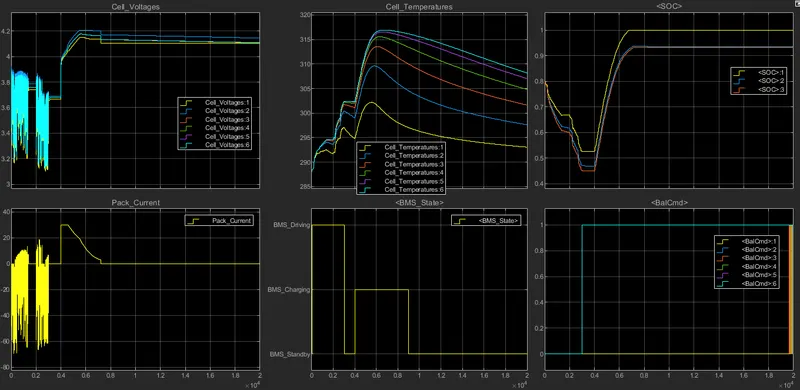
From the above graphs, it can be observed that as per the input, initially, the model is in driving state, standby & charging state. During the driving state, the Cell voltage & pack current fluctuation is more. The temperature of the cells is rising & SOC drops. During stand-by for the next 1000 sec, the cell's temperature decreases. In the charging state, the battery pack voltage increased up to 4.2V, again cell temperature increased & SOC 1 reaches 100% & SOC 2&3 reaches around 93%.
Case 2:
Now click on the "Test sequence variant" block and select test case 2.
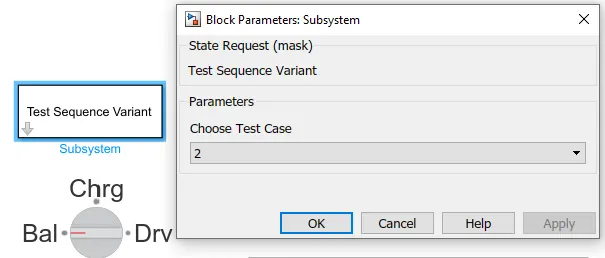
For test sequence 2, the transition period is as shown in the figure.
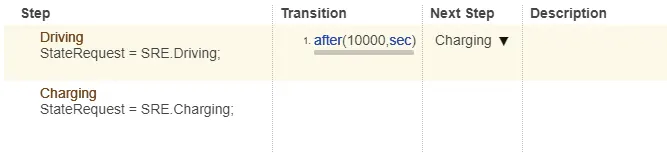
When the simulation will start, the model will be in a driving condition for up to 10000 sec. And the next step is charging. Run the model again.
It can be observed in the dashboard that there are no faults in the model.
Result:
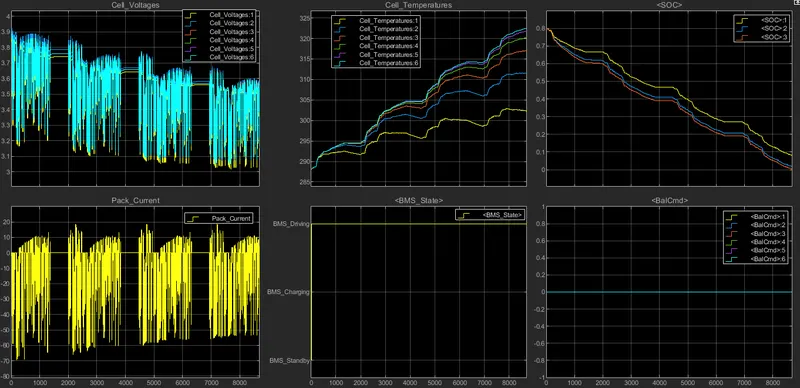
From the above graph, it can be observed that the battery discharges completely after 8692 sec. The charging won't happen as the model stops before 10000 sec. In this case, the cell temperature increased gradually.
Case 3:
Now click on the "Test sequence variant" block and select test case 3.
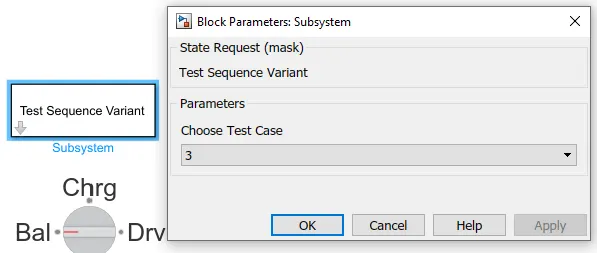
For test sequence 3, the transition period is as shown in the figure.

When the simulation will start, the model will be in a charging condition for up to 20000 sec.
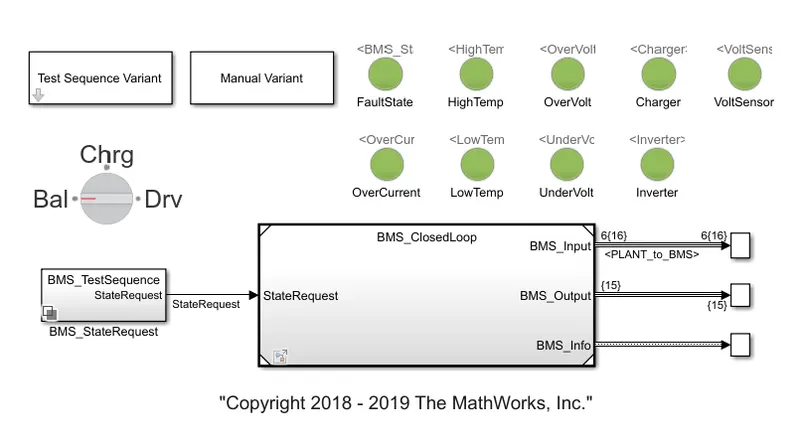
It can be observed in the dashboard that there are no faults in the model.
Result:
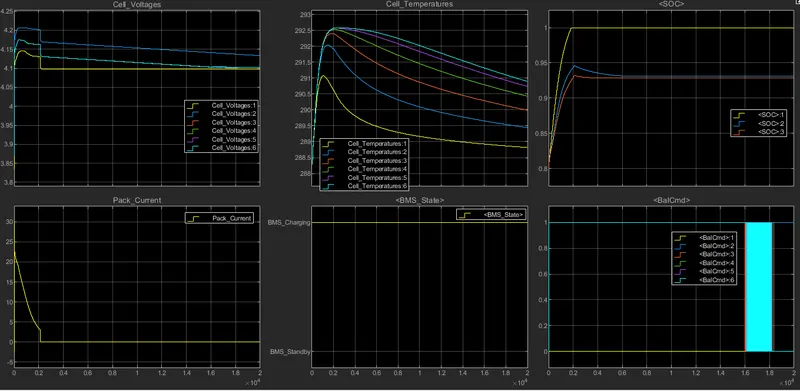
From the above figure, it can be observed that for the whole simulation period, the cells are charging. During the initial period, the cell temperature increased up to around 2000 sec and gradually it decreased after SOC 1 reaches 100% & SOC 2&3 around 93%.
2. What is coulomb counting? Refer to the above model and explain how BMS implements coulomb counting for SOC estimation?
Answer:
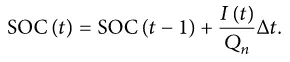
Coulomb counting is a procedure that is used to follow the state of charge(SOC) of the battery pack. It is determined by integrating the active flowing current overt time to derive the sum of energy entering or leaving the battery pack. This creates a capacity that is typically estimated in Ampere-hours. This method measures the discharging current of the battery pack. SOC is calculated by the following equation.
The temperature, battery history, discharge current, and cycle life are the factors that influence the accuracy of the coulomb counting method.
Modified coulomb counting method:
A new technique called the modified Coulomb counting method is proposed to further develop the coulomb counting method. The modified Coulomb counting method uses the corrected current to improve the accuracy of estimation. The corrected current is the function of discharging current. There is a quadratic relation between the corrected current & discharging current of the battery. Through the practice of experimental data, the corrected current is calculated as below.

Where k0, k1 & k2 are constant values obtained from the practice of experimental data. In the modified Coulomb counting method the SOC is calculated by the following equation.
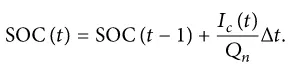
The experimental result shows that the accuracy of the modified Coulomb counting method is better than the conventional Coulomb counting method.
The BMS Simulink model is shown below.
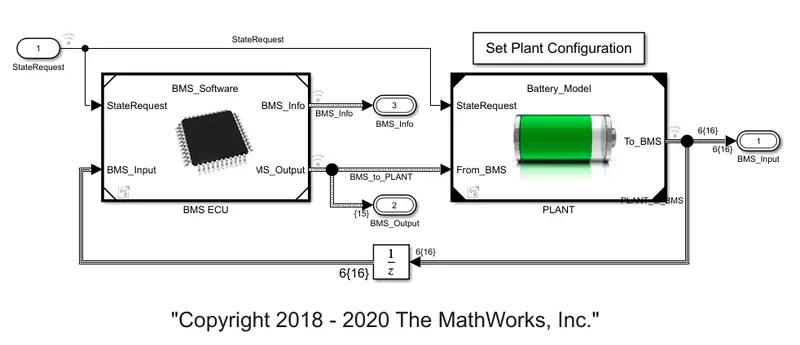
Go to the SOC estimation block inside the BMS ECU.
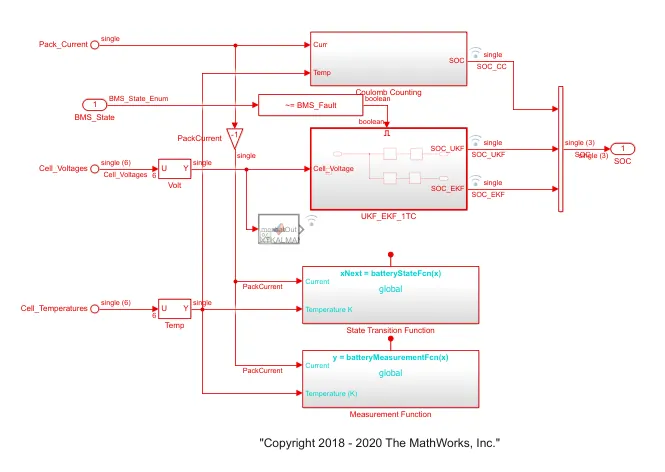
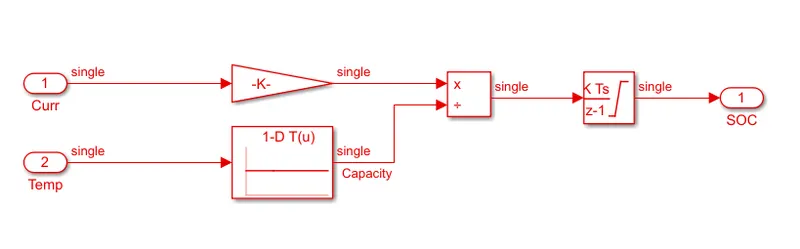
Inside the coulomb counting block is as shown below.
The Kalman filter block is as shown below.
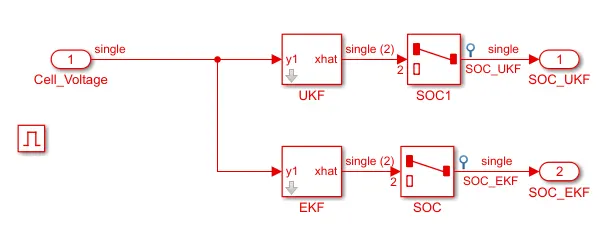
The results show that the unscented Kalman filter(UKF) is superior to the extended Kalman filter(EKF) in the SOC estimation of the battery. The advantage of the coulomb counting method is its simplicity & low computational cost. The temperature and current from the battery are given as input from the battery. The current signal is given to a gain block and temperature is given to capacity since it varies according to the temperature. Then the current is integrated wrt time. This output is divided by the capacity & estimated SOC.