Week-4 Challenge WOT Condition Part-2
1. What is the difference between mapped and dynamic model of engine, motor and generator? How can you change model type?
Answer:
Mapped models are steady-state models, analysis is based on the predefined values from the look-up table. Dynamic models are real-time models which perform the detailed & components level analysis.
|
Difference between Mapped and Dynamic Model |
||
|
Parts |
Mapped Model |
Dynamic Model |
|
Engine |
Analyze macro engine behaviors from brake torque, air mass flow, efficiency look-up tables |
Simulated using the data received from sub-systems in real-time |
|
Motors/ Generator |
When Components details are not available & for quick simulation |
When all Component parameters are known & for accurate performance. |
Steps to change model type:
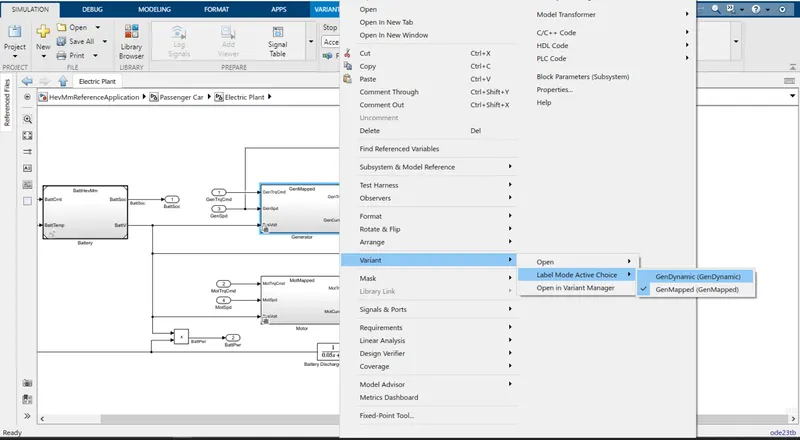
- In HevMmReferenceApplication, select the passenger car block, now select electrical plant. Here right click on the GenMapped block >> variant >> Label Mode Active Choice >> GenDynamic.
2. How does the model calculate miles per gallon? Which factors are considered to model fuel flow?
In the case of HEV, both Battery & Fuel are used for propulsion. To add both, convert battery power to m^3/gal. Battery power in KW is converted to a gallon per sec by dividing the KW by 33.7 KWh/USgal & dividing by 3600 to convert to sec. Multiply this block with a gain of 0.00378541 to get volume flow. This value is then added to the fuel flow and integrated to get the instantaneous fuel values. This value is converted to US gallons by multiplying it by 264.172. Divide the miles with this value to obtain mpg.
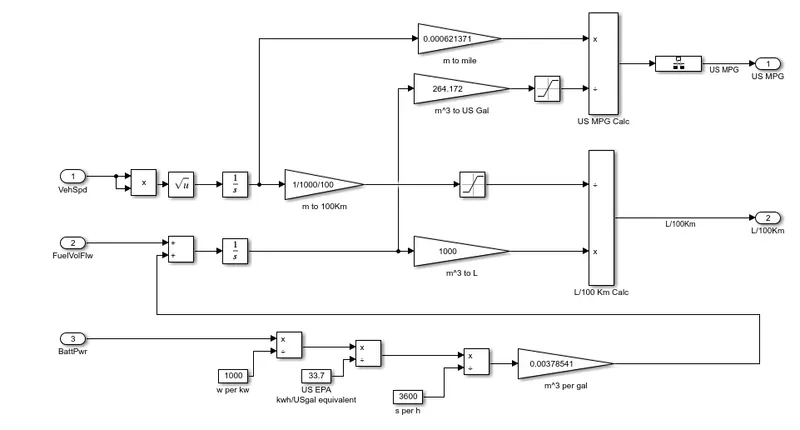
The factors considered to model fuel flows are:
- Vehicle speed
- Fuel flow volume
- Battery power
3. Run the HEV ReferenceApplication with WOT drive cycle. Change the grade and wind velocity in the environment block. Comment on the results.
Answer:
case 1:
The following parameters are considered:
Reference speed = 60 mph
Deceleration start time = 50 sec
Simulation time = 100 sec
Gradeability = 0 deg
Wind velocity = 0 m/s
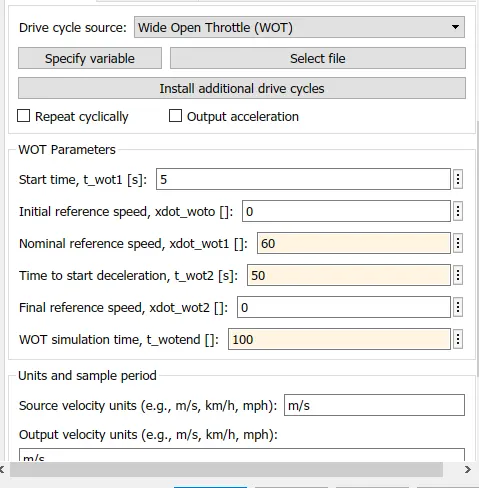
The simulation results are as follows:
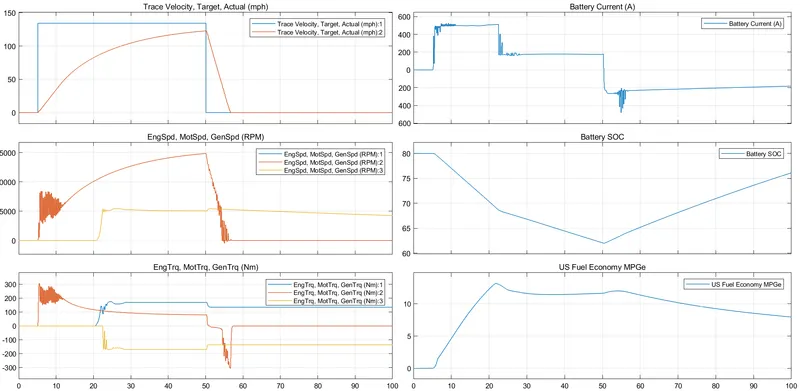
Plot 1: Trace actual velocity and target velocity of the vehicle based on drive cycle data vs time on the x-axis. The target velocity is around 134 mph and the max. actual velocity is around123 mph.
Plot 2: Trace engine, motor & generator speed. Observed the rapid increase in motor speed as the increase in velocity. Due to high power demand engine started after 20 sec.
Plot 3: Trace engine, motor & generator torque. Observed that quick increase in motor torque at starting, for positive engine torque generator has negative torque slope.
Plot 4: This plot gives the battery current reading.
Plot 5: Gives the battery SOC. SOC decreased from 80% to 62.1% when the motor was working, after 50 sec during regenerative braking soc increased.
Plot 6: Trace the Fuel economy, which drops when the engine is on.
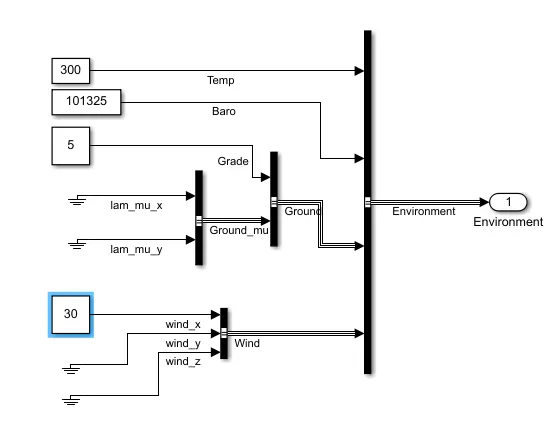
Case 2:
The following parameters are considered:
Reference speed = 60 mph
Deceleration start time = 50 sec
Simulation time = 100 sec
Gradeability = 5 deg
Wind velocity = 30 m/s
The simulation results are as follows:
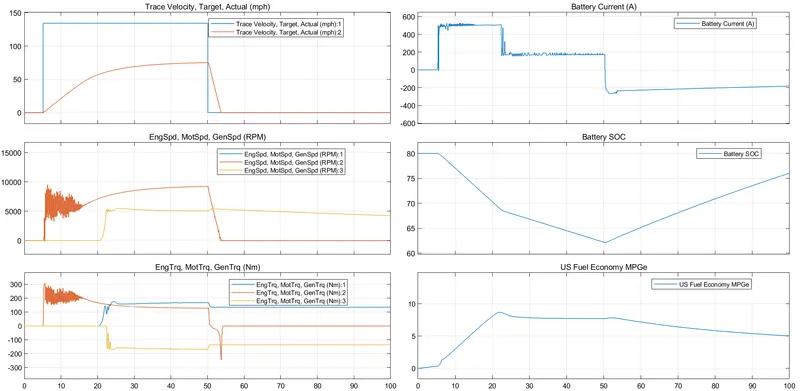
Plot 1: Trace actual velocity and target velocity of the vehicle based on drive cycle data vs time on the x-axis. The target velocity is around 134 mph and the max. actual velocity is around 71.1 mph. As grade & wind speed increases the actual velocity is less than the target.
Plot 2: Trace engine, motor & generator speed. Observed the rapid increase in motor speed as the increase in velocity. Due to high power demand engine started after 20 sec.
Plot 3: Trace engine, motor & generator torque. Observed that quick increase in motor torque at starting, for positive engine torque generator has negative torque slope.
Plot 4: This plot gives the battery current reading.
Plot 5: Gives the battery SOC. SOC decreased from 80% to 62.1% when the motor was working, after 50 sec during regenerative braking soc increased.
Plot 6: Trace the Fuel economy, which drops drastically when the engine is on as a compared previous case.
4. Keeping all other parameters the same, compare the simulated results of hybrid and pure electric powertrains.
Answer:
Keeping all parameters same as previous question case 2.
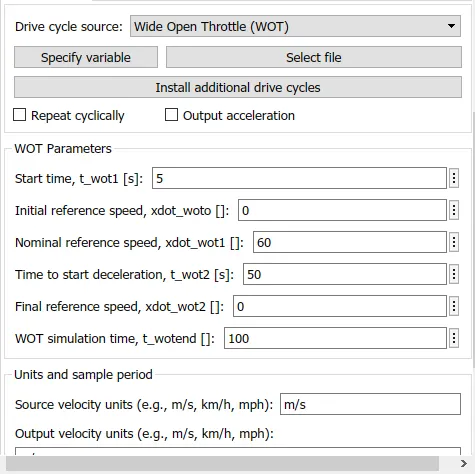
The following parameters are considered:
Reference speed = 60 mph
Deceleration start time = 50 sec
Simulation time = 100 sec
Gradeability = 5 deg
Wind velocity = 30 m/s
The simulation results are as follows:
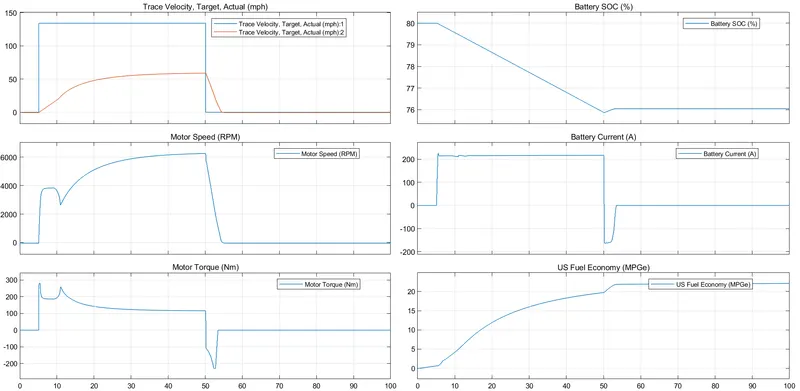
Plot 1: Trace actual velocity and target velocity of the vehicle based on drive cycle data vs time on the x-axis. The target velocity is around 134 mph and the max. actual velocity is around 59.6 mph. As grade & wind speed increases the actual velocity is less than the target.
Plot 2: Trace motor speed. Observed the rapid increase in motor speed as the increase in the velocity. And decreases during deceleration.
Plot 3: Trace motor torque. Observed that quick increase in motor torque at starting and a drastic decrease during deceleration. The motor has a negative torque slope during deceleration.
Plot 4: Gives the battery SOC. SOC decreased from 80% to 75.8% when the motor was accelerating, after 50 sec during regenerative braking soc increased slightly to 76.05%.
Plot 5: This plot gives the battery current reading.
Plot 6: Trace the Fuel economy, compared to MPGe this is more economical.
Comparison:
1. Actual velocity traced by the HEV is more compared to EV during this drive cycle.
2. Motor RPM is more incase of HEV, but the smooth transition in motor RPM in EV.
3. Torque torque is more in case of HEV & huge fluctuation in graph during starting in HEV.
4. Current drawn from the battery is more in HEV, current was negative for the time in HEV due to regenerative braking.
5. Huge drop in SOC in the case of HEV but after regenerative SOC in both cases is almost the same.
6. Fuel efficiency is more in EV than in HEV.
Matlab links: