Week 7 State of charge estimation
Objectives-
1.Simulate the 3 test cases from harness dashboard and write a detailed report on the results
2.What is coulomb counting? Refer to the above model and explain how BMS implements coulomb counting for SOC estimation ?
Hint :(Download the file from the link and go to SOC estimation model-ECU block)
Q1.Simulate the 3 test cases from harness dashboard and write a detailed report on the results
Answer-
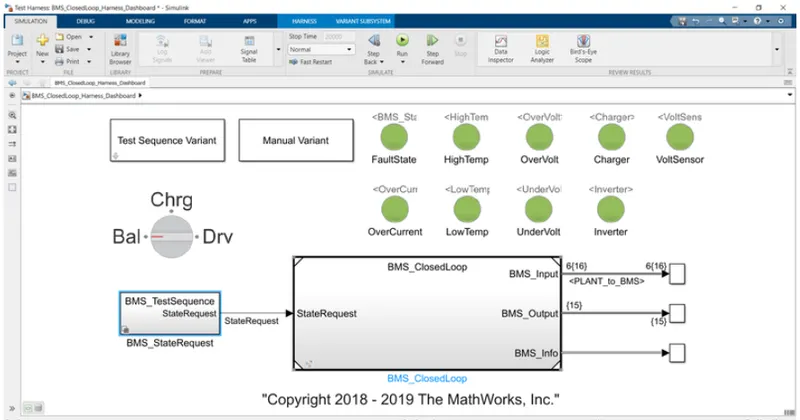
The Model- BMS_Closedloop consists of interlinking of BMS and the plant(Battery).
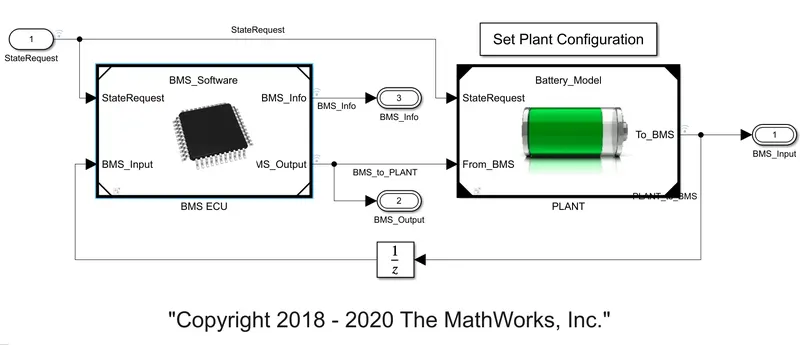
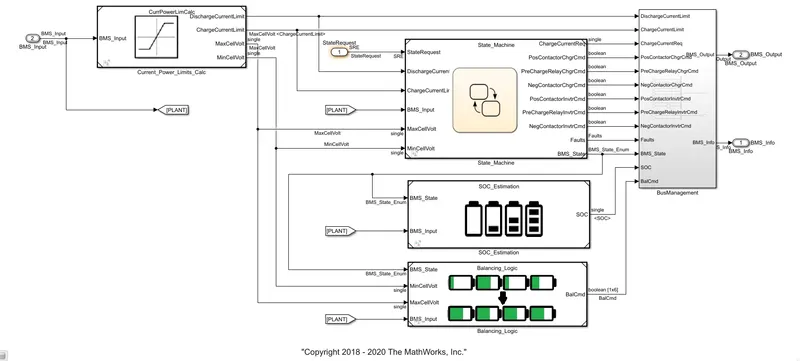
BMS ECU- Represents the software part of the model , Showing how cell balancing is done,How SOC is calculated and response to different states.
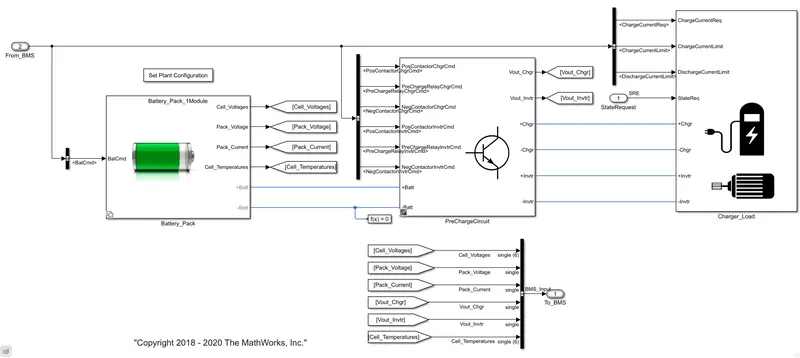
Plant- Represents the hardware part of the model, with battery pack,precharge circuit and charger.
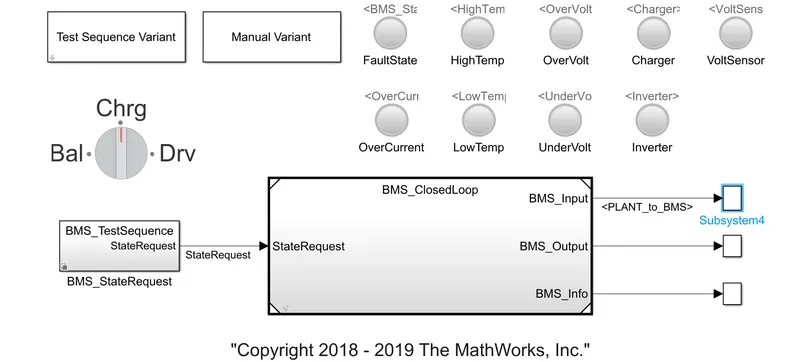
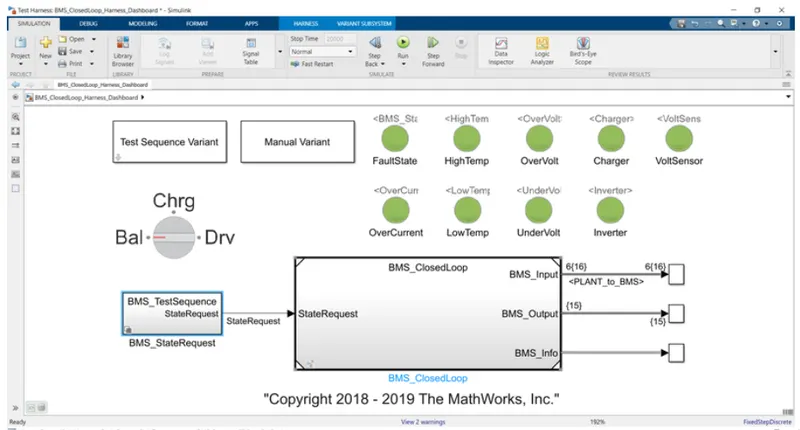
Test Harness Dashboard- Used in testing different conditions and scenarios
The state machine implement 3 logics,
1) Driving characteristics tells us the response to the different driving conditions .
2) Charging- Response to the EV while charging.
3) Balancing- Response to the fault options.
The test sequence variant has in built 3 models with 3 stages of driving conditions-
1)Driving
2)Charging and balancing
3)Standby
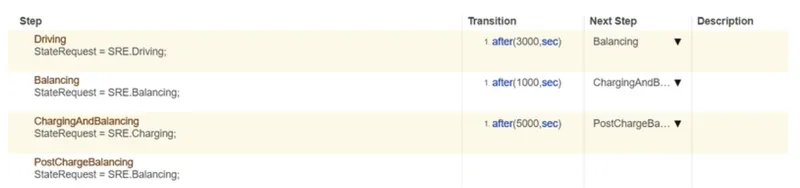
When the inputs are provided to Bms model, scope and dashboard results are-
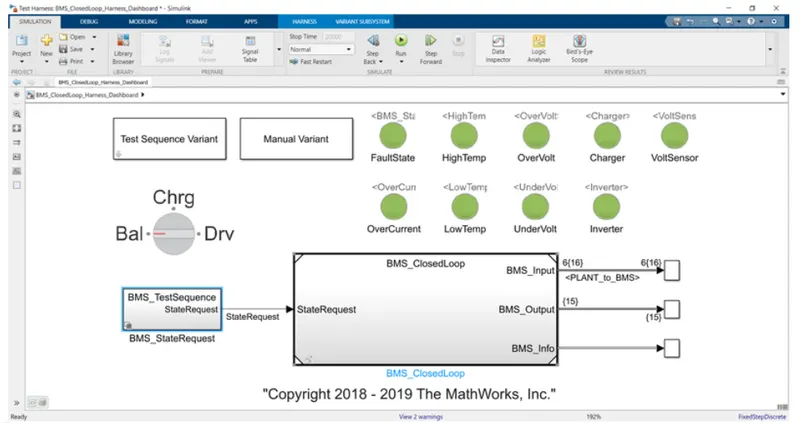
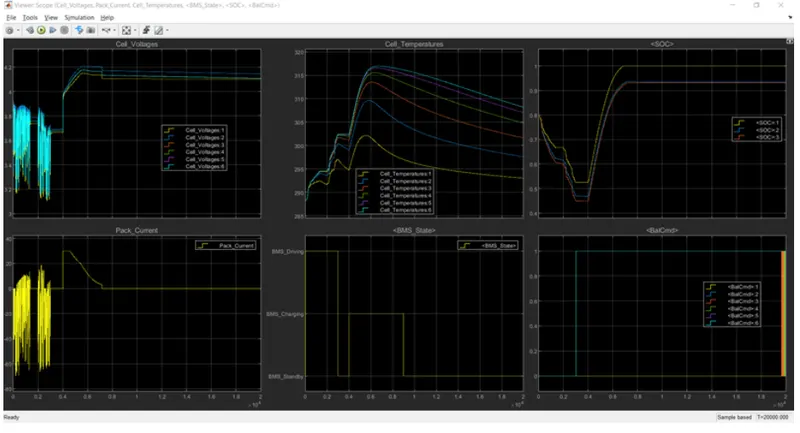
There is no fault in the system which is indicated by the green LED on the dashboard.
Results-
The 1st graph shows the cell voltage which is varying randomly in initial stage when the veicle in driving mode, once the vehicle changes to charging mode the cell voltage increases upto 4.2V and at standby mode the voltage remains constant.
Initially the cell temperature is increases randomly from 288K to 302K when the vehicle is in driving mode,But in charging mode we can see a steep increase in temperature from 302K to 306K and then the temperature falls around 290K at standby mode.
While driving SOC starts decreasing from 80% to around 45% and then at charging mode the SOC reaches upto 100% and remains constant at stand by mode.
The test sequence 2 has two phases of the battery-
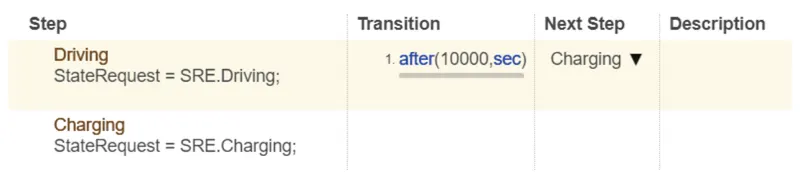
The scope and dashboard results are-
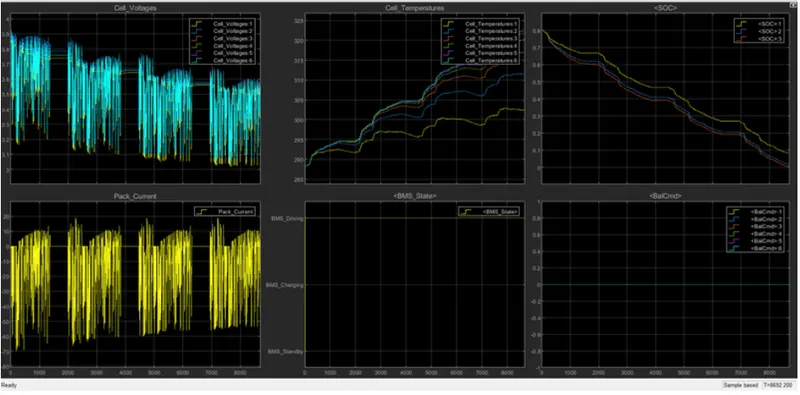
Results- The cell voltage varies randomly according to the driving cycle of the vehicle.When the vehicle is continuously on driving mode the SOC of the battery decreases rapidly and reaches 0% within 10000 seconds.
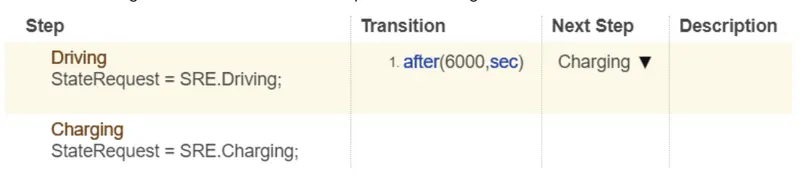
When the driving uration in 2nd test sequence is changed to 6000 seconds,
The scope and dashboard results are-
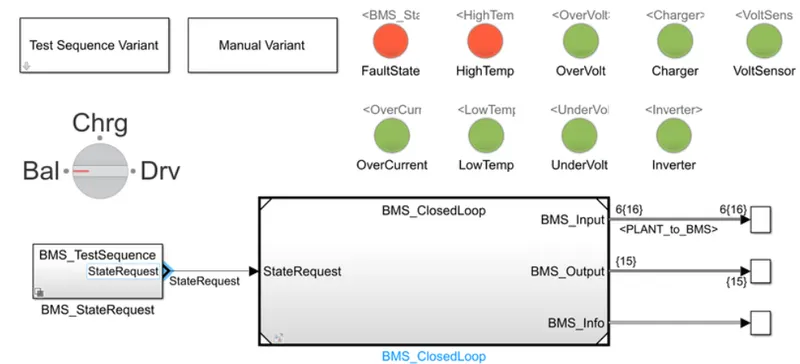
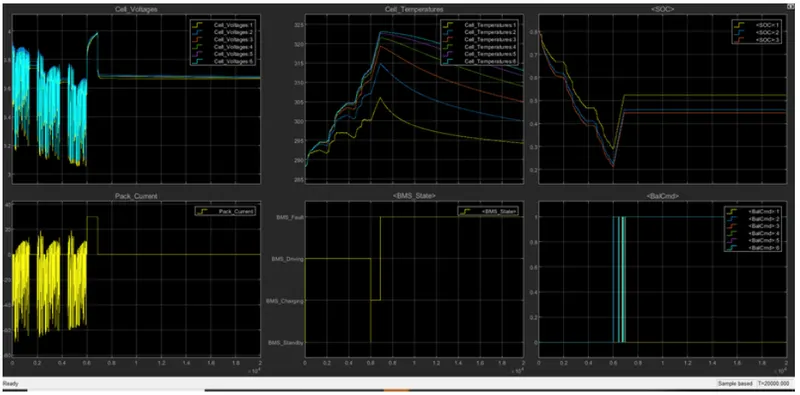
Since the driving state is reduced to 6000 sec,the vehicle changes to charging mode but the cell temperature increases over 328K so the dashboard shows over temperature fault
The test sequence varient 3 has only charging phases of the battery-

The scope and dashboard results are-
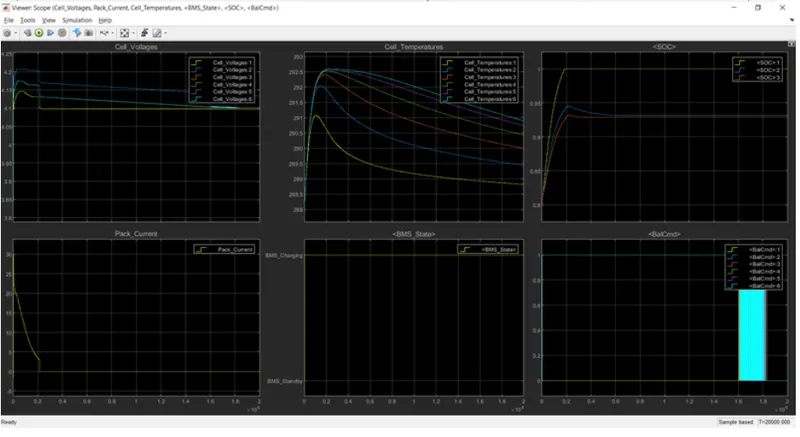
The cell voltage and temperature increasesuntil the SOC is reached 100% then the voltage is reaching steady state and the temperature starts falling.
Q2.What is coulomb counting? Refer to the above model and explain how BMS implements coulomb counting for SOC estimation ?
Answer-
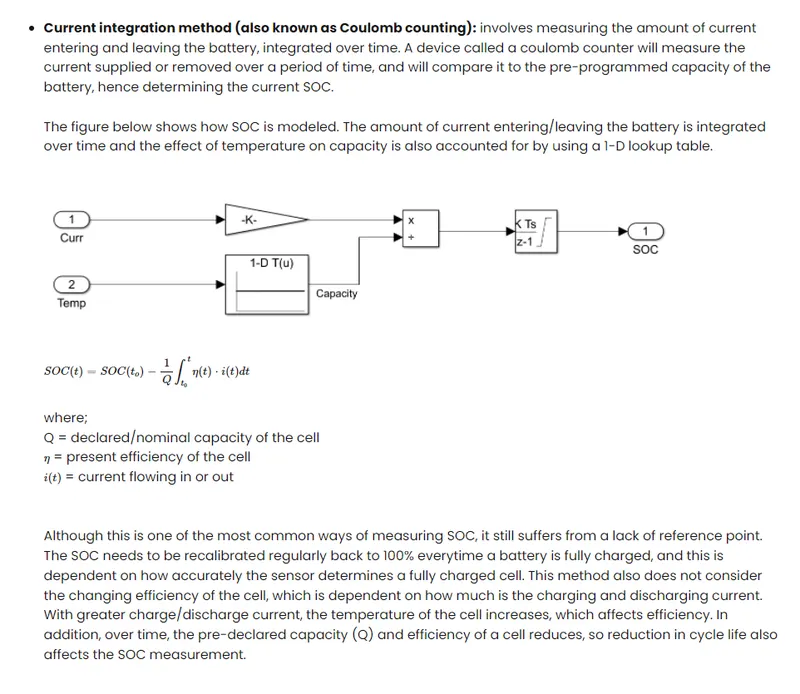
Coulomb counting (Current integration)
As the name suggests, this method is aimed at calculating coulombs or the quantity of electric charge, which is derived from current multiplied by the time necessary for the charge to flow. To measure the remaining capacity or SOC of a battery, you can add coulombs to the initial capacity in case of charging or take them away when you discharge the battery.
Current integration is a widespread method, but its accuracy depends on some factors. First off, you should know the correct measure of the initial SOC that serves as a reference point. You can get this by fully charging or discharging a battery. So if you want to use this technique, you need to allow for regular resetting of the battery SOC to 100% in your BMS design.
Another important condition for the accurate state-of-charge estimation with coulomb counting is the correct current measurement. You can achieve this by increasing the amplitude and time resolution of an analog-to-digital converter (ADC) in your current sensor. However, this can add to the sensor’s cost, so in most cases, BMS designers use inexpensive ADCs with 14- and 16-bit resolution and average measured data afterwards. Then, engineers process data by applying more advanced estimators, such as Kalman filtering or neural networks.
If you’re able to provide the conditions necessary for the efficient use of the current integration method, you can reach high accuracy in your SOC calculation. But this practice will not be reliable if you cannot regularly charge or discharge the battery to the full or if the current value is incorrect.
A BMS takes full responsibility for the long and happy life of a rechargeable battery and consequently ensures the efficiency and reliability of the battery energy storage system. When building a BMS, you should heed the battery’s chemistry, parameters, and operating environment. You can effectively monitor and control your battery, keeping it inside the safe area with all this in mind.
The state-of-charge and state-of-health are vital characteristics that clearly show the condition of a battery and help users prolong its life span, predict future behavior, and replace the battery in good time. The SOC and SOH cannot be measured directly like physical quantities of a battery, such as current and voltage. Yet, there is a diversity of practices used to calculate the battery’s charge and health status.
The SOC and SOH estimation methods depend on the battery system’s application and vary in complexity, availability, and level of accuracy. However, both customers and developers favor the simplicity, feasibility, and cost-efficiency of measuring techniques. So if the method is expensive and hard to implement, it will hardly be chosen despite its high accuracy. The best way to achieve maximum accuracy at minimum expense is to use a combination of estimators.