Week 7 State of charge estimation
1.
3 test cases of BMS close loop Test Harness model
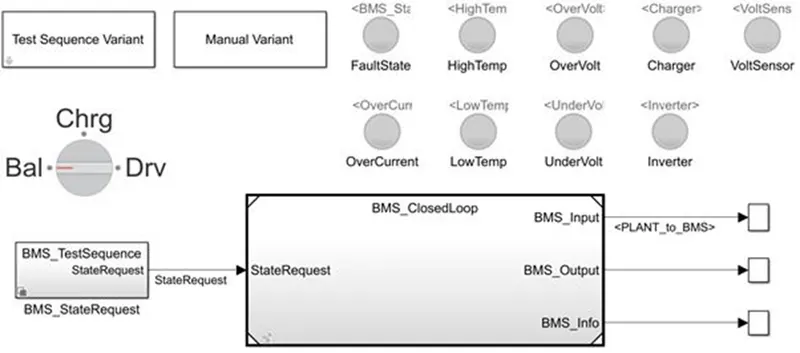
Case 1-
Now click on the Test Sequence Varient Subsystem and choose the Test case as 1
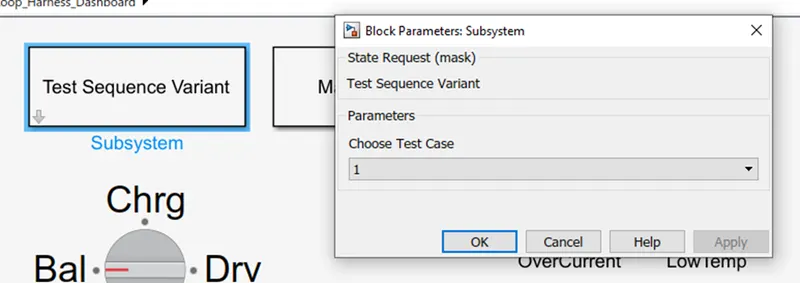
Give RUN command, By selecting test case as 1, open BMS_State Request in that we see, BMS_TestSequence we found out that 1st case is selected.
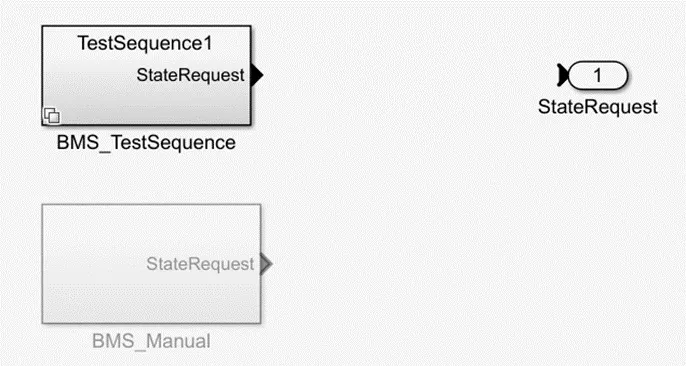
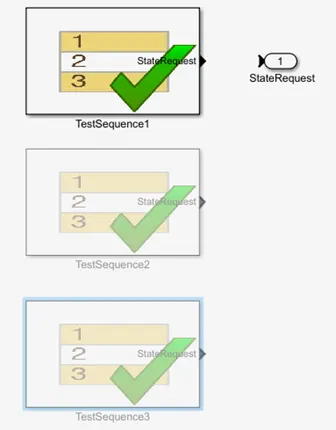
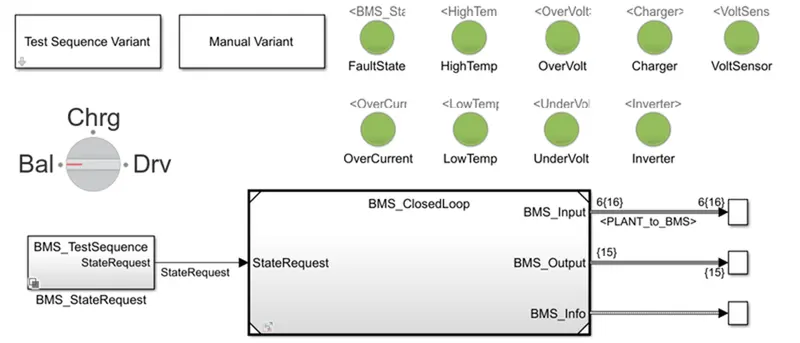
Here we observe all green signals means there is no fault or error in this model.
We get following chart,
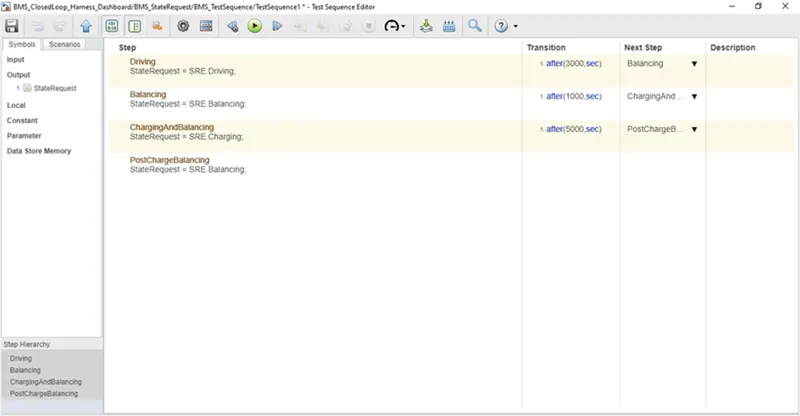
From above chart it can say that, When we run simulation the model is in driving condition up to 3000 sec, after 3000 sec it goes into Balancing condition for 1000 sec followed by Charging and Balancing for 5000 sec, And at last for the Post charging Balancing mode.
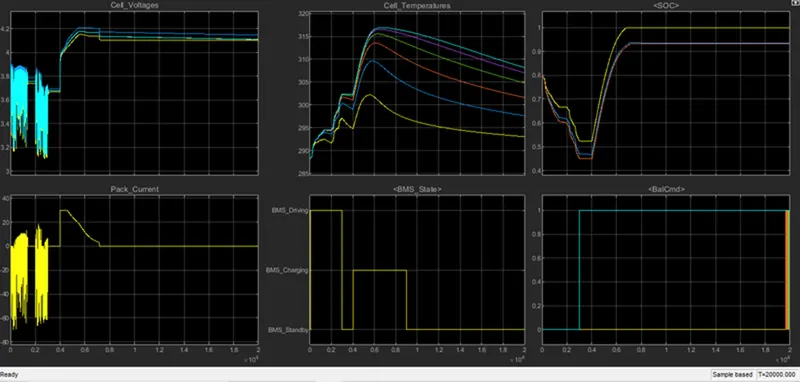
There are 6 cells in a battery pack which are of nearly same rating but having some small voltage rating difference, which can be seen in above plots. The 1st one is of cell voltages, for 0-3000sec there is driving mode so voltage of cells is continuously changing between 3.1-3.9V range after that at 3000 sec we provide standstill operation which means rest position so voltage level maintain constant and also SOC level constant, where before 0-3000sec SOC continuously goes on decreasing and after 4000 sec there is Charging state in that state SOC starts to regain its charges that’s why it's increasing. When it’s completely charged then maintain as constant.
Similarly, for voltage and current when charging state is active it shows fluctuation and after that it maintain to steady state.
BMS state plot shows the current operating state of the vehicle, As seen in the plot for 0-3000sec Driving State , 3000-4000sec Standby state, and from 4000sec onward for next 5000sec there is charging state.
Temperature plot shows variation in cell temperature in various operating state. For Driving mode it's increases, for standby mode small decrease and again while charging its increases upto certain level and goes on low.
BalCmd plot is the representation of cell balancing condition. When vehicle is in driving mode then all cells are balance that is shown by 0 state and while charging we can see that one of the cell got imbalanced therefore BMS sends an signal to make it balance and goes to 1.
Case 2-
For selecting test case as 2, open BMS_State Request in that we see, BMS_TestSequence we found out that 2nd case is selected.
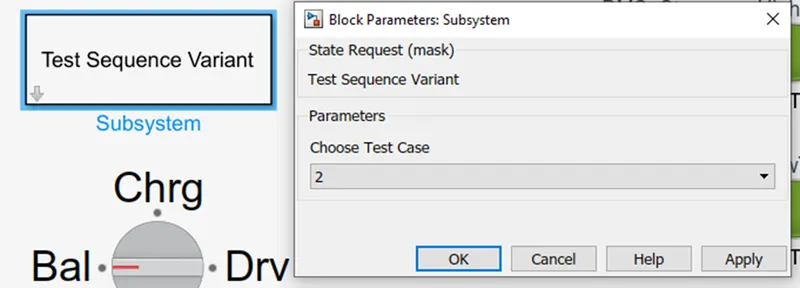
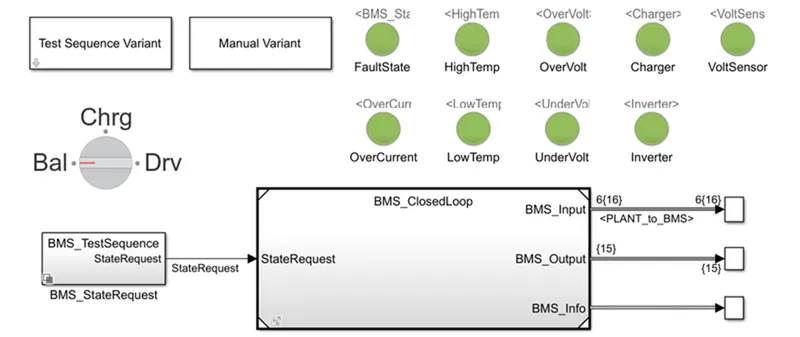
Here we observe all green signals indicating no fault or error in this model.
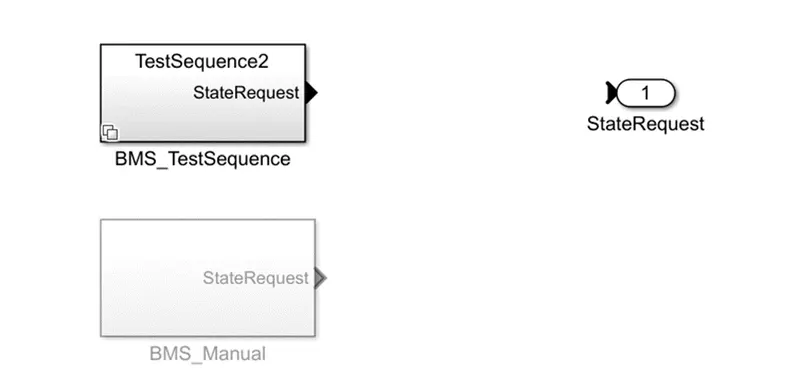
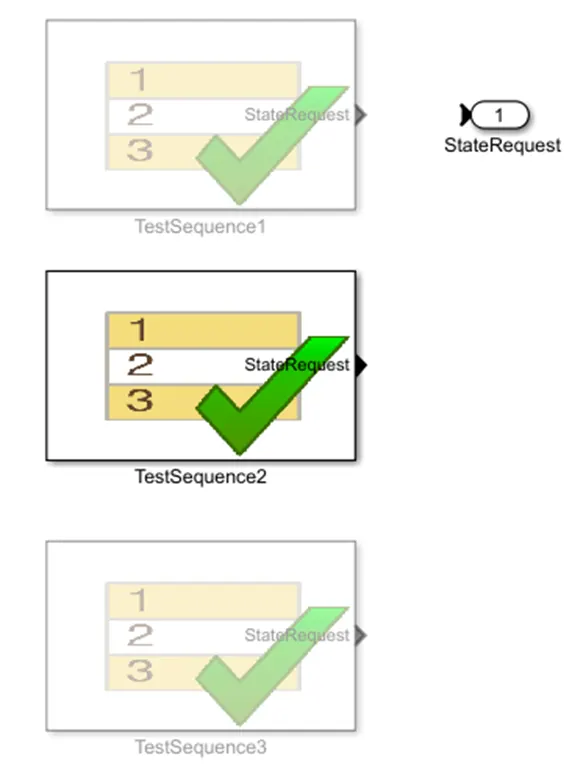
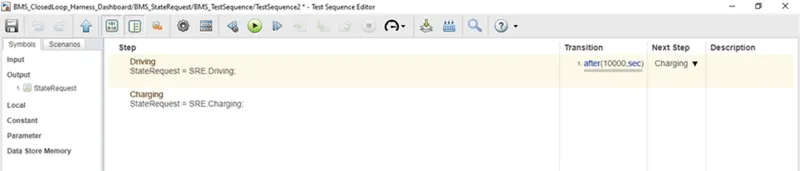
By clicking on the test case 2, we got following chart in which we see 2 states, one is of Driving and other is for Charging. Driving is for 0-10000 sec and after that period charging state is active.
By giving RUN command we get following plots for Voltage, Current, SOC, Temperature, BMS state and BalCmd.
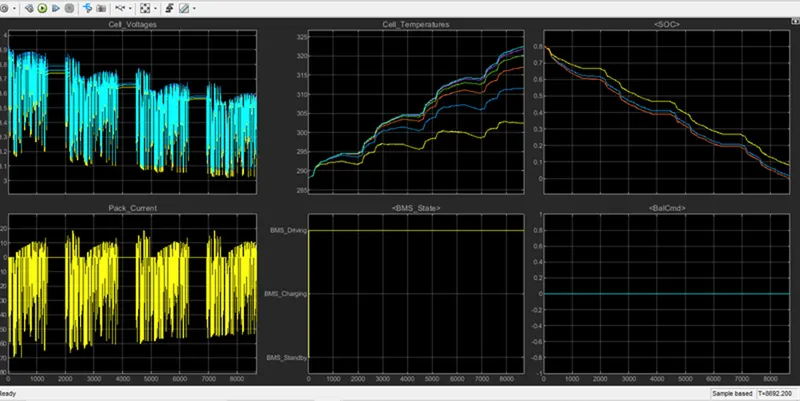
In above plot we can see that from stating The vehicle is in Driving state upto 10000sec and after that it goes to charging state. So voltage and current are changing, Cell temperature increasing and SOC decreases with the time it means battery is discharging.
The SOC is not increases again because there is no charging and balancing state again. From the SOC plot we can see that it starts decreasing from 80% to 0% in about 9000 sec and that’s why vehicle is run only upto 9000 sec.
Case 3-
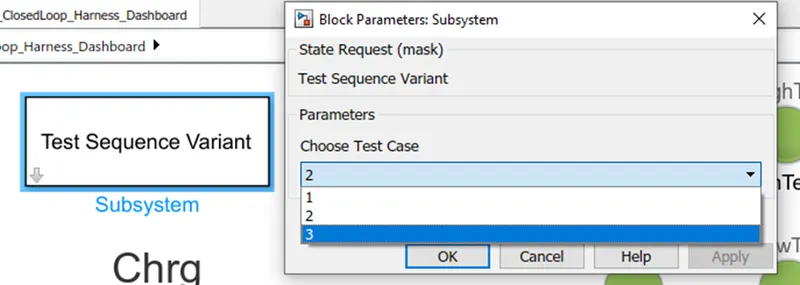
For selecting test case as 3, open BMS_State Request in that we see, BMS_TestSequence we found out that 3rd case is selected.
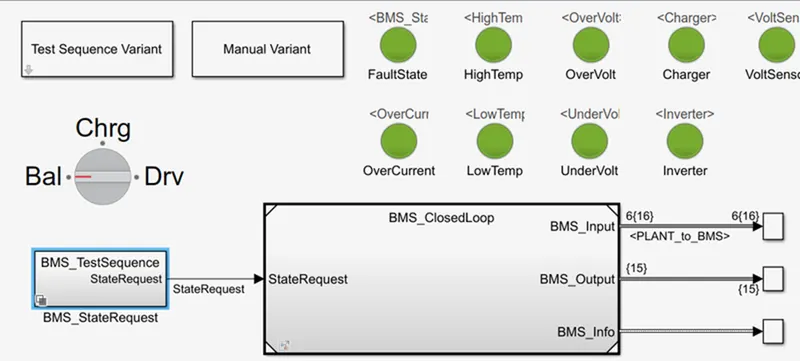
Here we observe all green signals means there is no fault or error in this model.
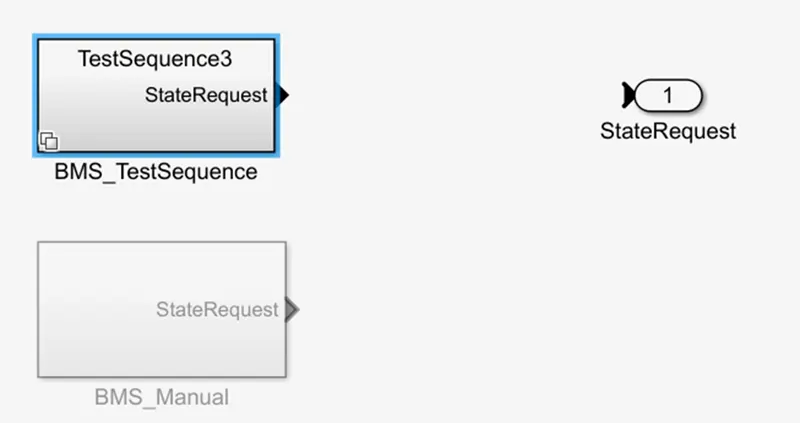
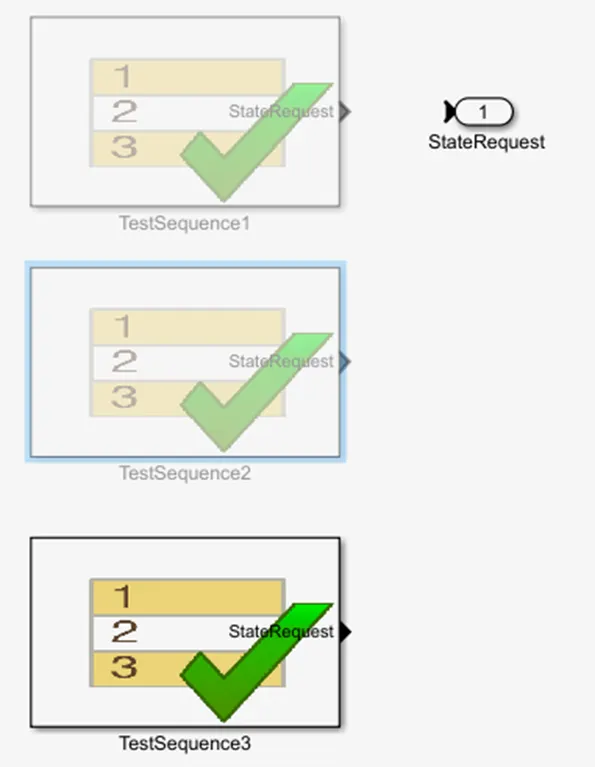
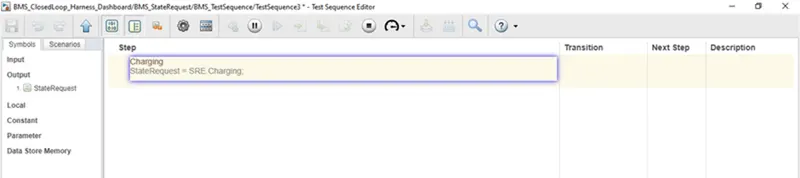
In above chart we can see that the vehicle is in charging state only so plot for this states and their different parameters are given below.
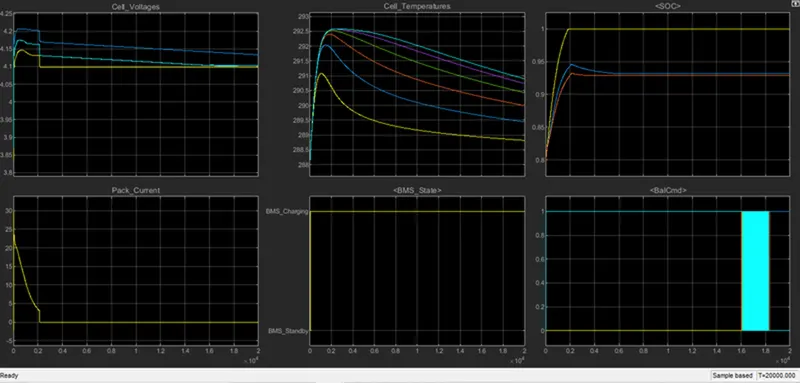
For 0-2000sec voltage varies between 4.1-4.2V and after that it remain constant till 20000sec. Similarly, current is increases at start to 30A and decreases to 0 till 2000sec and then remain same. The battery is in charging state thats why BMS state show charging plot and SOC initial state is 80% which increases to 100% in 2000sec and then remain constant.
Temperature increases for a while and then remain decreases, it shows the battery temperature condition.
2.
Coulomb Counting Method:-
The Coulomb counting method measures the discharging current of a battery and integrates the discharging current over time in order to estimate SOC. Coulomb counting method is done to estimate the SOC(t), which is estimated from the discharging current, I(t), and previously estimated SOC values, SOC(t-1). SOC is calculated by the following equation:
But there are several factors that affect the accuracy of Coulomb counting method including temperature, battery history, discharge current, and cycle life.
BMS implements coulomb counting for SOC estimation:-
To compute SOC using Coulomb counting method open BMS model
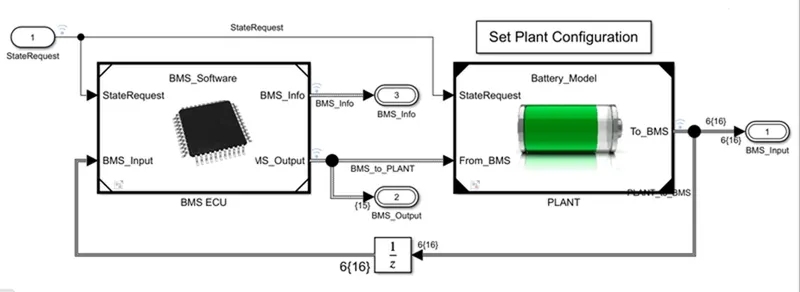
inside of BMS ECU subsystem,
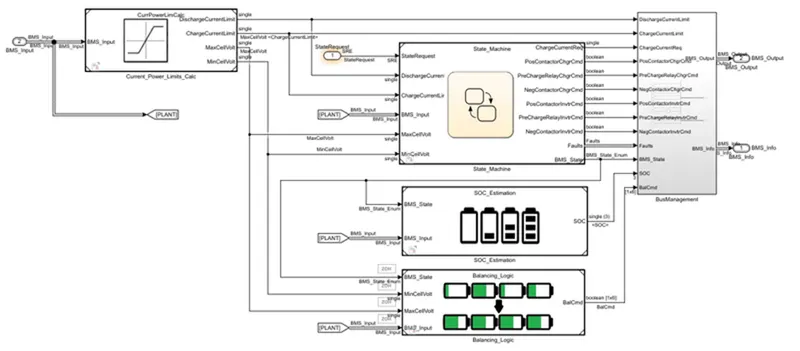
SOC Estimation subsystem and following block diagram
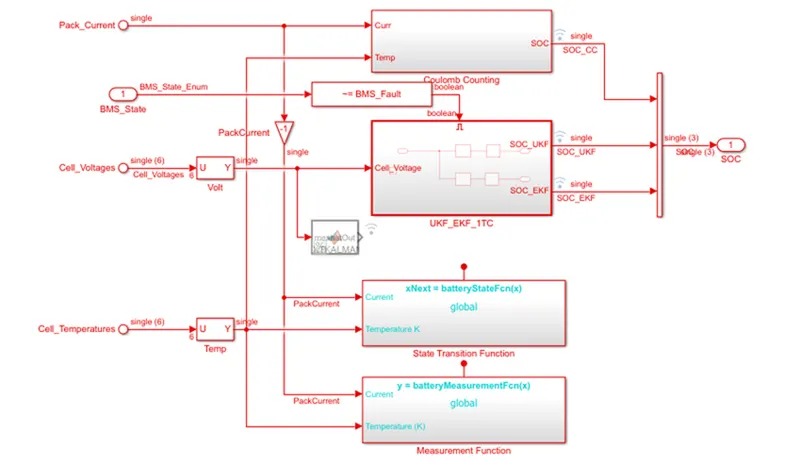
To calculate SOC by coulomb counting method open Coulomb subsystem block and following subsytem opens.
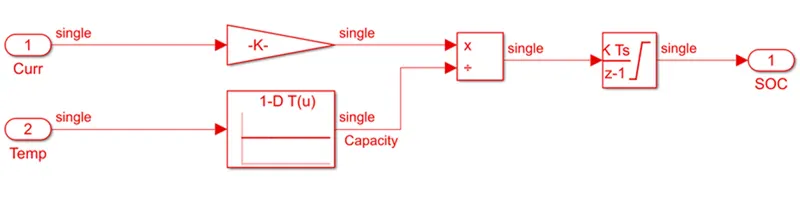
This system is used to estimate SOC by coulomb counting equation mentioned above in the block diagram. In this method Current enters and leave to gain block to get Ah rating. Here two input signals are Current and Temperature. Current goes to gain block and temperature goes to lookup table and output of both this signal is goes to integrator to track safe charging time and SOC is estimated. Simple design and low computational cost are the main advantages of the coulomb counting method.
The Drawbacks of this method are accumulation of current sensor error and inability to recovery from wrong initial condition because of lack of feedback from voltage measurement, and how SOC is measured in this method.
SOC estimation model-ECU block