Week 7 State of charge estimation
1.Simulate the 3 test cases from harness dashboard and write a detailed report on the results
Solution:
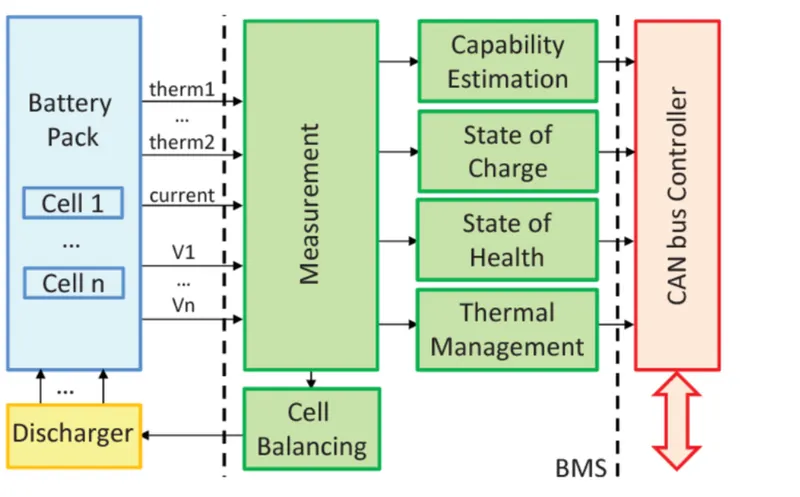
The below flow chart gives the Implementation of BMS for a Battery Pack
The below flow chart gives the information of BMS working in coordination with the battery pack. The inputs to the BMS from the battery pack will be mainly the Current, Voltage and Temperatures. And based on the inputs obatined from the battery pack the BMS will be giving the otputs as SOC, SOH, Themal Management and Capability of total battery pack.
All the BMS outputs are given to CAN bus controller communicate with the Dash board of the vehicle or to the user and also with the charger and others.
Here cell balancing is also implemented to make sure the maximum batttery pack is fully utilized to its full charging and discharging capacity.
Blocks in model:
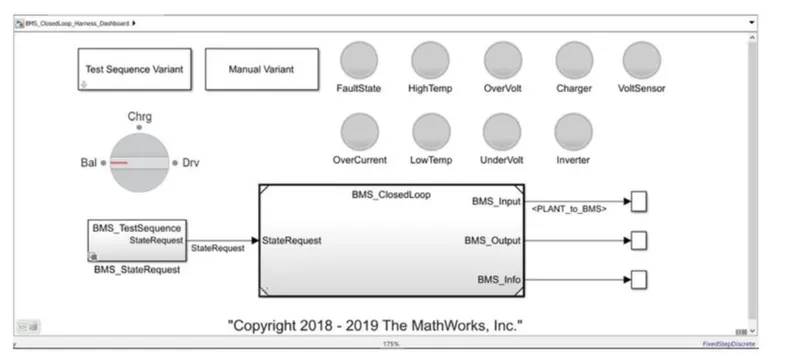
1) Dash board
• Test Sequence Varient (Selector).
• Manual Varient (Selector).
• BMS_Testsequence state request(Subsystem) to provide state request commands.
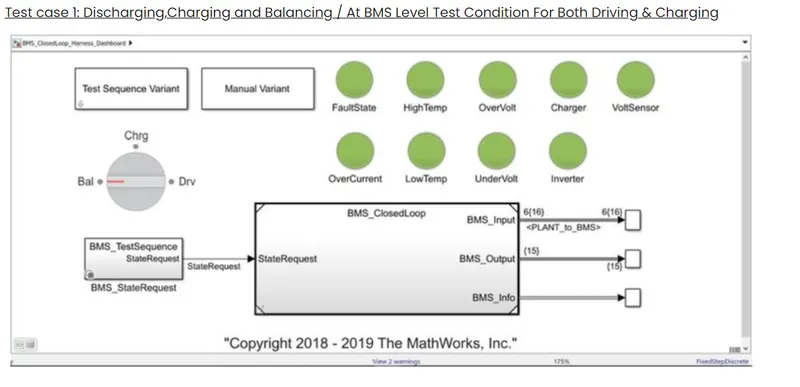
• Lamps to indicate Fault state,High temperature, Over voltage,Over current,charging,voltage sensor operation,inverter operation,low temperature, Under voltage.If any fualt in these red indication will intimate us and all in good conditions indicated by green indication.
Rotating switch for manual Varient changes while running simulation.
• In scope results the SOC of module,Module current,Individual cell voltages, Individual cell temperature,Battery state,Cell balancing states are seen as outputs.
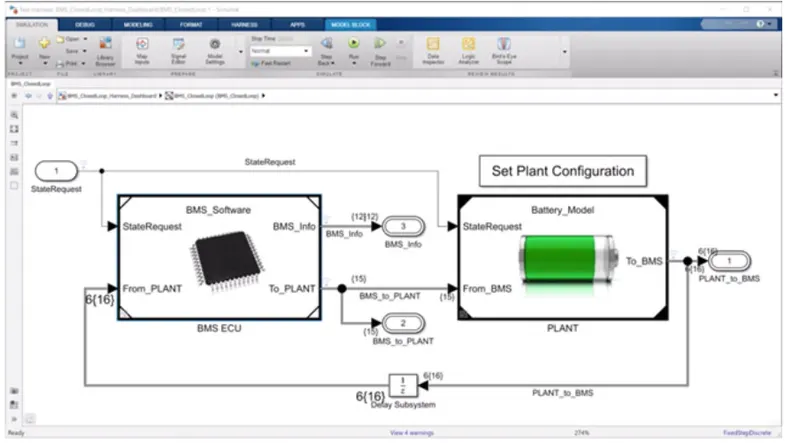
2) BMS_Closed loop
In this main block consist of two subsystems, BMS ECU and PLANT units.
The plant output from plant unit given as input to BMS ECU as BMS_input feedback loop. The state request is given to BMS ECU unit.
The BMS Output commands given as input to plant unit as 'From_BMS Alsp the state request is given to Plant unit.
The final outputs from closed loop model are BMS_input,BMS_Output,BMs_info.
A)To run three test cases from harness dashboard of closed loop BMS control.
We have to test three cases for this model by selecting test sequence varient and select the cases one by one as
fallows,
Test case 1:
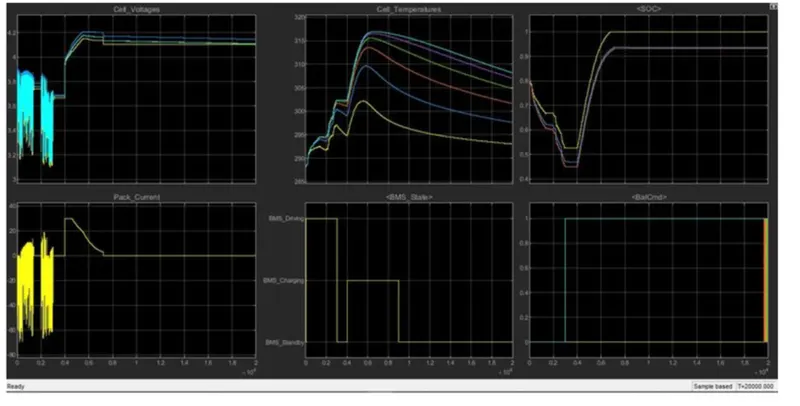
first 3000secs all 6 cells are in drive mode where discharging occurs majorly and in standby mode for lesser uration at approximately 1000 to 2000 secs.
The voltages varies from 3.1V(min) to 3.9v (max) in this range.
From 3000 secs to 4000secs cell balancing occurs and in this stage the module in standby mode and voltage is constant at nearly 3.7V.
After 4000secs charging occurs,voltage raised from 3.7V to 4V. At 4V to 4.2V at constant current as nearly 30 A and after 4.2 V as constant voltage,current reduces from 30A to 2.6A.
at end of the charging and cell balancing occurs upto 9000Secs.
After 9000 secs post charge cell balancing starts. All cell voltages are balancing to a voltage with respect to cell 1 to 4.1 V as shown below,in this stage the pack is in stand by mode.
Cell temperatures:
Initially for 3000Secs the temperature range of cells increases gradually from ambient temperature 288K to 302K.
The temperature of cell 1 is lesser and cell 6 has higher temberature for all stages.
After 3000secs upto 4000secs the cell temperatures are reduced slightly as no current flows through cell in standby mode.
After 4000Secs temperature starts increases exponentially upto constant current region and start reduces as current flow reduces in constant voltage and cell balancing region upto 9000secs.
Cell 1 max temperature raised upto 302K and cell 6 temperature raised upto 317K.
After 9000secs the temperatures still reduces and remains stable at reaching ambient temperature.
BMS State:
For 3000 secs the battery module in drive mode(discharging).
From 3000 secs to 4000secs the battery module in balancing standby mode as shown from result plot.
After 4000 secs upto 9000secs the battery module in charging and balancing mode. After 9000secs only post charge balancing mode operates upto end of simulation.
cell voltages varies from maximum 3.9V and reduces to 3.05V as cutoff voltage upto 9000 secs.Entire capac drained at 9000 secs.
The pack current discharges upto maximum 70A and slight charging occurs during the overall drive.
Some stand by mode conditions are in between the drive modes.
Cell temperature:
Here cell 1 having lesser temperature variations from 288K to approximately 302.5K.
Cell 6 is having higher temperature variation from 288K to approximately 322.5K.
The cell temperatures are slightly reducing in between the drive modes as these durations are in stand by modes.
2.What is coulomb counting? Refer to the above model and explain how BMS implements coulomb counting for SOC estimation ?
Coulomb Counting Method. The Coulomb counting method measures the discharging current of a battery and integrates the discharging current over time in order to estimate SOC. Coulomb counting method is done to estimate the, which is estimated from the discharging current,, and previously estimated SOC values.
The SOC is one of the most important parameters for batteries, but its definition presents many different issues [5]. In general, the SOC of a battery is defined as the ratio of its current capacity () to the nominal capacity (). The nominal capacity is given by the manufacturer and represents the maximum amount of charge that can be stored in the battery.The various mathematical methods of estimation are classified according to methodology. The classification of these SOC estimation methods is different in the various literatures.
four categories.(i)Direct measurement: this method uses physical battery properties, such as the voltage and impedance of the battery.(ii) Book-keeping estimation: this method uses discharging current as the input and integrates the discharging current over time to calculate the SOC. (iii) Adaptive systems: the adaptive systems are self-designing and can automatically adjust the SOC for different discharging conditions. Various new adaptive systems for SOC estimation have been developed. (iv)Hybrid methods: the hybrid models benefit from the advantages of each SOC estimation method and allow a globally optimal estimation performance. The literature shows that the hybrid methods generally produce good estimation of SOC, compared to individual methods.