Week 7 State of charge estimation
Ans .1)
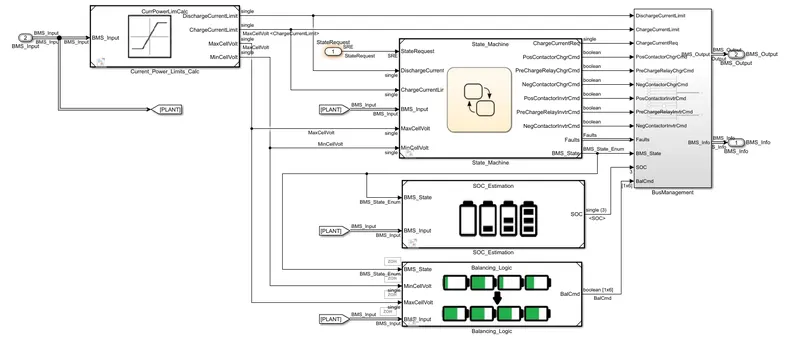
The closed loop harness dashboard model by Mathworks is as shown below,
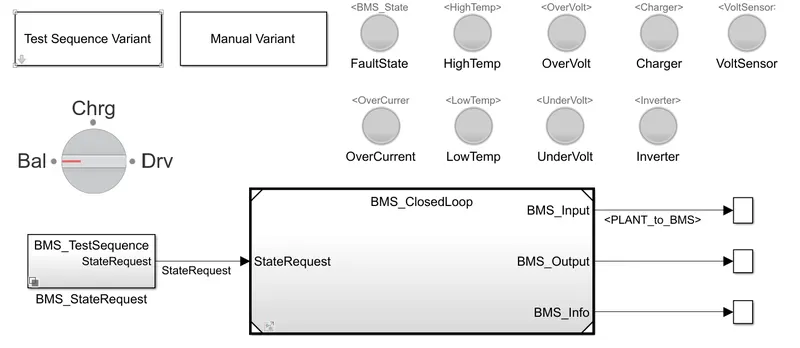
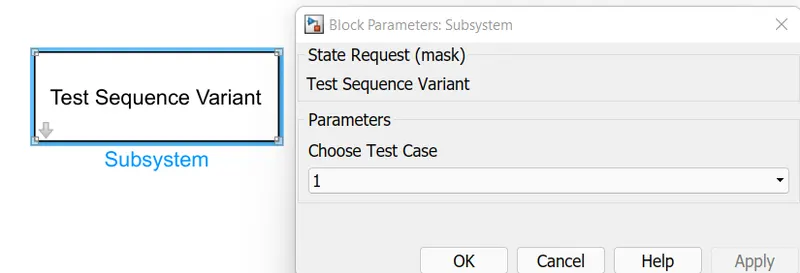
To select one of the 3 test conditions, it can be selected via the Test Sequence Variant block which allows you to select which test needs to be simulated. The first variant was selected initially for the simulation which can be seen below.
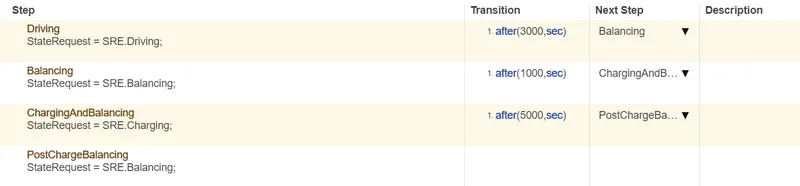
As we look at the test variant as shown below, it states that at the start of the simulation the model will be in the driving condition, thereafter, after 3000 seconds it will be in balancing mode, after 1000 seconds it will be in charging and balancing mode and after 5000 seconds it will be in post charge balancing mode.
After simulating the model for 20000 seconds as given default.
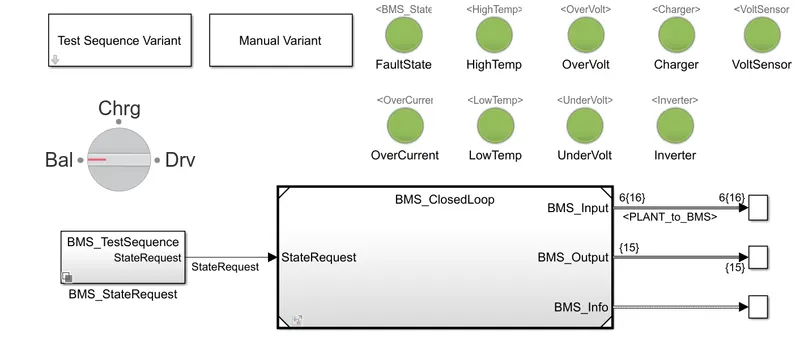
Here, we can see all the lights have turned green as there is no faults or errors in the error in the model.
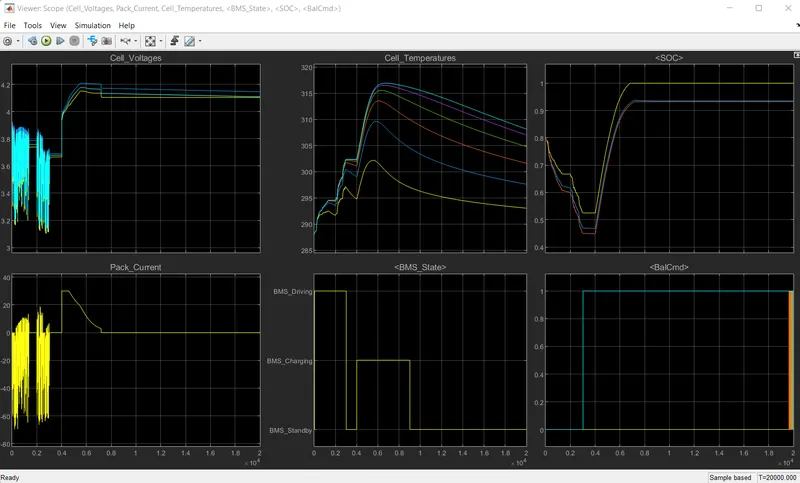
It can be observed from the plot that the vehicle is initially in the driving state and charging was done till 90%. After the charging mode it reaches to the standby mode which can be seen from the BMS state plot. From the Cell temperatures plot it is observed that the battery temperature rises in driving and charging. The battery voltage was increased to 4.2 V while charging. The current plot shows the current value supplied to the vehicle while driving. The SOC was observed to be decreased around 50% in driving condition, which increased while charging.
Coming to the second variant condition (2 case) to simulate.
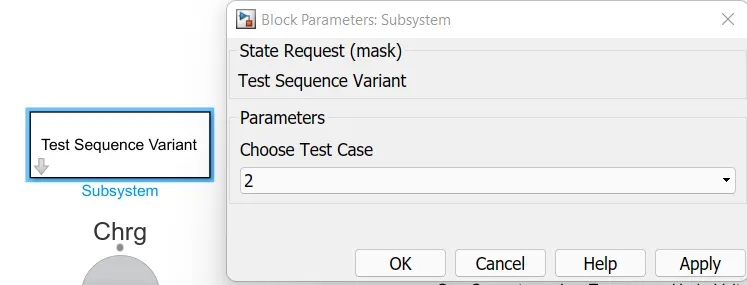
The second varient simulates the below shown conditions.
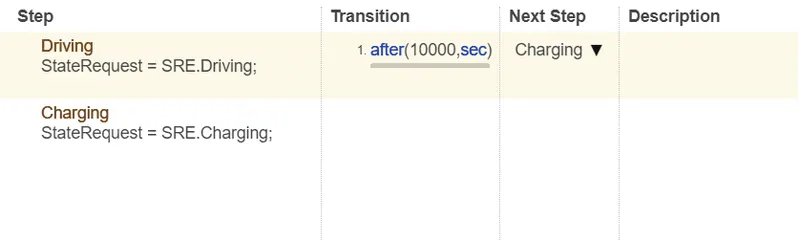
Initially it is the driving condition and after 10000 seconds there is charging condition.
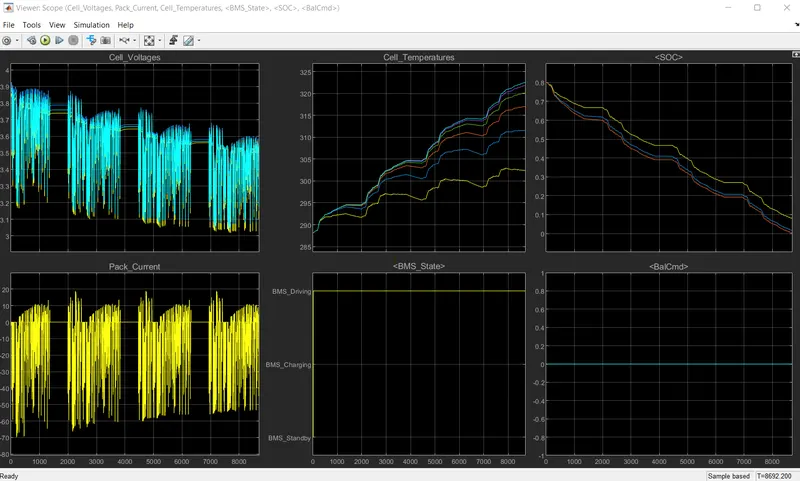
It was observed from the plot that the battery discharges completely in 8692 seconds and the vehicle does not go forward and the charging state was not achieved at 10000 seconds. Hence the vehicle comes to standby condition and simulation stops midway.
Coming to the third variant condition (3 case) to simulate.
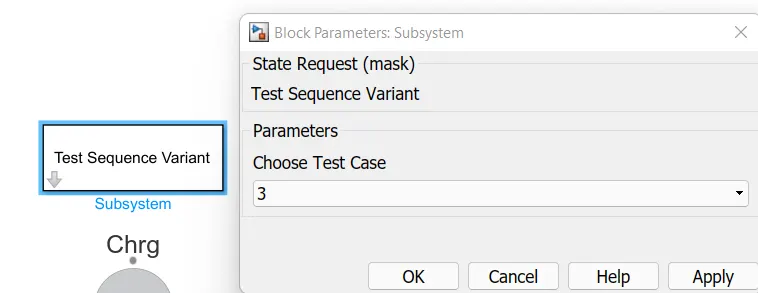
Looking at the condition below for third variant of the simulation. It is just the continuous charging condition from the start till the end of 20000 seconds of simulation.

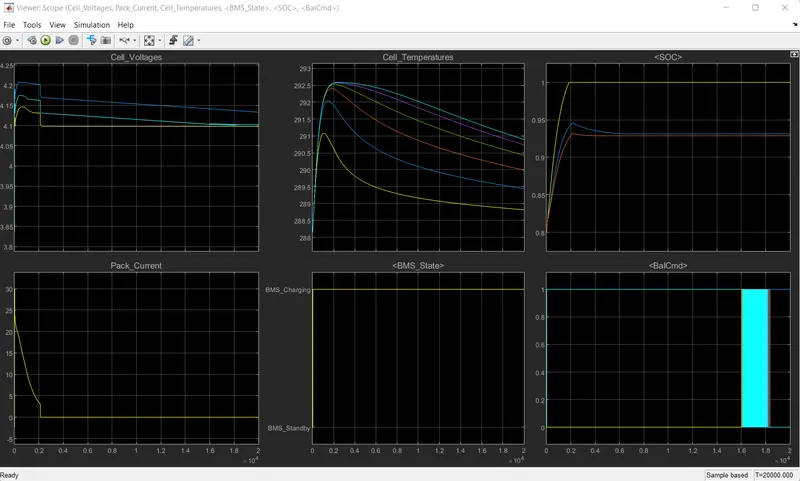
Looking at the plot it can be seen that the battery starts charging and the SOC starts increasing from beginning to around 2000 seconds and stays stable at 100% continuously from 2000 seconds until 20000 seconds. The peak current plot drops from 0 to 2000 seconds and stays constant as the charge is not used anywhere as the driving is not present.
From the above simulated 3 variants of the simulation carried out it was observed that,
In the first simulation all three conditions were simulated such as driving charging and the stable state hence the charging and discharging were observed and in the end the constant 100% SOC was observed because of the standby state of the vehicle.
In the second simulation it was just the discharging as the SOC dropped to 0% in the driving state within 8600 seconds and the charging state was not achieved at 10000 seconds.
In the third simulation, only charging was observed for the first 2000 seconds and the SOC remained at 100% constant for the next 18000 seconds.
Ans.2)
SOC(State Of Charge) is defined as the rate of available capacity to its maximum capacity when a battery is fully charged and describes the remaining percentage of the battery capacity.
To find this SOC % we are using coulomb counting method.
The coulomb counting method measures the discharging current of the battery and integrates the discharging current over time in order to estimate SOC.
Which can be estimated from discharrging current(l(t)), previously estimated S values(SOC(t-1)).The relation can be given as,
SOC (t) = SOC (t-1) + (I(t)/Qn)* Δt
Modified Coulomb counting:-
In this technique discharge current is corrected with a function and corrected current is found out for accurate SOC estimation.
The function can be given as,
Ic(t) = k2I(t)2 + k1I(t) + k0
Where k0, k1, k2 are constant values obtained from the practice experimental data.
The SOC relation can be given as,
SOC (t) = SOC (t-1) + (Ic(t)/Qn)* Δt
SOC estimation in BMS model:-
To see the model of coulomb counting technique in BMS model click the subsystem of SOC_Estimation and click Coulomb counting.
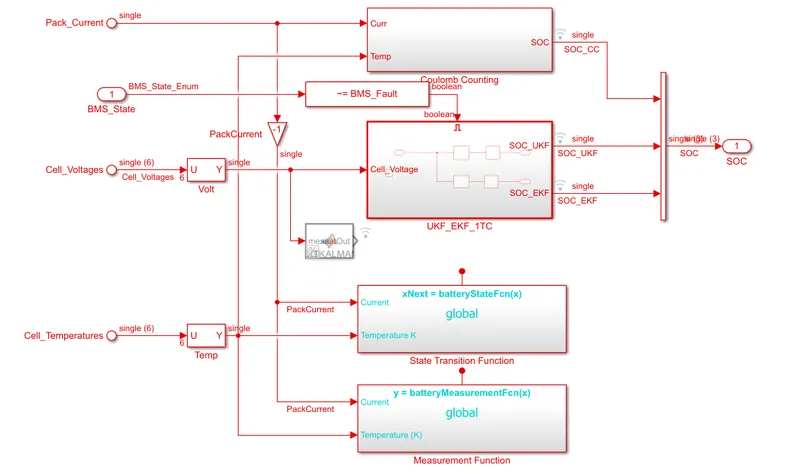
It is developed as shown below,
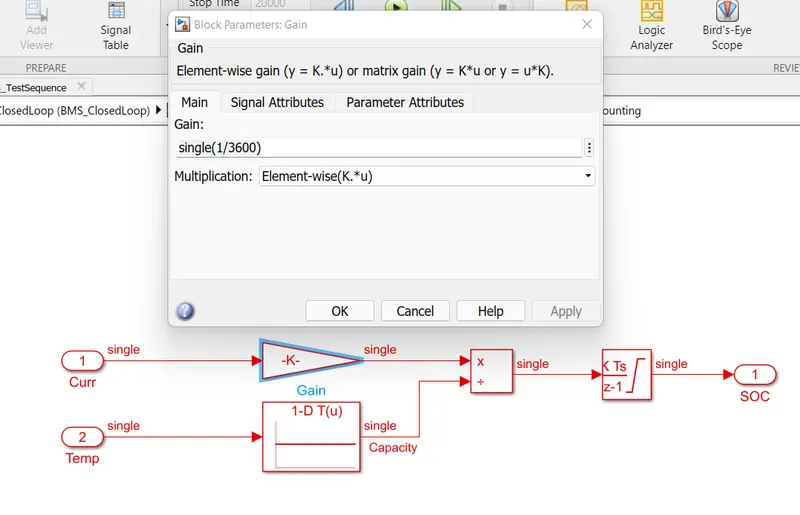
Here the discharge current from battery given to gain with value as 1/3600 to convert current to Ahr.
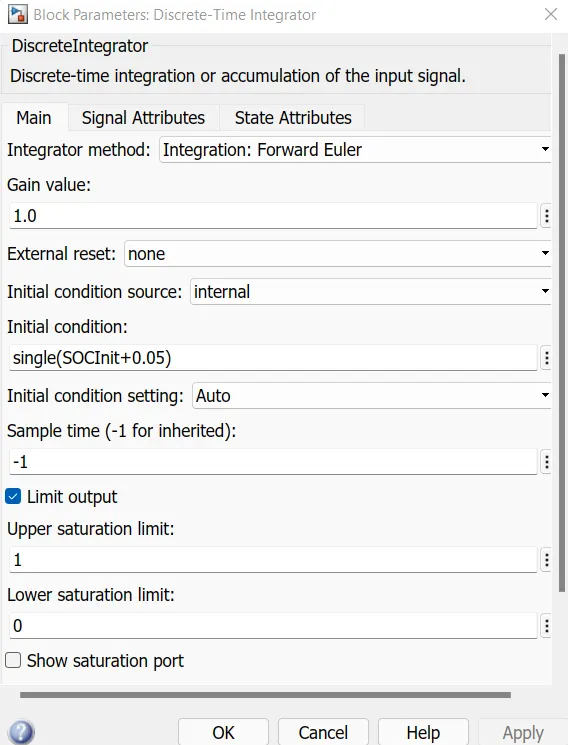
The value is divided by capacity due to temperature change. Then integrated with a gain value of 1 with sample time -1 as we are using discrete integrator.
The saturation limits are from 0 to 1.
We will get the SOC values from 0 to 1 multiplied with 100 to get in percentage of SOC.