Week 7 State of charge estimation
AIM: To estimate the state of charge (SOC) using Coulomb Counting method
OBJECTIVES:
- Simulate the Harness Dashboard model for 3 test cases and observe the results.
- Define coulomb counting and explain how BMS will implement coulomb counting method for SOC estimation.
- Simulate the 3 test cases from harness dashboard and write a detailed report on the results
Layout of Hardness Dashboard
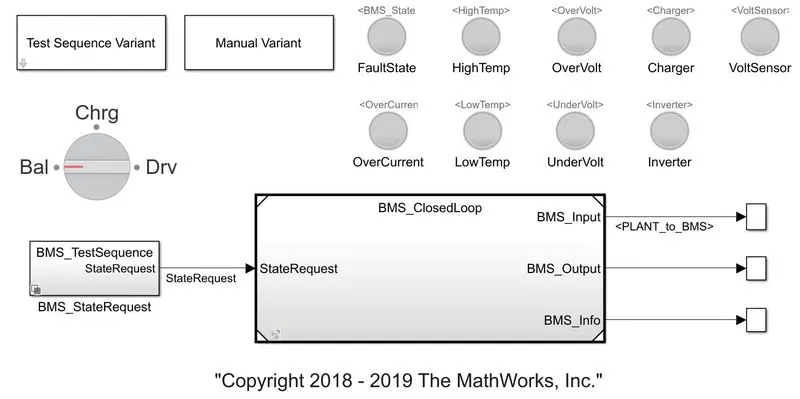
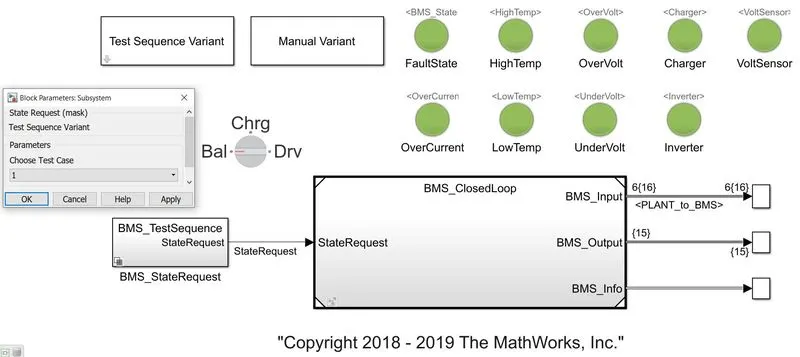
Test Case 1:
In this test case all three modes (Driving, Charging and Standby) are simulated. Driving is done from 0 to 3000 seconds and then balancing is done from 3000 to 4000 seconds, during which time the vehicle is in standby mode. The next stage after balancing is charging, which takes from 4000 to 9000 seconds and from 9000 to 20000 seconds balancing (Standby) is carried out till the simulation is completed.
Results:
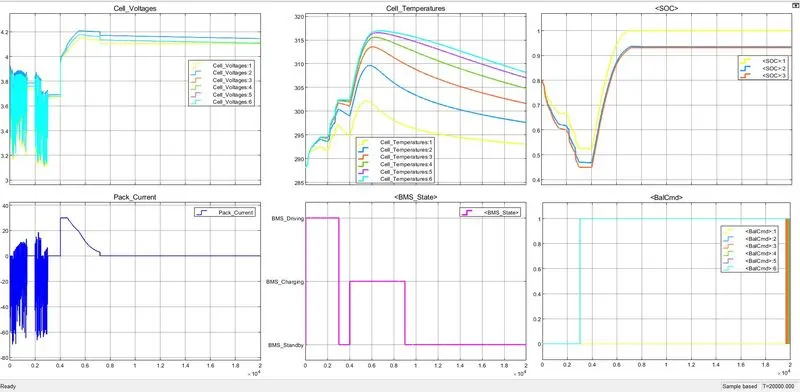
Cell Voltage Plot
We can observe that cell voltages for 6 individual cells are plotted in the first plot. From 0 to 3000 seconds driving action is done so, the voltages of the cells are fluctuating from 3.9V to 3.2V (Considering each cell performance). Charging action is done from 4000 to 9000 seconds During the charging phase, the voltage is increased to 4.2V. After 9000 seconds balancing mode have been carried out still 20000 seconds.
Peak Current Plot
Battery current is reduced during driving state (-70A), it is observed in the negative direction. During charging the current raised to 30A and then drop to zero during standby state.
Cell Temperature Plot
The temperature of the cells increased during driving state and gradually decreased during charging and standby states. We can notice that the sixth cell has the highest temperature, indicating that it is discharged the most and remaining cells (5, 4, 3, 2, 1) are gradually have the less discharge rate which means the cells temperatures are gradually low.
BMS State Plot
It shows the states of operation (Driving, Charging and Standby) the driving time ranged from 0 to 3000 seconds, from 3000 to 4000 standby state is activated, the charging time ranged from 4000 to 9000 seconds, and the standby time ranged from 9000 to 20000 seconds.
SOC Plot
Initially the SOC for all the cells is set to 80% (0.8). During driving SOC rapidly decreasing to 0.45 for cell 2 and 3 and 0.52 for cell 1. While charging SOC increased to 0.92 for cells 2 and 3 and 100% for cell 1. In standby mode, the SOC will not change.
Cell Balancing Command Plot
From the sixth cell of the battery pack to the first cell, the balancing of cells is presented in descending sequence, as seen in the temperature block.
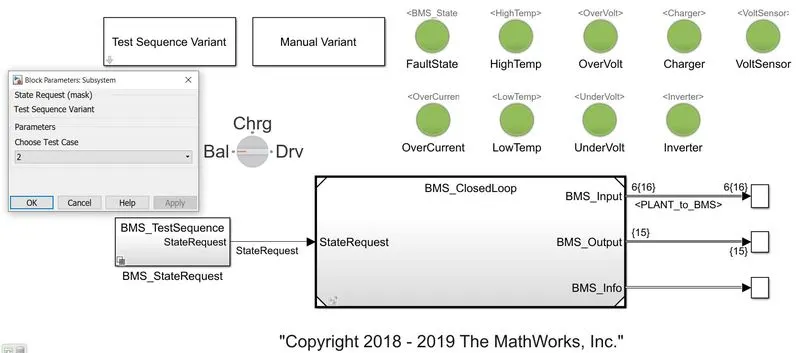
Test Condition 2:
In this test case driving state is maintained until 10000 seconds, but the simulation will run for only 8692.2 seconds because the SOC will become 0% by the end of 8692.2seconds.
Results:
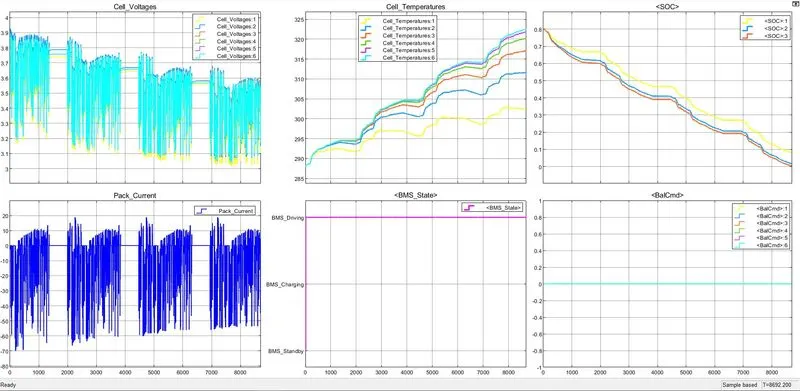
Cell voltages range from 3.9 to 3 volts, where 3V is the individual cell's cut-off voltage.
The battery pack can discharge up to 70A of electricity, which is its maximum capacity.
The temperature of the cells continues to rise as a result of the constant discharge of current.
BMS driving mode will be activated until the battery pack's SOC is depleted (0%). Here, there is no charging or standby mode. The electric vehicle continues to run until the battery pack is entirely depleted.
SOC continuously decreases to 0%, because the battery pack has not been charged.
Cell balancing is not performed while charging. The cells have been discharged evenly until they are shut off, hence there is no cell balancing signal.
Test Condition 3:
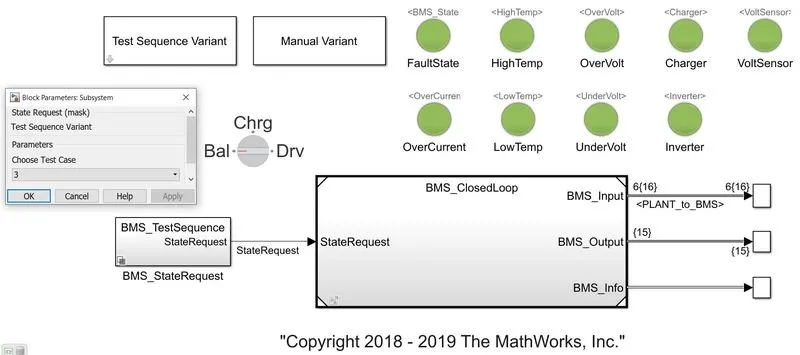
In this test case only charging state is activated from 0 to 20000 seconds.
Results:
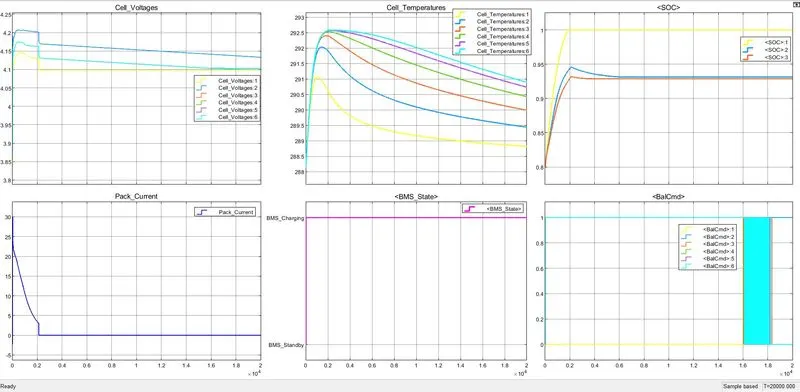
The fully charged voltage ranges for the cells is between 4.1 to 4.2 volts.
Fully charged pack current increased to 30A and then decreased to zero because, after being fully charged, the battery can no longer take current.
Cell temperatures were also higher at the starting due to the initial charging current, but they are quickly stabilized.
BMS state was set to Charging state for the entire run of 20000 seconds.
SOC was set to 80% at the beginning and then the pack was fully charged to their maximum capacity.
Balancing orders were followed from the sixth cell to the first cell.
- What is coulomb counting? Refer to the above model and explain how BMS implements coulomb counting for SOC estimation?
Coulomb Counting
Coulomb counting is a technique used to track the State of Charge of a battery pack. It works by integrating the active flowing current (measured in amps) over time to derive the total sum of energy entering or leaving the battery pack. This produces a capacity that is typically measured in Amp-hours.
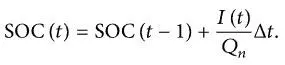
The Coulomb counting method measures the discharging current of a battery and integrates the discharging current over time in order to estimate SOC. Coulomb counting method is done to estimate the SOC(t), which is estimated from the discharging current I(t), and previously estimated SOC values, SOC(t-1). SOC is calculated by the following equation
But there are several factors that affect the accuracy of Coulomb counting method including temperature, battery history, discharge current, and cycle life.
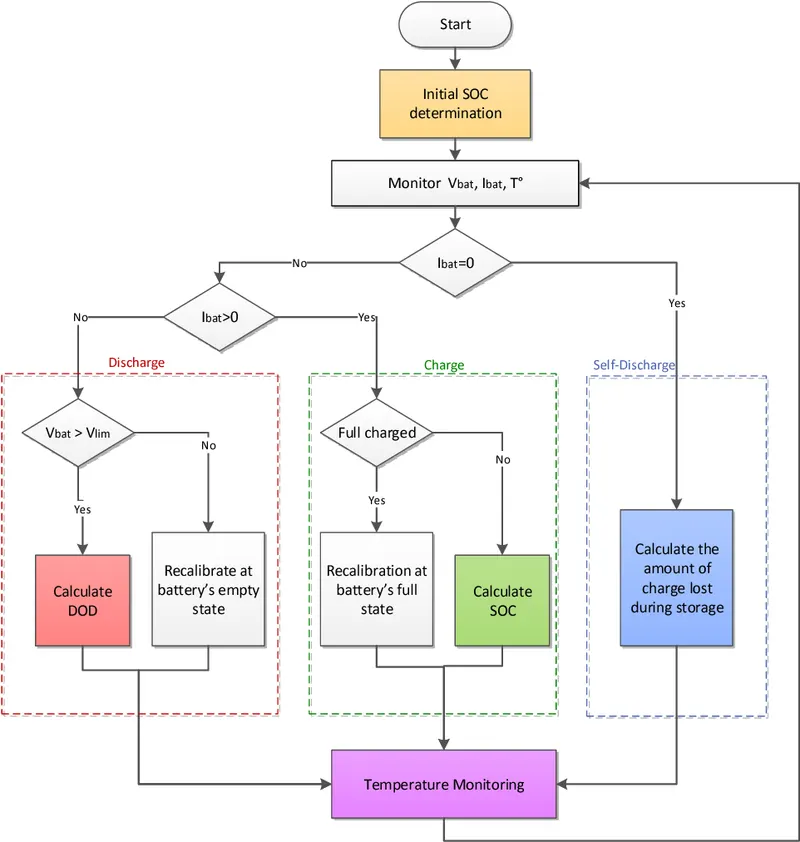
Flow chart of Coulomb Counting method for calculation of SOC
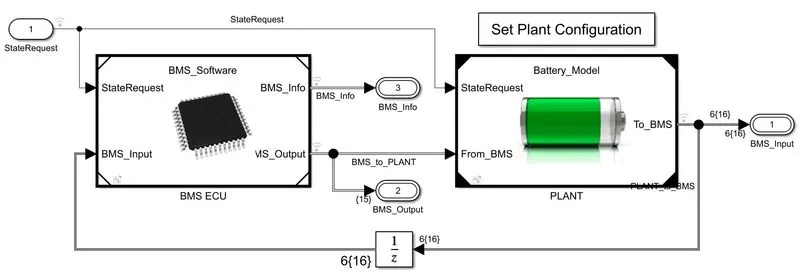
Compute the estimated SOC of the battery management system, by inserting the plant block into this model, which incorporates BMS ECU and PLANT blocks.
Firstly, we require an accurate estimate of battery SOC before we charge our vehicle. In the battery system, we don't assess the state of charge; instead, we measure things like battery pack current, cell voltage, and cell voltage using signals from the plant. After entering the BMS ECU block, we can see the state machine, SOC estimation, and balancing logic block.
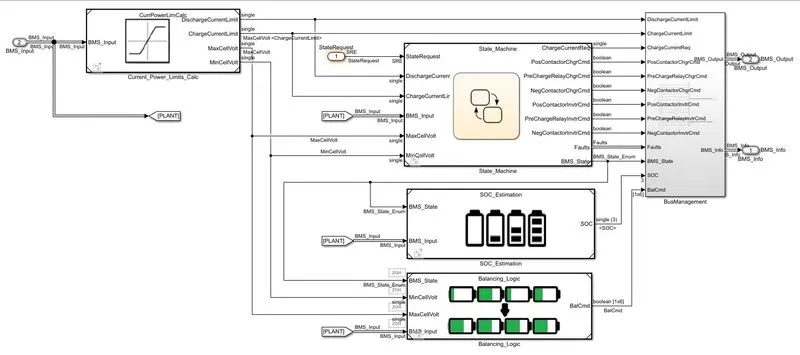
Three distinct state of charge estimating strategies are shown in this SOC estimate block. Each strategy has its own set of benefits and drawbacks. Coulomb counting is the first approach, while unscented (ukf) and extended Kalman filter are the other two (ekf).
We will concentrate only on Coulomb Counting method only
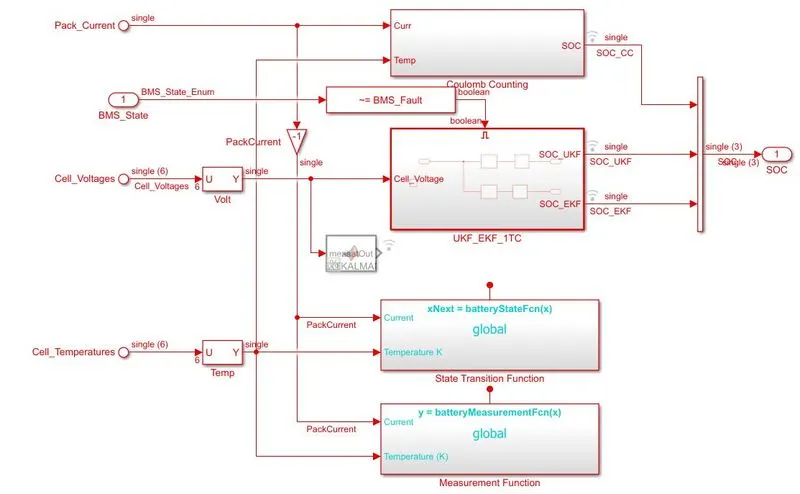
Coulomb Counting block accepts two input signals: current and temperature, with the current signal going to the gain block and the temperature signal going to the battery time and current lookup tables. Both blocks are linked to the split block where the 1- lookup table data is divided with gain block values and these signals are sent to the discrete-time integrator to track the charge, finally the calculation of state of charge is done.
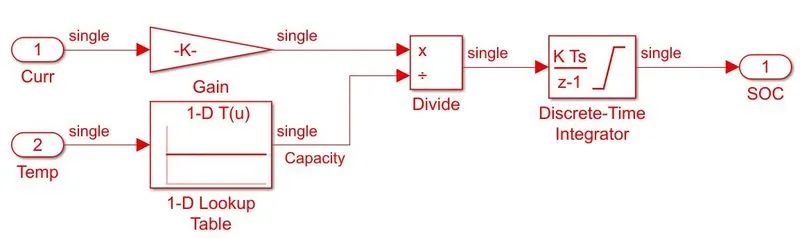
The positives of this are its simplicity and cheap capital cost, while the disadvantages include a build-up of current sensor error and its inability to recover from the erroneous start condition. due to a lack of voltage measurement feedback.
CONCLUSION:
Hence, we have Simulated the Harness Dashboard model for 3 test cases and observe the results. Complete details of coulomb counting have been given and explained how the BMS will implement coulomb counting method for SOC estimation.
REFERENCES: