Project 1 - Parsing NASA thermodynamic data
AIM
To write a program to read the given NASA thermodynamic data file and to find the thermodynamic properties of the various species data.
OBJECTIVES
- Write a function that extracts the 14 co-efficients and calculates the enthalpy, entropy and specific heats for all the species in the data file.
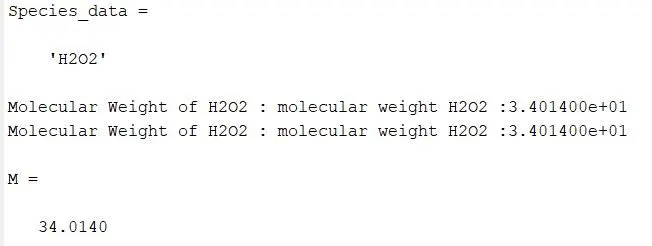
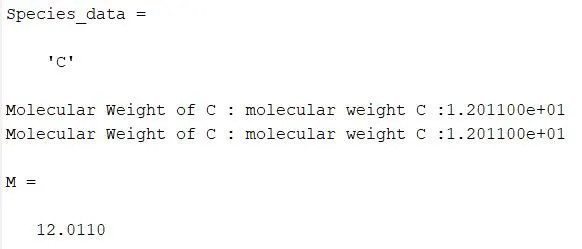
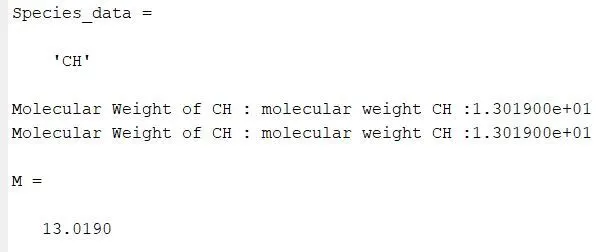
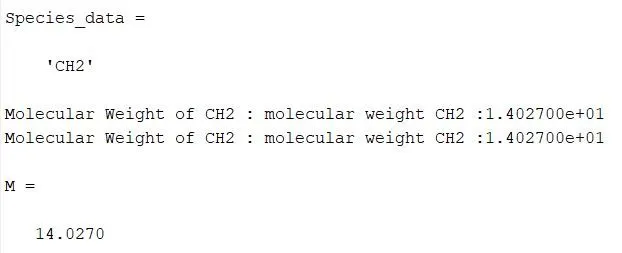
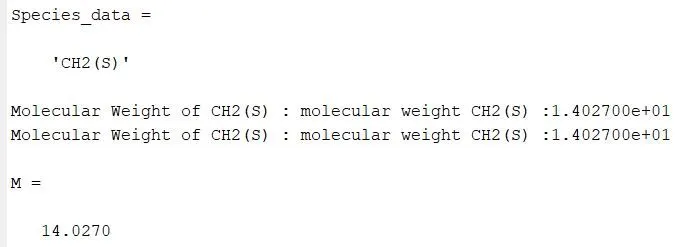
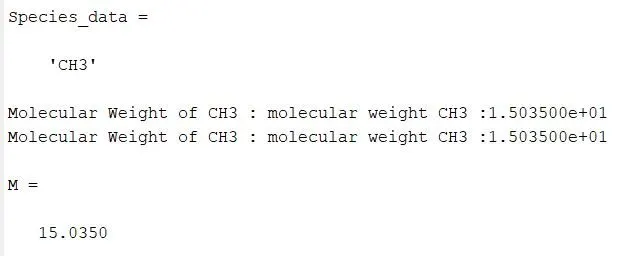
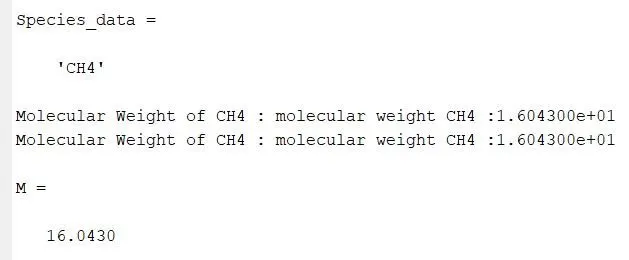
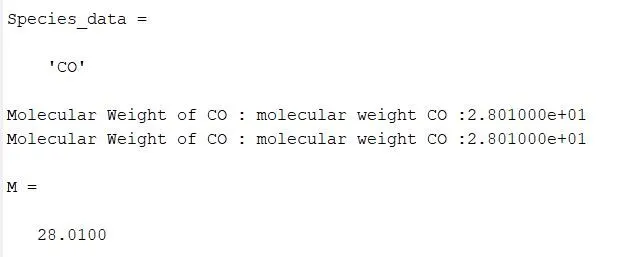
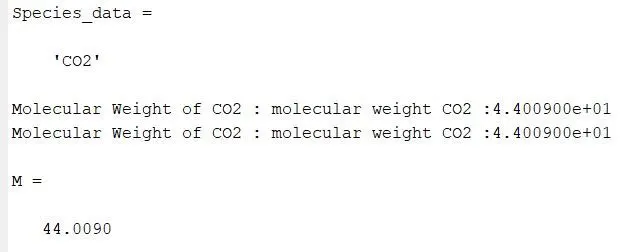
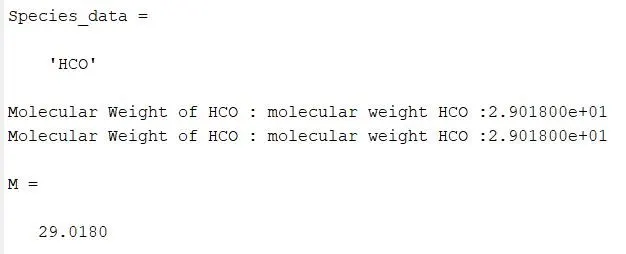
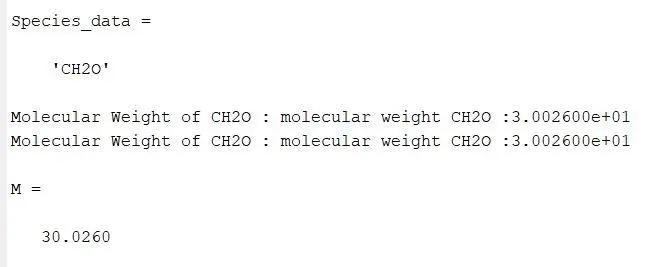
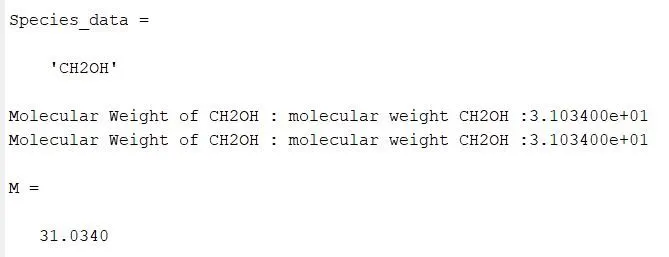
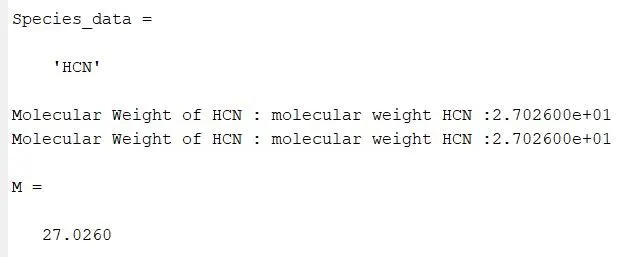
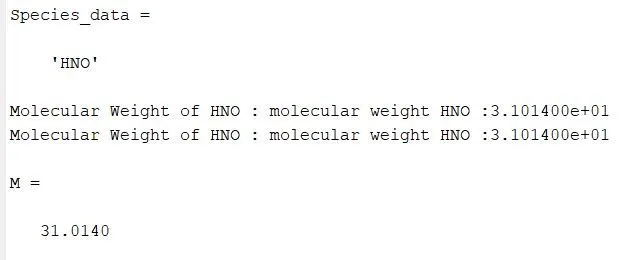
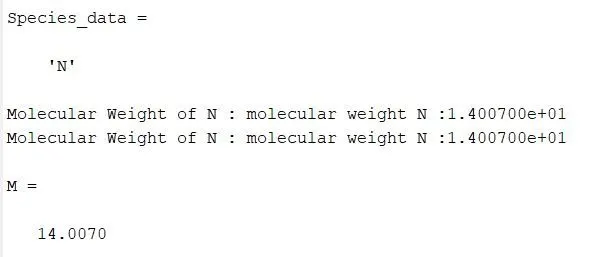
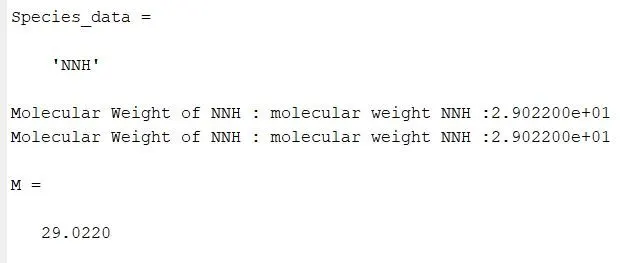
- Calculate the molecular weight of each species and display it in the command window.
- Plot the Cp, Enthalpy and Entropy for the local temperature range (low temperature : high temperature) specific for each species.
- Save the plots as images with appropriate names and dump them in separate folders for each species with suitable name. All these should be generated automatically.
- The main program that you will submit will just take the "THERMO.dat" file as an input and generate Cp, H and S plots.
- Write a detailed report to describe the logic behind the program.
- Screenshot of the window where all the folders are saved should be attached.
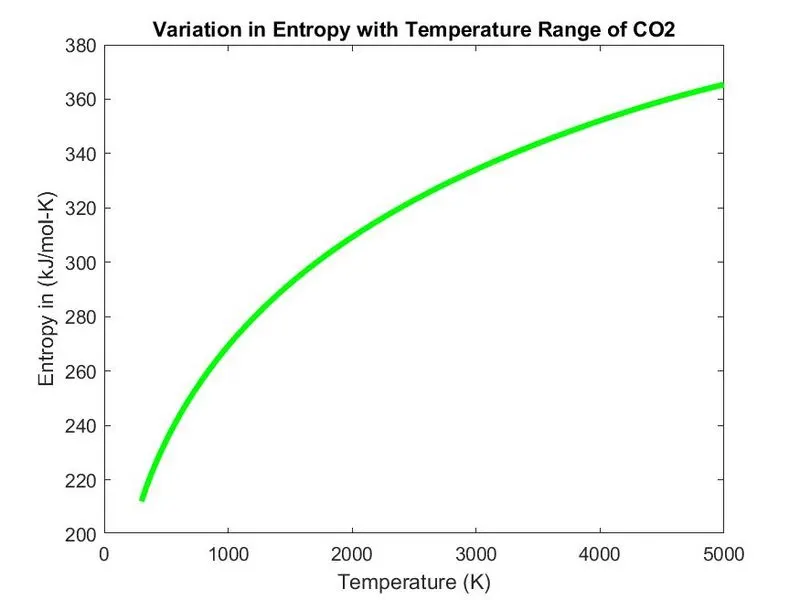
- Plotting for O2, N2 and Co2 species should be attached.
Thermodynamic Data
Thermodynamic data for individual species are necessary for peforming equilibrium chemistry and finite-rate chemical kinetics calculations. These data typically provide the thermodynamic properties (Specific heat, Enthalpy and Entropy) of a species as a function of temperature.
NASA Polymers
    Cp/R = a1 + a2 T + a3 T^2 + a4 T^3 + a5 T^4

    H/RT = a1 + a2 T /2 + a3 T^2 /3 + a4 T^3 /4 + a5 T^4 /5 + a6/T

    S/R  = a1 lnT + a2 T + a3 T^2 /2 + a4 T^3 /3 + a5 T^4 /4 + a7
- The FIRST 7 coefficients are HIGH-temperature coefficients (Above 1000K) and the SECOND 7 coefficients are LOW-temperature coefficients (Below 1000 k).
- Use the LOCAL TEMPERATURE RANGES which is unique for each individual species, not the GLOBAL TEMPERATURE RANGE.
NASA thermodynamic data file
The given file name as 'THERMO.dat', where these file contains 53 different elements, each element contains 14 co-efficients. This elements have there own temperaute range and co-efficients are used to calculate the specific heat, enthalpy and entropy.
Specific Heat (Cp)
It is defined as the quantity of heat requires to raise the temperature of one gram of substance by one degree celsius. The unit of specific heat is calories or joules per gram per degree celsius.
| Cp = (a1 + a2 T + a3 T^2 + a4 T^3 + a5 T^4)*R |
- Function for Calculating Specific heat (Cp)
% Function for Calculating Specific heat
function Cp = specific_heat(a1,a2,a3,a4,a5,a8,a9,a10,a11,a12,T,R,global_mid_temp)
% If less than global temperature,then consider minimum temperature coefficients
if  T <= global_mid_temp
Cp = (a8+(a9*T)+(a10*(T).^2)+(a11*(T).^3)+(a12*(T).^4)).*R;
else
% Else consider maximum temperature coefficients
Cp = (a1+(a2*T)+(a3*(T).^2)+(a4*(T).^3)+(a5*(T).^4)).*R;
end
Enthalpy (H)
It is an property of thermodynamic system and defined as the sum of internal energy and the product of pressure and volume. The total enthalpy of a system can not be measure directly because the internal energy contains the components that are unknown, not easily accessible.
| H = (a1 + a2 T /2 + a3 T^2 /3 + a4 T^3 /4 + a5 T^4 /5 + a6/T)*RT |
- Function for Calculating Enthalpy (H)
% Function for Calculating Enthalpy
function H = Enthalpy(a1,a2,a3,a4,a5,a6,a8,a9,a10,a11,a12,a13,T,R,global_mid_temp)
% If less than global temperature,then consider minimum temperature coefficients
if T <= global_mid_temp
   H = (a8+((a9*T)/2)+((a10*(T).^2)/3)+((a11*(T).^3)/4)+((a12*(T).^4)/5)+((a13./T)))*R.*T;
else
% Else consider maximum temperature coefficients
   H = (a1+((a2*T)/2)+((a3*(T).^2)/3)+((a4*(T).^3)/4)+((a5*(T).^4)/5)+((a6./T)))*R.*T;
end
Entropy (S)
Entropy is an measurable physical property, associated with a state of disorder, randomness and uncertainty. It is an loss of energy which is available to do work.
Second law of thermodynamic states that the total entropy of a system either increases or remains constant, it never decreases.
| S = (a1 lnT + a2 T + a3 T^2 /2 + a4 T^3 /3 + a5 T^4 /4 + a7)*R |
- Function for Calculating Entropy
% Function for Calculating Entropy
function S = Entropy(a1,a2,a3,a4,a5,a7,a8,a9,a10,a11,a12,a14,T,R,global_mid_temp)
% If less than global temperature,then consider minimum temperature coefficients
if T <= global_mid_temp
   S = (a8.*log(T)+(a9.*T)+(a10*((T).^2)/2)+(a11*((T).^3)/3)+(a12*((T).^4)/4)+a14).*R;
else
% Else consider maximum temperature coefficients
   S = (a1.*log(T)+(a2.*T)+(a3*((T).^2)/2)+(a4*((T).^3)/3)+(a5*((T).^4)/4)+a7).*R;
end
Molecular Weight
It is defined as the measure of the sum of the atomic weight values of atoms in a molecule. It is commonly abbreviated as M.W. or MW. units are Daltons(Da).
- Function for calculating Molecular Weight
% Function for Calculating Molecular Weight
function Mol_weight = Molecular_weight(Species_SP)
         % Atomic Name(Standard)
         % Hydrogen, Carbon, Oxygen, Nitrogen, Argon
         atomic_name = ['H','C','O','N','A'];

         fprintf('Molecular Weight of ');
         fprintf(Species_SP);
         fprintf(' : ');

         % Atomic Number(Standard)
         Atomic_Weight = [1.008 12.011 15.999 14.007 39.948];

         % Starting Range of Molecule
         Mol_weight = 0;

         % Adding Atomic number to obtain particular value
        for i = 1:length(Species_SP)
            for j = 1:length(atomic_name)
                if strcmpi(Species_SP(i),atomic_name(j))
                   Mol_weight = Mol_weight +Atomic_Weight(j);
                   position = j;
                end
            end

            n = str2ouble(Species_SP(i));

            if n>1
                Mol_weight = Mol_weight + Atomic_Weight(position)*(n-1);
            end
        end
            fprintf('molecular weight %s :',Species_SP);
            fprintf('%d',Mol_weight);
            disp(' ');
Main Program for Parsing the given NASA thermodynamic data file:
% Program for Parsing the NASA Thermodynamic data file
clear all
close all
clc

% input
% Universal gas constant(J/mol-k)
R=8.314;

No.of_elements = 53;
No.of_co-efficients_for_each_element = 14;

% Now we have to Read the NASA Thermodynamic data file
% Opening the file for reading
f1=fopen('THERMO.dat','r');
gt=fgetl(f1);

% Given Header Information to read the temperature
temp=fgetl(f1);

% Spliting the string from the line
t=strsplit(temp,' ');

% Converting string cells to numbers using str2num,
global_low_temp=str2double(t{2});
global_mid_temp=str2double(t{3});
global_high_temp=str2double(t{4});

% Temperature Range
T=linspace(global_low_temp,global_high_temp,1500);

% Skipping next three comment lines in the file
for i = 1:3
    gt=fgetl(f1);
end

% Now reading the species data
 for i = 1:53
     gt=fgetl(f1);
     A=strsplit(gt,' ');
     Species_data=(A{1})

     % Extracting fist 7 Higher temperature co-efficients
     % Fist line
     tline_1=fgetl(f1);
     p=strfind(tline_1,'E');

     a1=tline_1(1:p(1)+3);
     a1=str2double(a1);
     a2=tline_1(p(1)+4:p(2)+3);
     a2=str2double(a2);
     a3=tline_1(p(2)+4:p(3)+3);
     a3=str2double(a3);
     a4=tline_1(p(3)+4:p(4)+3);
     a4=str2double(a4);
     a5=tline_1(p(4)+4:p(5)+3);
     a5=str2double(a5);

     % Second line (remaining 2 higher temperature co-efficients)
     tline_2=fgetl(f1);
     q=strfind(tline_1,'E');

     a6=tline_2(1:q(1)+3);
     a6=str2double(a6);
     a7=tline_2(q(1)+4:q(2)+3);
     a7=str2double(a7);

     % Extracting second 7 lower temperature co-efficients
     a8=tline_2(q(2)+4:q(3)+3);
     a8=str2double(a8);
     a9=tline_2(q(3)+4:q(4)+3);
     a9=str2double(a9);
     a10=tline_2(q(4)+4:q(5)+3);
     a10=str2double(a10);

     % Third line(remaining 4 lower temperature co-efficients)
     tline_3=fgetl(f1);
     r=strfind(tline_1,'E');

     a11=tline_3(1:r(1)+3);
     a11=str2double(a11);
     a12=tline_3(r(1)+4:r(2)+3);
     a12=str2double(a12);
     a13=tline_3(r(2)+4:r(3)+3);
     a13=str2double(a13);
     a14=tline_3(r(3)+4:r(4)+3);
     a14=str2double(a14);

     % Calculating Specific heat, by calling the function
     Cp = specific_heat(a1,a2,a3,a4,a5,a8,a9,a10,a11,a12,T,R,global_mid_temp);

     % Calculating Enthalpy, by calling the function
     H = Enthalpy(a1,a2,a3,a4,a5,a6,a8,a9,a10,a11,a12,a13,T,R,global_mid_temp);

     % Calculating Entropy, by calling the function
     S = Entropy(a1,a2,a3,a4,a5,a7,a8,a9,a10,a11,a12,a14,T,R,global_mid_temp);

     % Calculating molecular weight of species, by calling the function
     Mol_weight = Molecular_weight(Species_data);

     % Read & Write Molecular list
     Molecular_data_list = fopen('Molecular_weight.txt','a+');
         fprintf( Molecular_data_list,'Molecular weight of %s is %d n',Species_data,Mol_weight);
         fclose(Molecular_data_list);

     % plotting of Cp,H,S,Temp,Species_data and Saving the data in separate folder
     cur_dir=pwd;
     mkdir(Species_data);
     cd(Species_data);

     % plotting Specific heat Vs Temperature Range
     figure(1)
     grid on
     plot(T,Cp,'linewidth',3,'color','k');
     xlabel('Temperature (K)');
     ylabel('Specific Heat (kJ)');
     title(sprintf('Variation in Specific Heat with Temperature Range of %s',Species_data));
     saveas(figure(1),'Specific_Heat.jpg');

     % Plotting Enthalpy Vs Temperature Range
     figure(2)
     grid on
     plot(T,H,'linewidth',3,'color','r');
     xlabel('Temperature (K)');
     ylabel('Enthalpy in (kJ/mol)');
     title(sprintf('Variation in Enthalpy with Temperature Range of %s',Species_data));
     saveas(figure(2),'Enthalpy.jpg');

     % Plotting Entropy Vs Temperature Range
     figure(3)
     grid on
     plot(T,S,'linewidth',3,'color','g');
     xlabel('Temperature (K)');
     ylabel('Entropy in (kJ/mol-K)');
     title(sprintf('Variation in Entropy with Temperature Range of %s',Species_data));
     saveas(figure(3),'Entropy.jpg');

     % Current directory
     cd(cur_dir);

     % Now Opening the Molecular weight data file

     M = Molecular_weight(Species_data)
     f2 = fopen('molecular mass','W');
     fprintf('%s n %s n %f n','species','Molecular mass',M)
     fclose(f2)
 end
Explanation
- Started with clear all, close all and clc to remove the data present in the work space, command window and to remove the images or plots. Given input value for Universal gas constant (R) as 8.314 (J/molK).
- To open the 'THERMO.dat' file use 'fopen' command to open the file and use 'r' for reading the file.
- Then used 'fgetl' to read the next text lines and 'strsplit' command is used to split the temperature in to a string cell.
- To convert the string cell to number 'str2double' or 'str2num' commands have been used. so, with this conversion the temperature values will be useful to solve the 'THERMO.dat' file. 'linspace' command is used to get the linearly spaced temperature values from 300 to 5000.
- Next by creating 'for loop' next three comment lines were skipped form the file.
- To read the 53 elements(species) data, used 'for loop'. By reading these data we can plot Cp, H and S with temperature ranges and we can find the molecular weight of the each element.
- Now, we need to extract first 7 higher temperature co-efficients and second 7 lower temperature co-efficients form the next 3 line
- By using 'strfind' command we can find the position of 'E' (string), this should be done for 3 lines and used p, q and r variables.
- Then, these temperaure co-efficients values are in the form of strings and they are converted to numbers by using 'str2double' command.
- Now, we need to call the function of specific_heat, Enthalpy, Entropy and Mol_weight to bring out the required output.
- Then, used 'fopen' to open the 'Molecular_weight.txt' file to view the results. and used 'fpriftf' to change the formatted data to file.
- Identify the current directory and save the file using 'mkdir' command and change the working directory using 'cd' command by giving a file name (species_data).
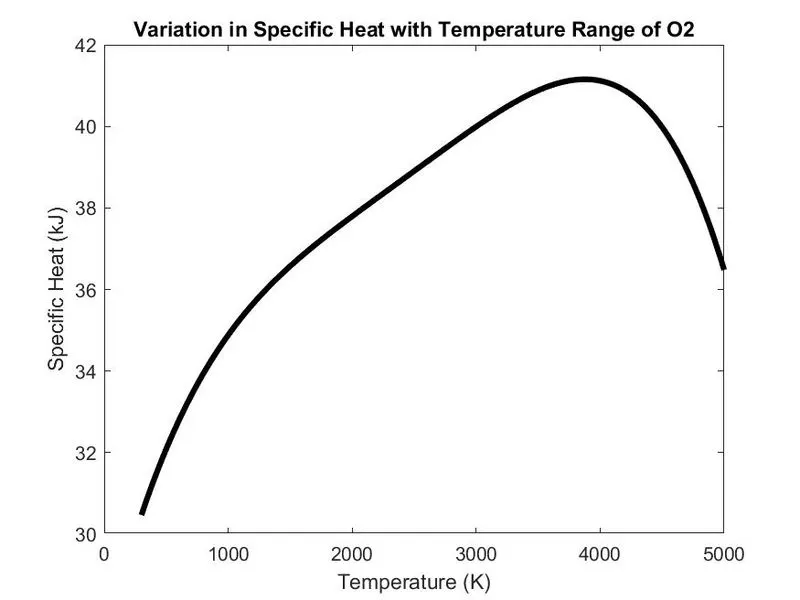
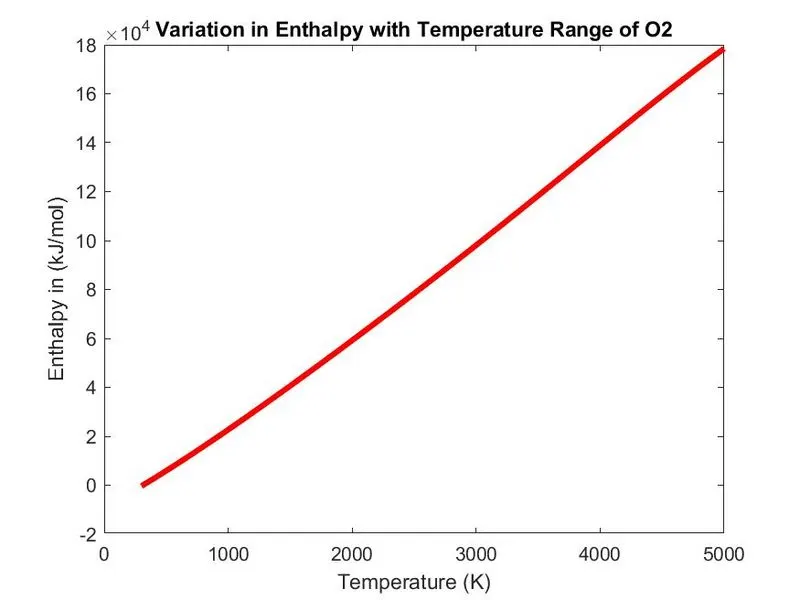
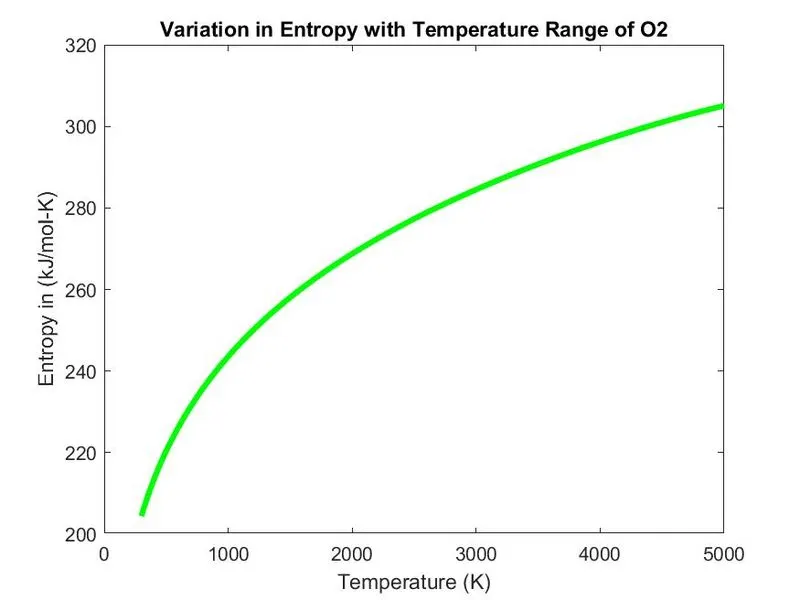
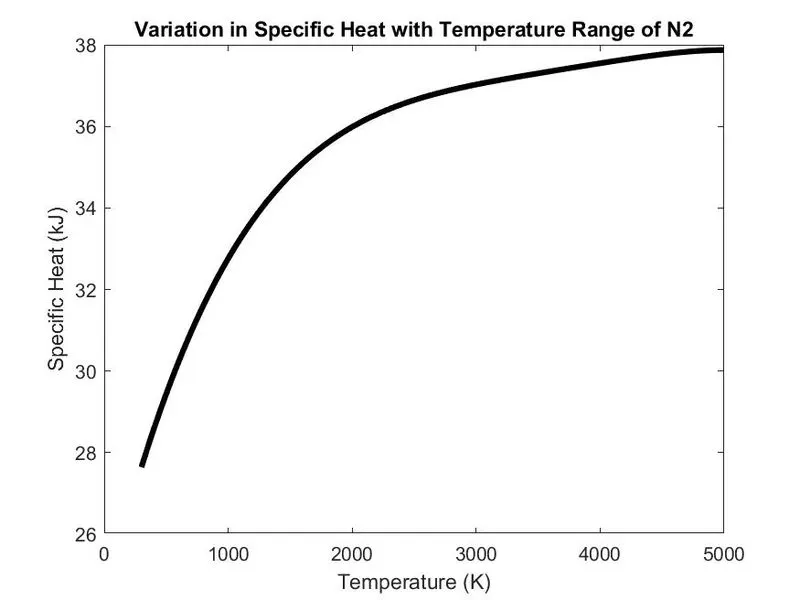
- Now, we need to plot Specific heat, Enthalpy, Entropy with Temperature range for the elements (species) of O2, N2 and Co2.
- We need to save the each and every figure by using 'saveas' by providing separate file name.
- Finally, open the 'molecular mass' file and convert the formatted data to file using 'fprintf' and close the file using 'fclose'.
Syntax used in this program
| fopen and 'r' | To open the file and reading the file |
| fgetl | returns to the next line of the file |
| strsplit | It will split on the first matching delimeter |
|
str2double or str2num |
It will convert the character array or string scalar to an numetric matrix |
| strfind | It finds the starting indices ('E') of sub strings in a character vector |
| fprintf | It prints multiple numeric values and literate text to the screen |
| pwd | It chages the current folder to the local folder and stores the path |
| mkdir | It creates the folder in the current directory |
| cp | To change working directory |
| sprintf | It is used to write formatted output to the string |
| saveas | It creates the bar chart and saves it as a jpg or png file |
Outputs
Screenshot of the window where all the folders are saved

Plotting of Specific Heat, Enthalpy and Entropy with Temperature range of O2, N2 and Co2 species
| O2 |
- Plot for Variation in Specific Heat with Temperature range of O2
- Plot for Variation in Enthalpy with Temperature range of O2
- Plot for Variation in Entropy with Temperature range of O2
| N2 |
- Plot for Variation in Specific Heat with Temperature range of N2
- Plot for Variation in Enthalpy with Temperature range of N2
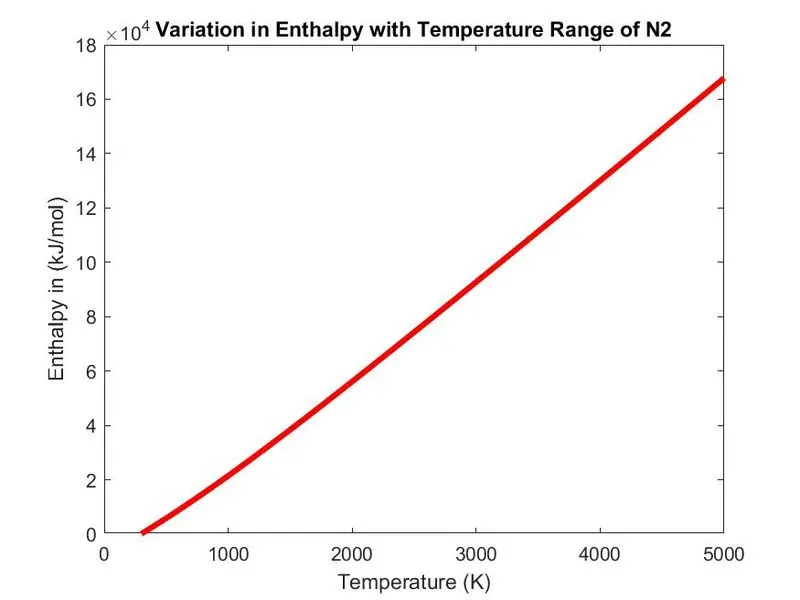
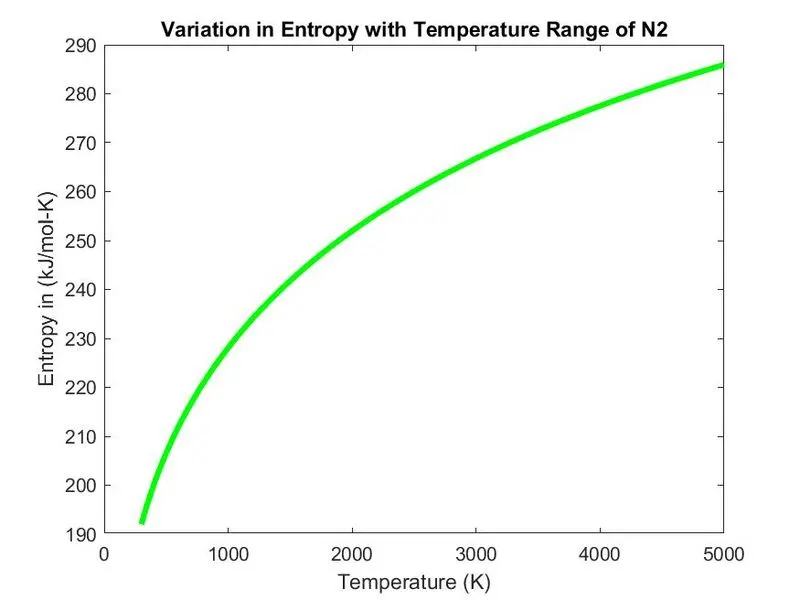
- Plot for Variation in Entropy with Temperature range of N2
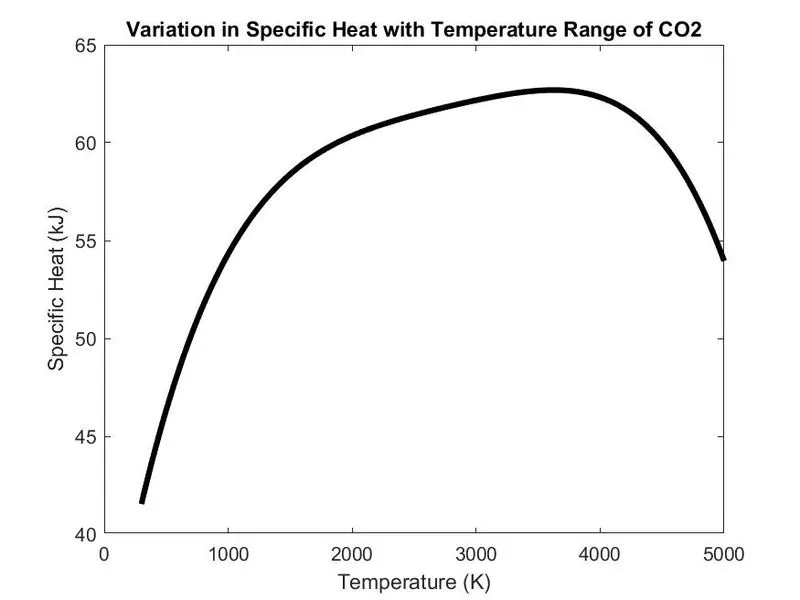
| Co2 |
- Plot for Variation in Specific Heat with Temperature range of Co2
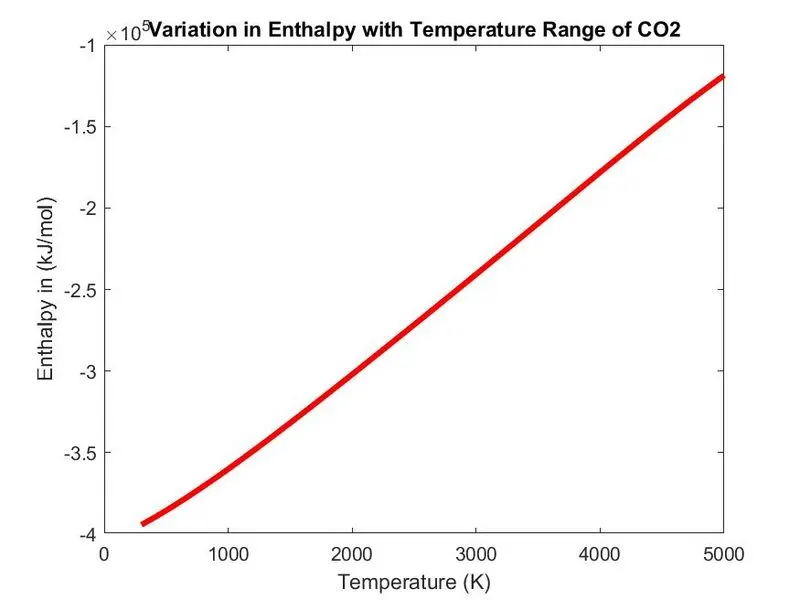
- Plot for Variation in Enthalpy with Temperature range of Co2
- Plot for Variation in Entropy with Temperature range of Co2
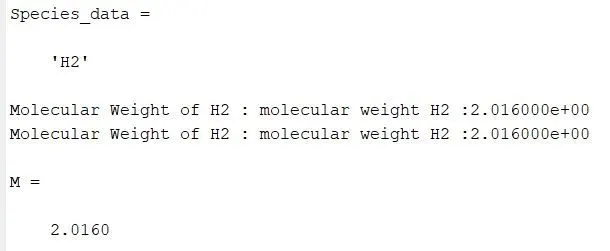
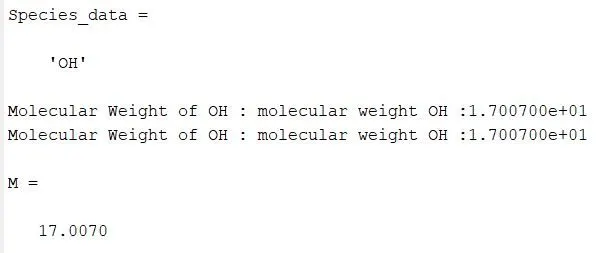
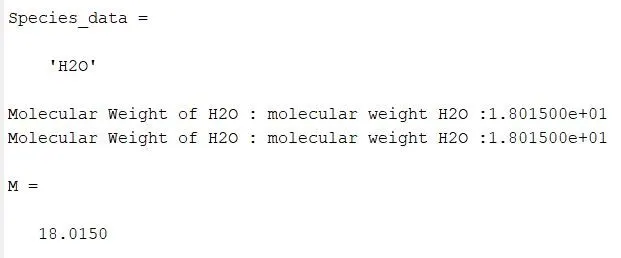
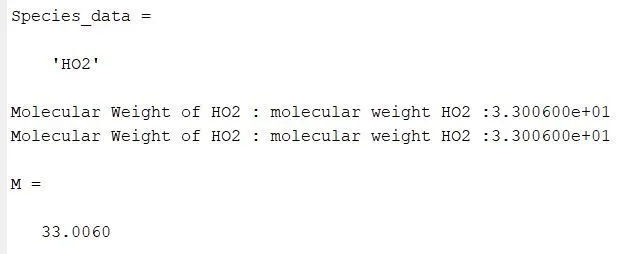
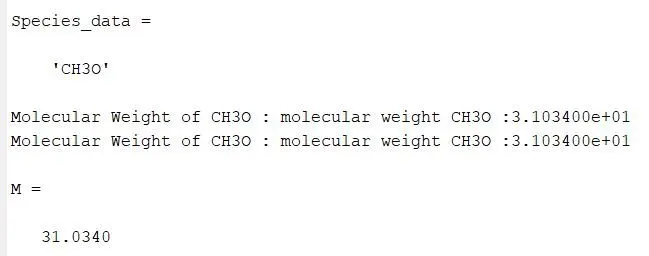
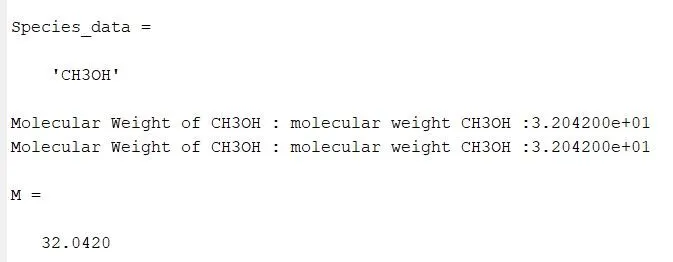
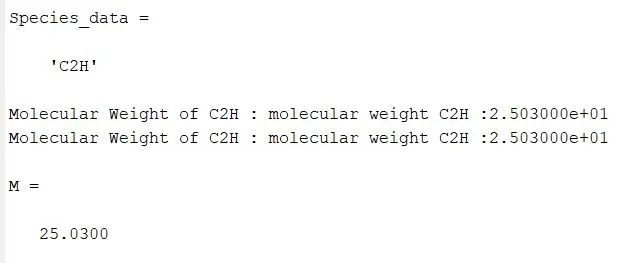
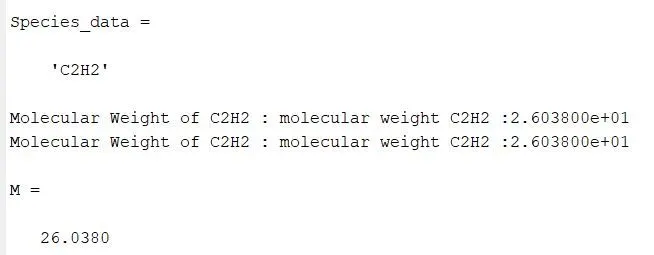
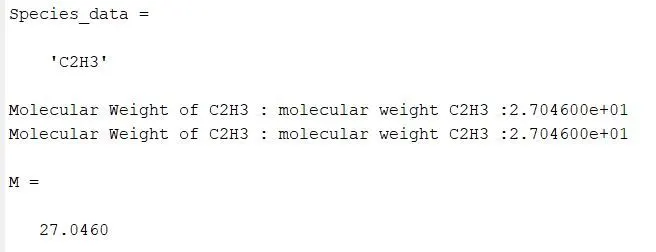
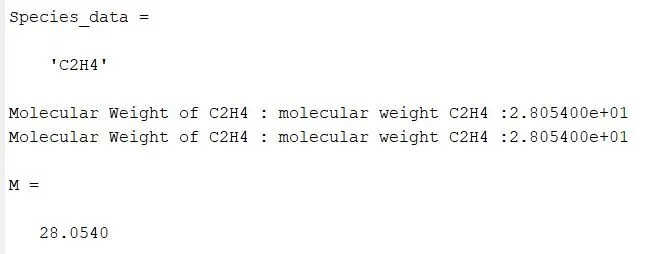
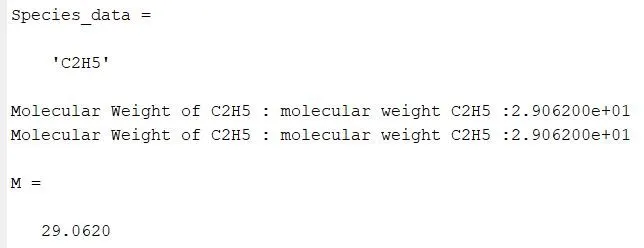
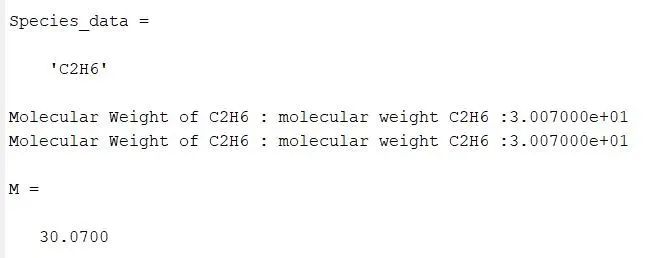
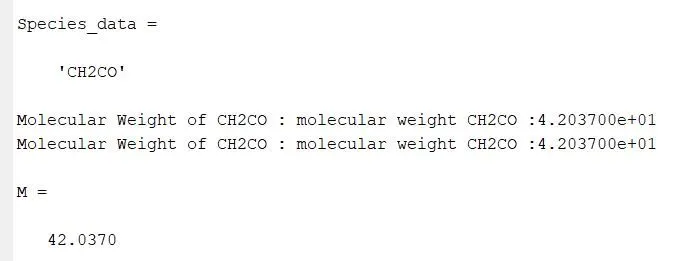
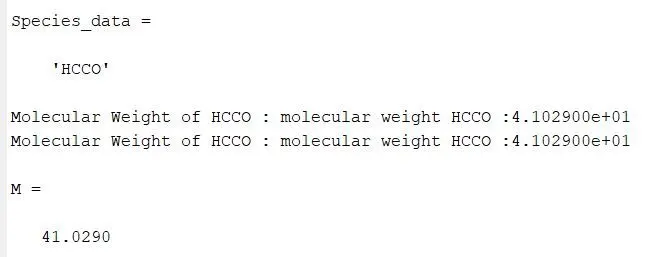
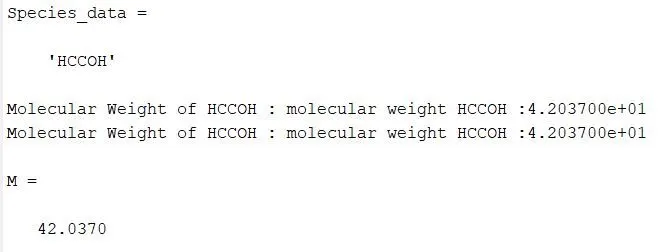
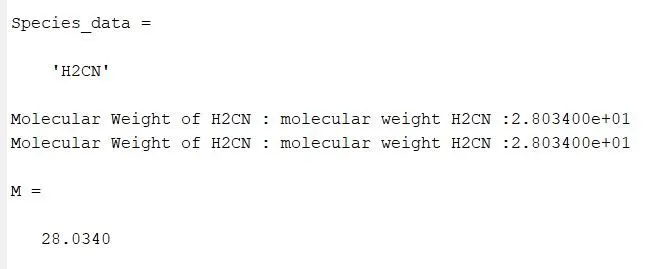
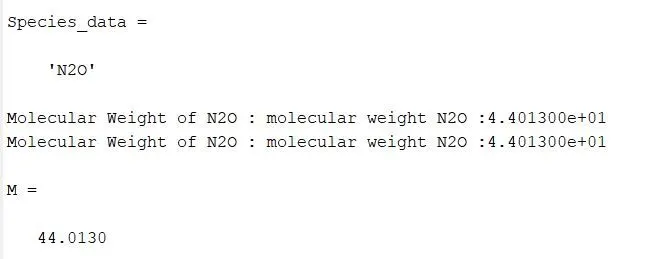
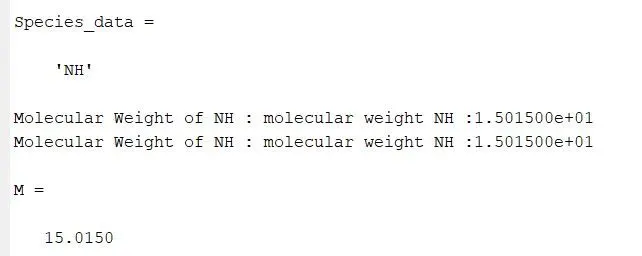
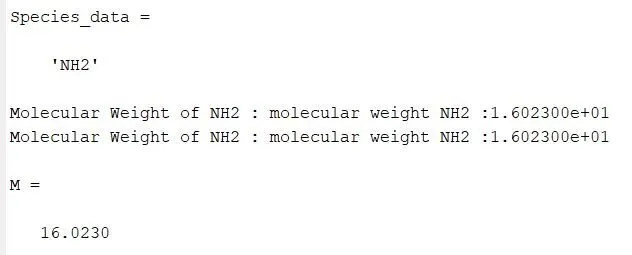
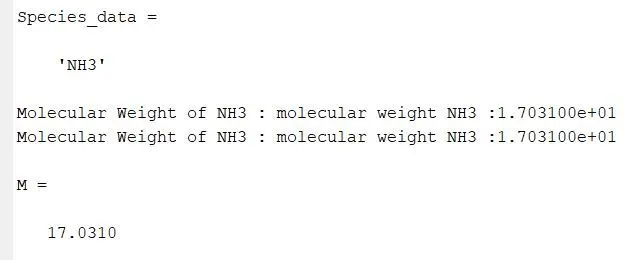
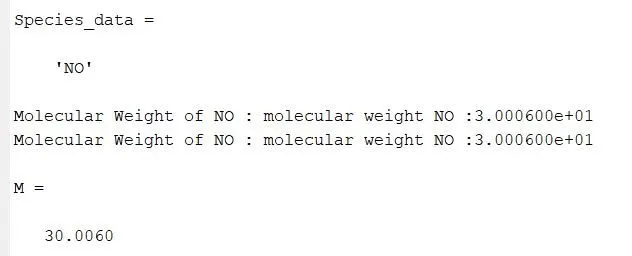
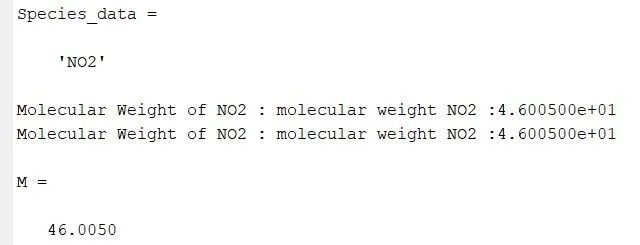
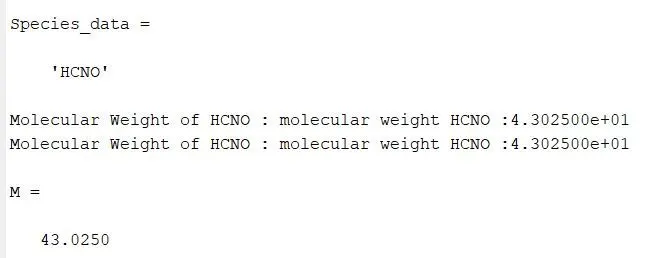
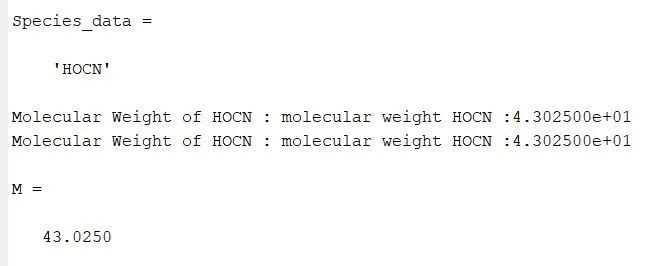
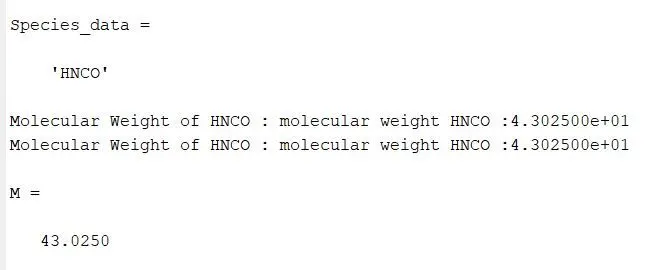
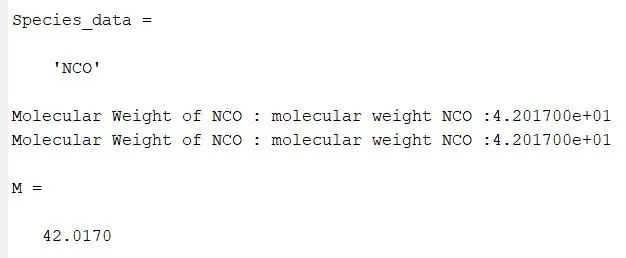
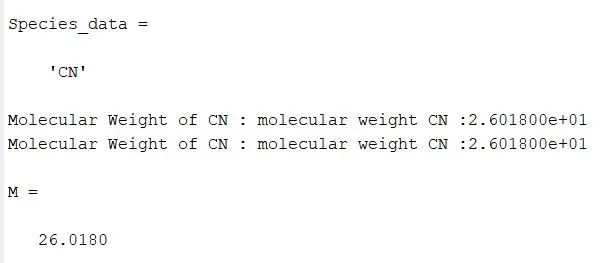
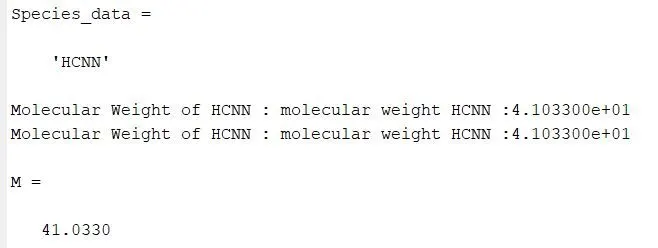
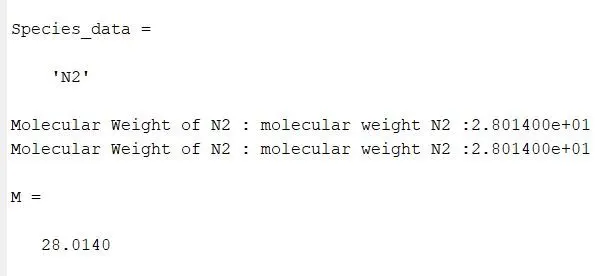
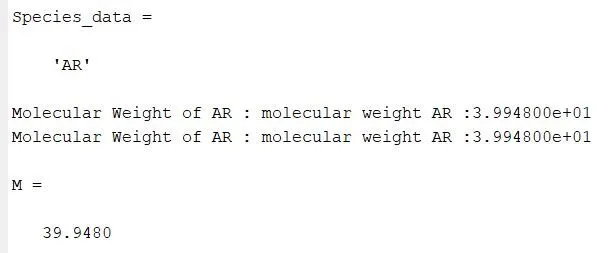
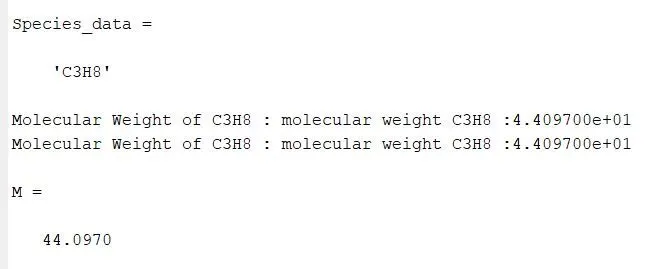
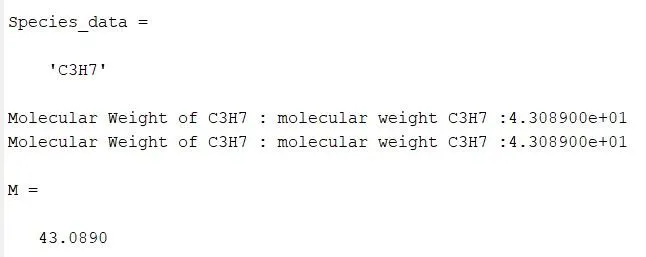
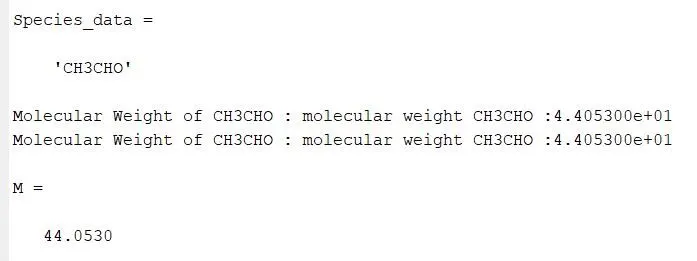
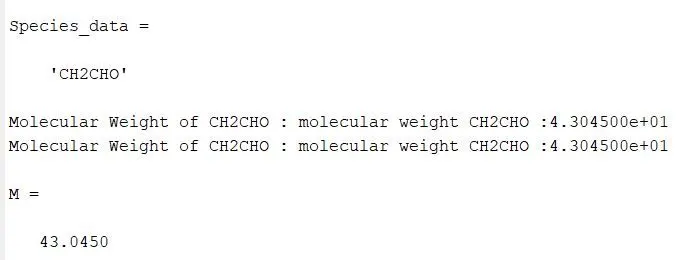
Values of Molecular Weight of all the 53 species displayed in the command window
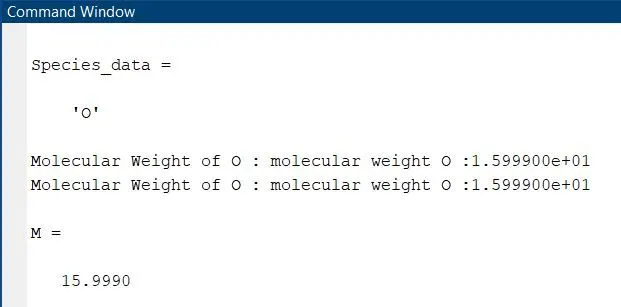
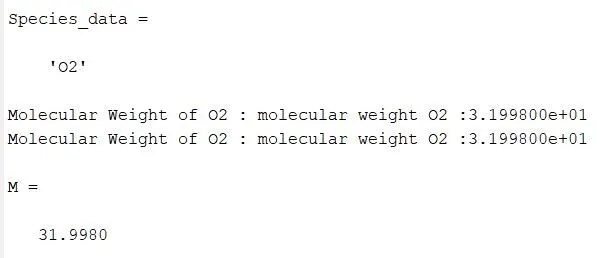
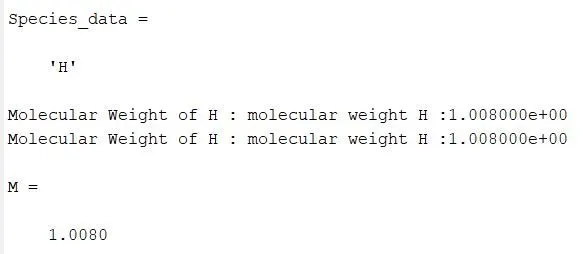
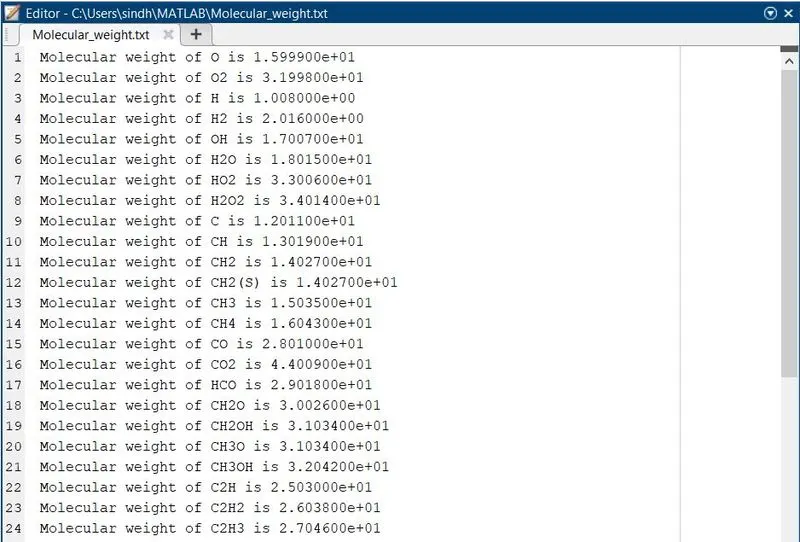
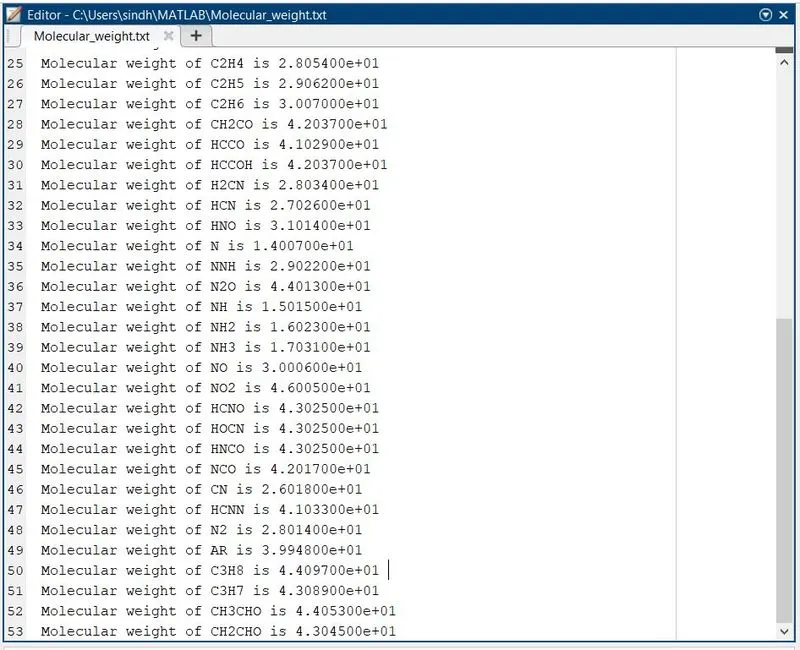
Molecular_weight.txt file
Conclusion
Hence, I have written the MATLAB program to parse the given NASA thermodynamic data file and required results have been occured.The thermodynamic properties (Specific heat, Enthalpy and Entropy) of the species have been found out and plotted with Temperature range. Molecular weight of the each and every species (53) have been displayed in the command window.
References
- https://in.mathworks.com/help/matlab/ref/fopen.html
- https://in.mathworks.com/help/matlab/ref/fgetl.html
- https://in.mathworks.com/help/matlab/ref/strsplit.html
- https://in.mathworks.com/help/matlab/ref/str2num.html#:~:text=X%20%3D%20str2num(%20chr%20)%20converts,it%20returns%20an%20empty%20matrix.
- https://in.mathworks.com/help/matlab/ref/strfind.html
- https://in.mathworks.com/help/matlab/ref/fprintf.html
- https://in.mathworks.com/help/matlab/ref/pwd.html
- https://in.mathworks.com/help/matlab/ref/mkdir.html
- https://in.mathworks.com/help/matlab/ref/sprintf.html
- https://in.mathworks.com/help/matlab/ref/saveas.html