Week 7 State of charge estimation
WEEK - 7
PART 1 :
To begin with the model we have to first under stand the various types of block mentioned in the module .
A)
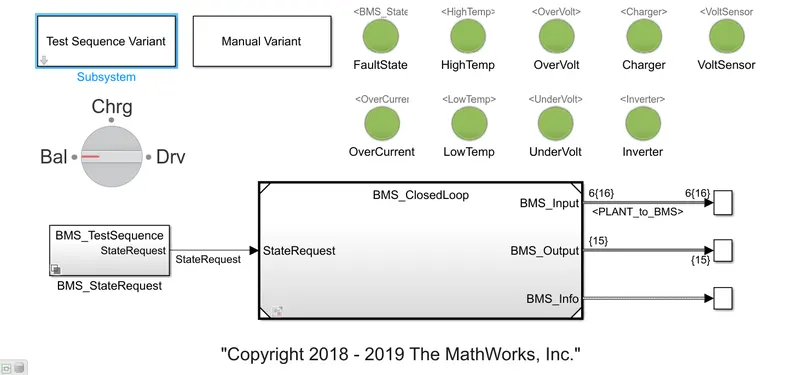
1) TEST SEQUENCE BLOCK
This block represent the test condition or mode in which this entire module has to performe the calculation on various parameters . There are 3 differnt modes
a) Driving
b) Charging
c) Balancing
2) FAULT LIGHTS
These light indicate several parameters on which the module give the repected results . If the result is withen the specified limits the light will show GREEN COLOUR otherwise they will show RED COLOUR .
3) BMS CLOSED LOOP MODULE
In this module the entire calculation are performed is considered as the main module of the entire BMS system .
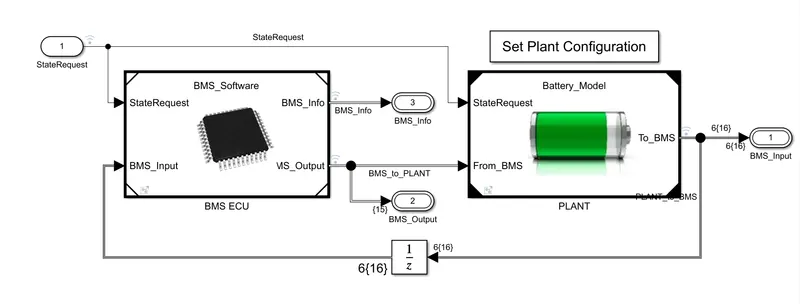
To understand this structure , first we have to understand the these 2 main sub - systems
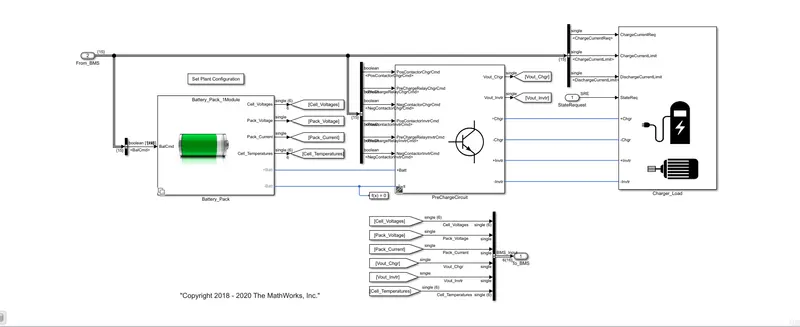
1) PLANT
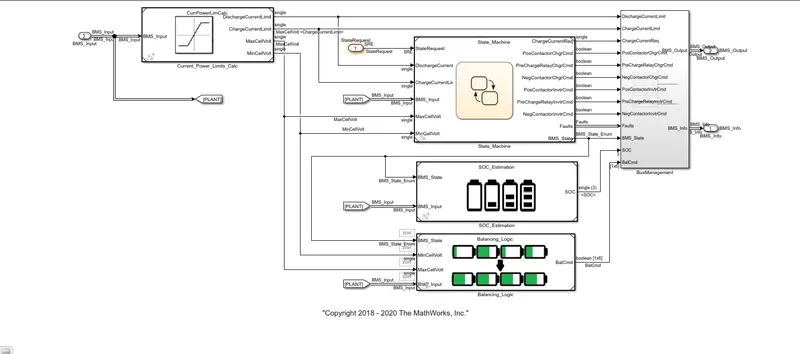
2) BMS ECU
Now here is the explanation :
Now in the Plant module 2 sub -systems are created .
a) Battery pack
b) Pre - Charge Circuit
In the battery pack module , we are choosing 6 cells module which are connected in series to each andd are responsible to charge - discharge the as per load values . The pre charge circuit is there to prevent the immidiate supply of high volatge and current from the external board to the battery so that there is no harm to the circuit .
These values comming from the PLANT module act as an input to the BMS module . The actual the current , Voltage and power calculation atre done here only . It also constantly checks and monitor these value so that if anything is out of the respected limits it can warn the system and can the the corrective action accordingly .
Now in the STATE REQUEST MODULE there modes are there on which individual resulyts have been carried out .
1) Case 1 :
When the car is doing :
a) Driving for first 3000 sec
b) Balancing from 3000 - 4000 sec
c) Charging and Balancing from 4000 - 9000 sec
d) Post charge balancing above 9000 sec .
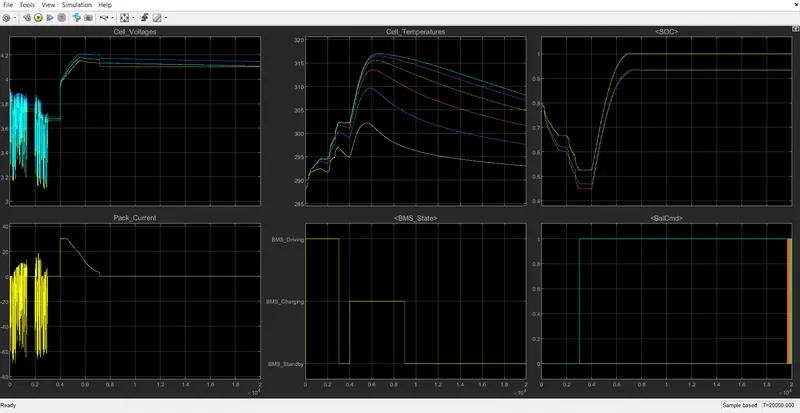
Here are the results for the same .
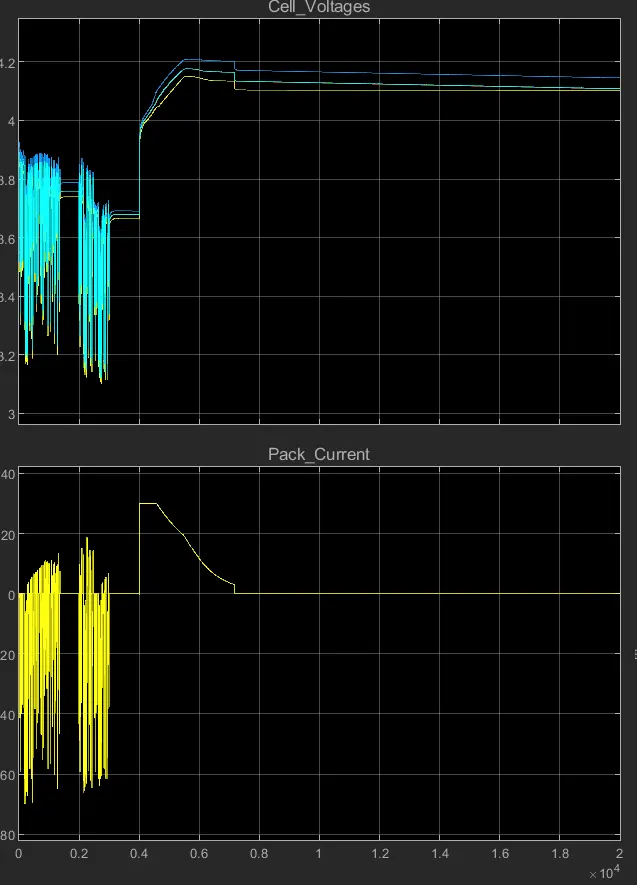
VOLTAGE :
In this for the first 3000 sec , the cell volatges are in the range of 3.9 V to 3.1 V .
3000 - 4000 sec , these volatges are are constant and has a volt of 3.7 V which clearly shows that the cells are in balancing phase .
4000 - 9000 sec , the voltage immeidiatly shoots to 4 V due to the fact that the cells are charging . The volatge further increases to 4. 2 V and after that it becomes constant as it has reached the max limit of volatge of cell during charging .
9000 sec to above , all cells are achieving there 1 single volatge which is main volt of cell 1 which is 4.1 V becuase now the cells have to be balanced acrroding to new charghed voltage which is high .
PACK CURRENT :
In this for the first 3000 sec , the pack current are in the range of 19 A to -70 A due to more discharging .
3000 - 4000 sec , these pack current are constant and has a O A current drawin as the car has been stopped which clearly shows that the cells are in balancing phase .
4000 - 9000 sec , the pack current immeidiatly shoots to 30 A due to the fact that the cells are charging . The pack current reduces gradually to 0 A .
9000 sec to above , all cells are achieving all cells are having 0 A because car is stopped .
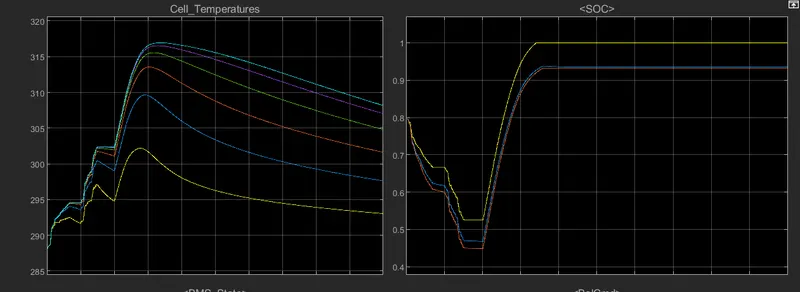
CELL TEMPERATURES :
For first 3000 sec , the cell temp is rasiing from 288K to 302 K .
3000 - 4000 sec , the cell temp reduces or remains low due to the balanacing phase .
4000 - 9000 sec , The temp rise exponentially due to fact the charging occures but due to fact the there is no loss of current the temp also reduces drastically .
9000 sec and above , we observe that constant reduction in temp but this temp is usually high than normal because continuous chagrging is taking place .
Here one thing has to observed that that cell 1 has lowest temp and cell 6 has highest throughout the graph .This is because the heat transfer from cell 1 is very good as it is located with good ambient location but cell 6 is at the back side of battery pack where there is very less gheat tranfer rate .
SOC :
For first 3000 sec , the SOC decreases from 80 % to 45% .
3000 - 4000 sec , the SOC remains constant due to balancing phase .
4000 - 7000 sec , the SOC achivies its max limit that means it is fast charging .
7000 sec and above , it remains constant .
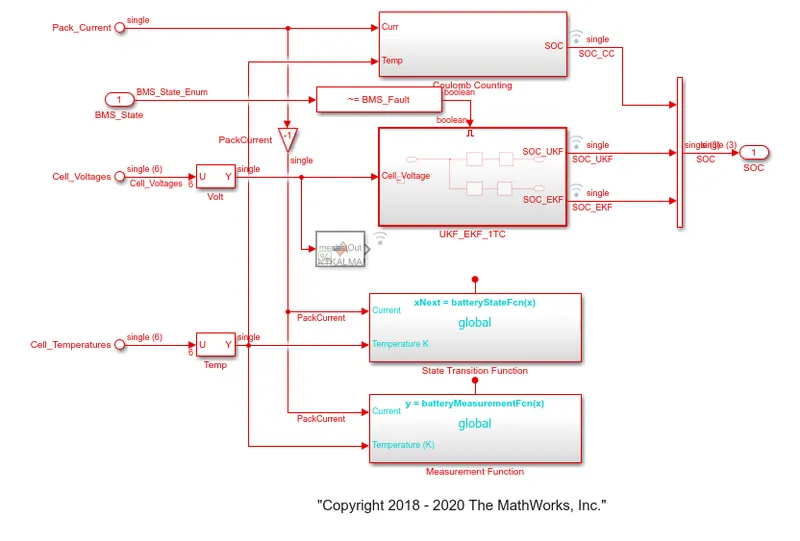
Now here the yellow line represents that SOC calculation has been performed with the help of COULOMB COUNTING METHOD which will be later discussed in detail .
CASE 2 :
When the car is doing :
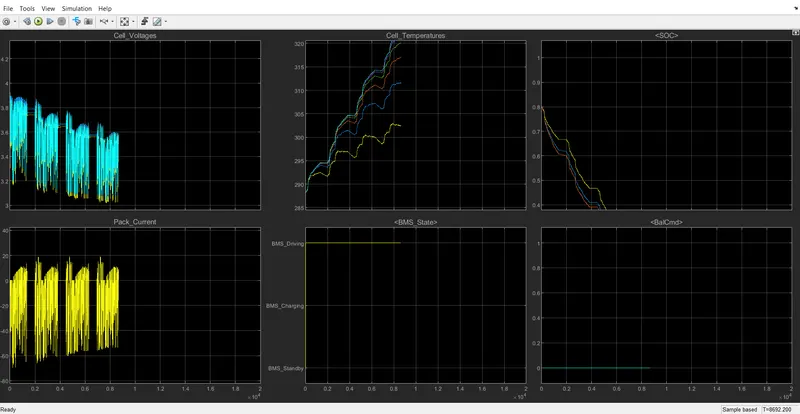
a) Driving for first 10000 sec .
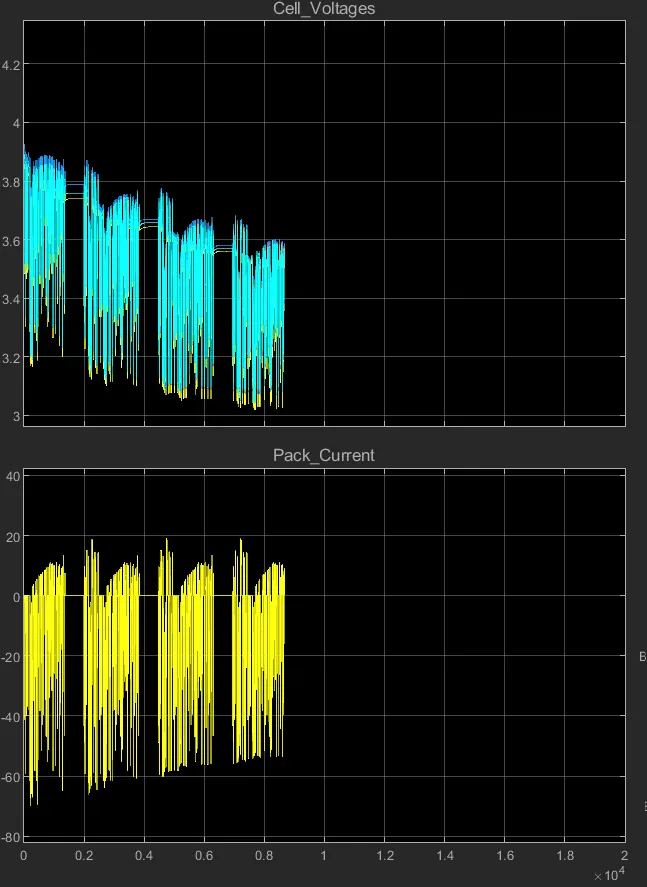
VOLTAGE :
In this for the first 9000 sec , the cell volatges are in the range of 3.9 V to 3.1 V which is constantly decreasing .
9000 sec to above , the battery has been discharged completly .
PACK CURRENT :
In this for the first 9000 sec , the pack current are in the range of 19 A to -70 A due to more discharging .
9000 sec to above , there is no flow of current but we can see there is little bit of charging due to reverse charging concept .
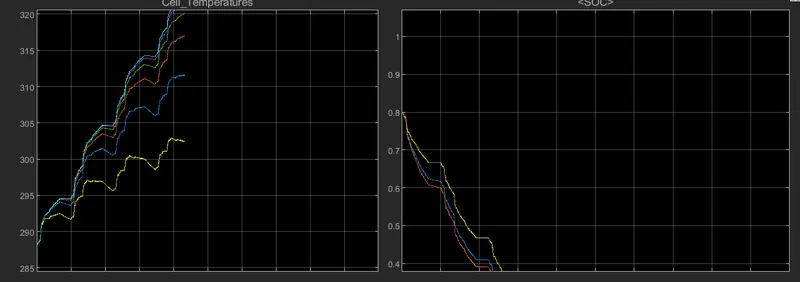
CELL TEMPERATURES :
For first 9000 sec , the cell temp is rasiing from 288K to 322 K at a constant rate
Here one thing has to observed that that cell 1 has lowest temp and cell 6 has highest throughout the graph .This is because the heat transfer from cell 1 is very good as it is located with good ambient location but cell 6 is at the back side of battery pack where there is very less gheat tranfer rate .
SOC :
For first 9000 sec , the SOC decreases from 80 % to 0 % .
Now here the yellow line represents that SOC calculation has been performed with the help of COULOMB COUNTING METHOD which will be later discussed in detail .
CASE - 3 :
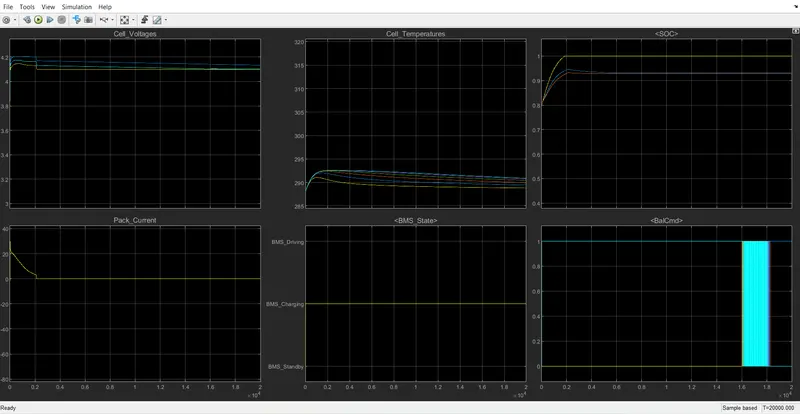
a) Charging for 20000 sec .
VOLTAGE :
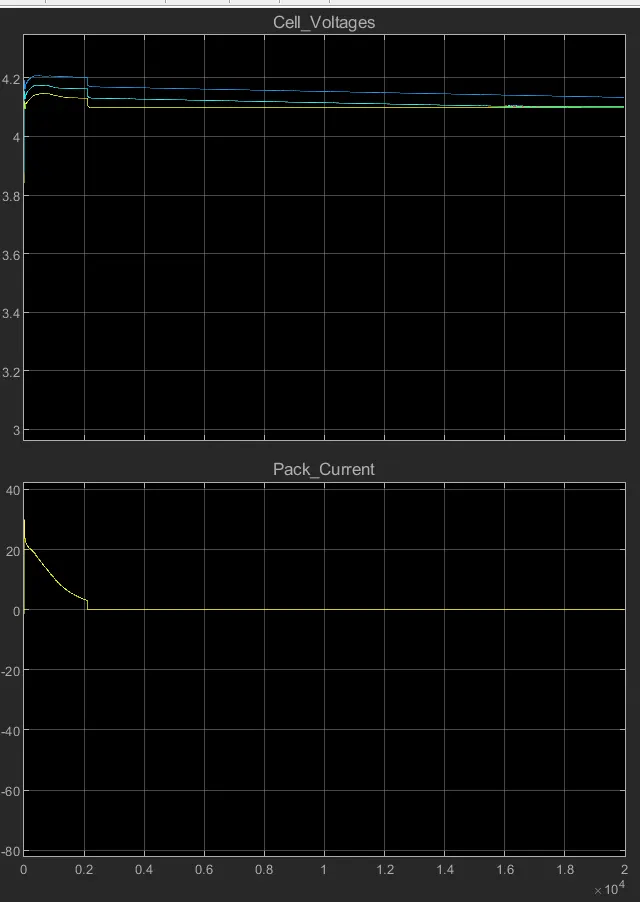
Throughout the time , the voltage has its normal value that is 4.1 V .
CURRENT :
Throughout the time , the current has its normal value that is 0 A but it was increased to around to 30 A when charging started .
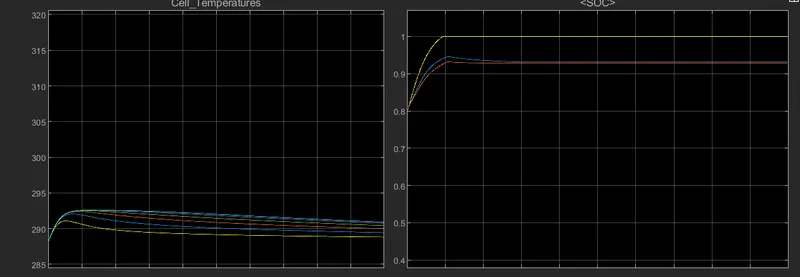
TEMPERATURES AND SOC
There is constant value of cell temp completly as well SOC was also increaes from 80% to 100%
PART - 2 :
CONCEPT OF COULOMB COUNTING :
SOC also know as State Of CHARGE is defined as the ratio of available capcilty to the maximum capacity . It is describes as the present battery capacity in percentage .
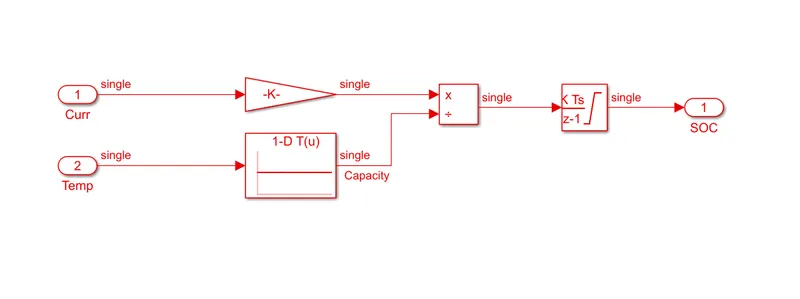
The Coulomb counting method measures the discharging current of a battery and integrates the discharging current over time in order to estimate SOC . Coulomb counting method is done to estimate the , which is estimated from the discharging current, , and previously estimated SOC values, . SOC is calculated by the following equation:
SOC(t) = SOC( t-1) + (I(t) x delta(t)) / q
But there are several factors that affect the accuracy of Coulomb counting method including temperature, battery history, discharge current, and cycle life .
MODIFIED COULOMB COUNTING To improve the Coulomb counting method, a new technique called modified Coulomb counting method is proposed. The modified Coulomb counting method uses the corrected current to improve the accuracy of estimation.
The corrected current is the function of discharging current. There is a quadratic relationship between the corrected current and discharging current of battery. By practice of experimental data, corrected current is calculated by the following form:where , and are constant values obtained from the practice experimental data.
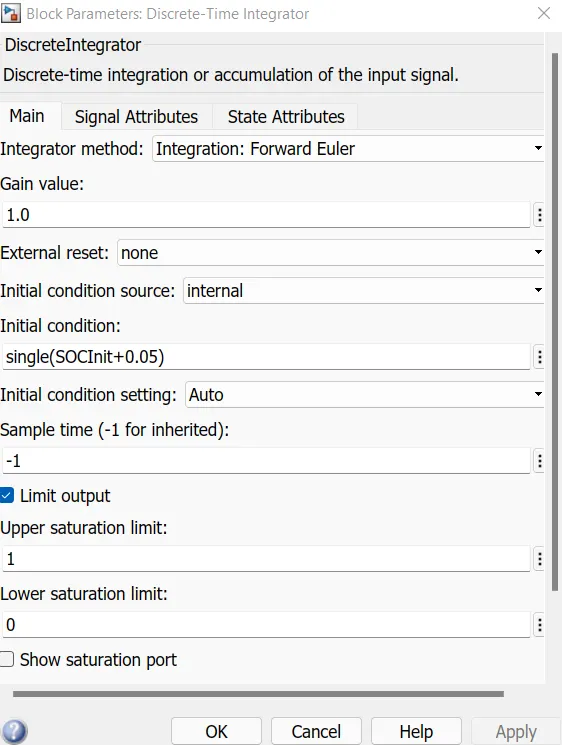
This is used in this model in this way as mentioned :