Week 7 State of charge estimation
1) To Simulate the 3 test cases :
Model of BMS Closed Loop Harness Dashboard -
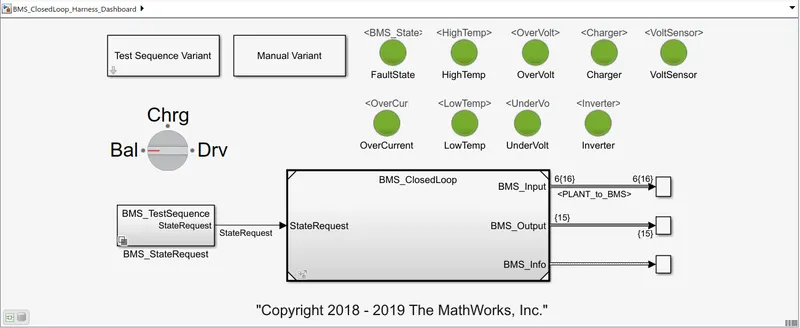
The above model shows the dashboard of a vehicle . This model is designed to indicate the status of the battery in three situations ,
- Balancing
- Charging
- Driving
There are LEDs which indicate the following status ,
- Fault State
- High Temperature
- Over Voltage
- Charger
- Voltage Sensor
- OverCurrent
- Low Temperature
- Under Voltage
- Inverter
There are main three blocks ,
- BMS_TestSequence StateRequest which gives input the BMS Closed Loop to test accordingly as demanded .
- BMS ClosedLoop consite of two blocks , BMS ECU and PLANT .
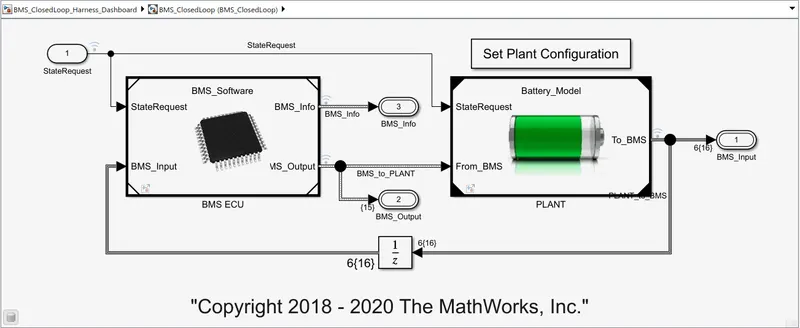
In BMS ECU controls the flow of current and PLANT unit represents the battery pack .
TESTS -
There is test block named Test Sequence Variant in the model as we can see in the figure 1 .
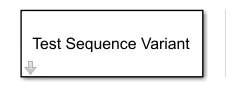
If we click on this block , a dialogue box will appear . This dialogue box gives the options to select the cases of test we want .
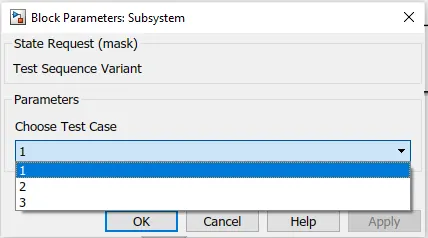
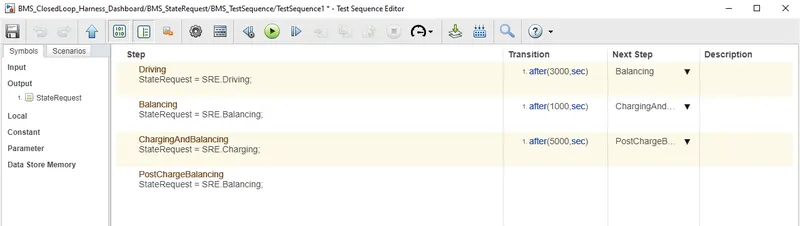
Case 1 represents the Test 1 during Driving , Balancing , Charging-Balancing condition .
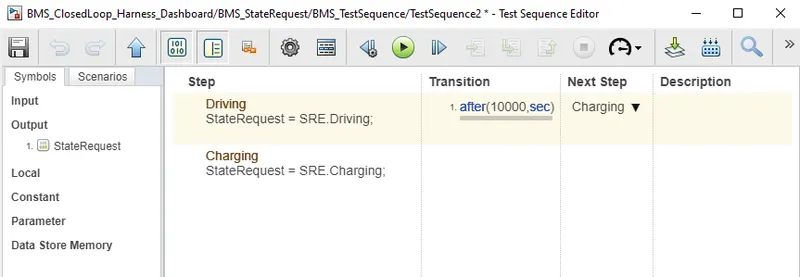
Case 2 represents the Test 2 during Driving-Charging condition .
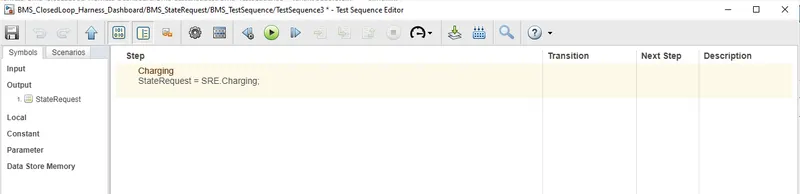
Case 3 represents the Test 3 during Charging condition only .
Case 1 - In this case we will observe the Driving , Balancing and Charging-Balancing test . The sequence of test is ,
- Driving for first 3000 sec .
- Balancing for next 1000 sec .
- Charging and Balancing for next 5000 sec .
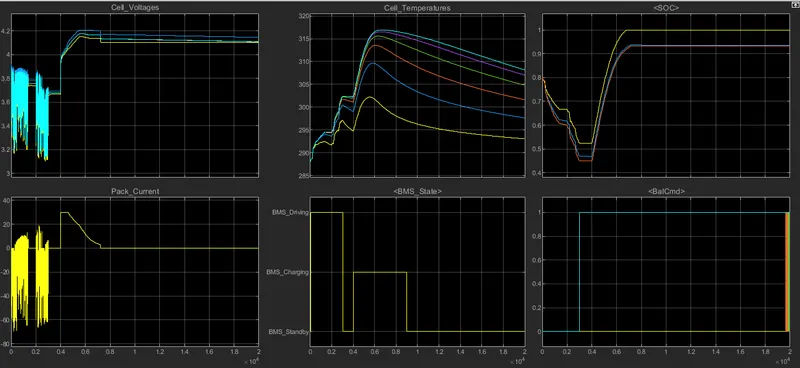
After conducting Test 1 , there we no red lights in the LEDs . This means that no faults occured during the test .
The above figure shows the result of test 1 . We observe that ,
- Cell_Voltages
Voltage varies from 3.1V to 3.4V in first 3000 sec . After 3000 sec cell balancing occurs upto 4000 sec and voltage reaches upto 3.7V . After 4000 sec , voltage rises to 4.2V for few seconds and then falls to 4.1V and remains constant at 4.1V for rest of the time . This is charging-balancing mode .
- Pack_Current
During the period from 0 to 4000 sec we can see the variation in the current . The current rises upto 10A and falls upto -60A . At 4000 sec current rises upto 30A and slowly falls to 2.6A in next 3000 sec and remains constant for rest of the time .
- Cell_Tempreture
The tempreture of cell 1 is lesser that cell 6 . At first 3000 sec the tempreture of cells increase gradually . In between 3000 sec to 4000 sec the tempreture decreases as this is standby mode . After 4000 sec cell tempreture increases exponentially and starts reduces as the current reduces at constant voltage .
- BMS_State
For first 3000 sec the battery is in driving mode . After 3000 sec to 4000 sec the standby mode is engaged . After 4000 sec charging mode is engaged upto 9000 sec . After 9000 sec post charge balancing mode is engaged .
- SOC
Initially the battery mode is 80% . This SOC falls upto 30% for cell 6 during first 3000 sec . In between 3000 sec to 4000 sec the SOC of all cells remains constant . As the charging mode is engaged after 4000 sec , the SOC rises upto 100% for cell 1 and is near 100% for other cells and then remains constant for rest of the time .
- BalCmd
For first 3000 sec no cell balancing was done . During in interval of 3000 sec to 4000 sec cell balancing starts for cell 6 and cell 2 since their voltage is higher than other voltages of other cell . At the end all the cells tries to balance themselves .
Case 2 -
When the model is simulated no red lights appeared on LEDs . This means no fault occured . The result of the test is shown below ,
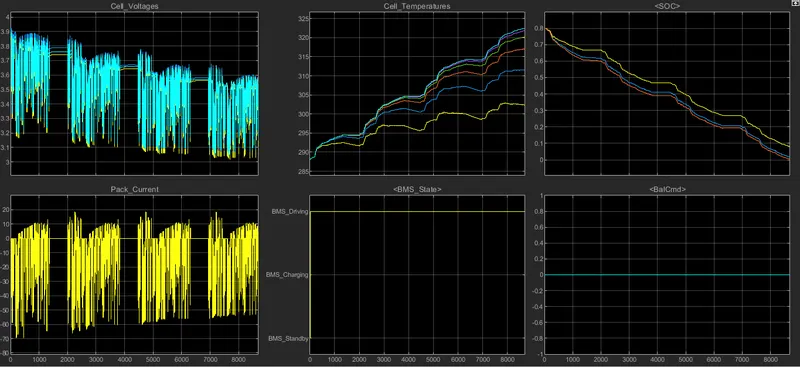
We observe that ,
- Cell_Voltages
Cell Voltages varies from maximum 3.9V and reduces to 3.0V as cutoff voltage upto 9000 sec . Entire capacity drains at 9000 sec .
- Pack_Current
Pack Current discharges upto 70A . Slight charging occurs during the overall drive due to stand-by mode in between the operations .
- Cell_Tempreture
Here temprature of cell 1 is having less variation from 288K to 302K . And cell 6 is having high variation upto 322K . Cell temprature reduces in between the operation due to stand-by mode .
- BMS_State
- SOC
The SOC reduces from 80% to 0% as current drained for longer period . Somewhere it remains constant due to stand-by mode but for very very small duration .
- BalCmd
As it is clear from above plot that cell balancing is not performed throught the whole operation .
Case 3 -
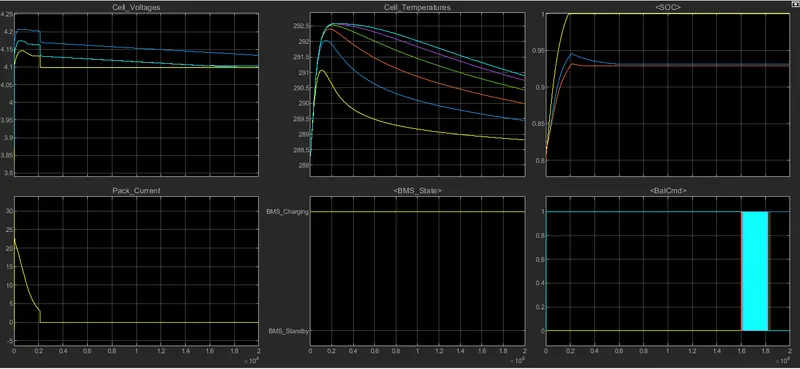
We observe that ,
- Cell_Voltages
For cell 2 voltage rises from 3.9V to 4.2V and then slightly reduces to 4.1V . For cell 1 voltage rises to 4.1V and then slightly reduces to 4.0V .
- Pack_Current
The battery current firstly rises from 0A to 30A and then gradually reduces to 2.5A in 2000 sec and remains constant through out the whole operation .
- Cell_Tempreture
The cell temprature continues to increase upto full charge at 2000 sec and then starts reducing after 2000 sec .
- BMS_State
As shown in figure entire operation is at charging mode .
- SOC
The cells gets charged fully at 100% in 2000 sec and remains at full charge for rest of the sequence .
- BalCmd
Cell 2 and Cell 6 starts balancing with respect to cell 1 . Other cells tries to balance at end of simulation .
2) Coulomb Counting :
Coulomb counting is the method used to measure the discharging current of the battery . This method integrates the discharging current over time to give SOC of battery . The formula for calculating SOC by coloumbs method is ,
SOC(t) = SOC(1-t) + (I(t)/Qn) * dt
where I(t) is discharge current and Qn is capacity .
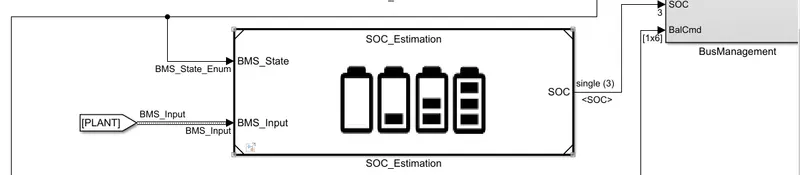
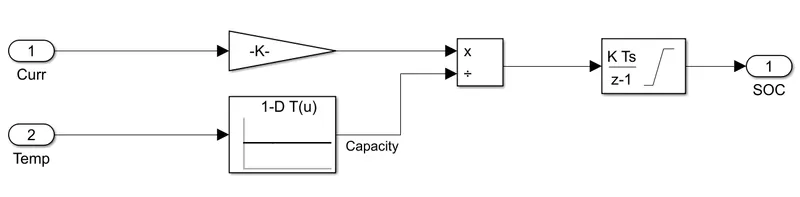
The Coloumb Counting block is in SOC_Estimation block .
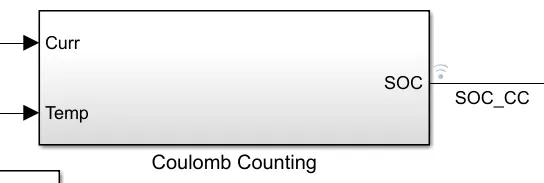
Discharge Current and temperature from battery is given as input to this block . Discharge Current signal is given to gain block to convert it into A-hr . Temperature is given to lookup table block which is consider as capacity of the battery . Current divided by capacity is integrated with respect to time to give SOC estimation as shown in figure below .
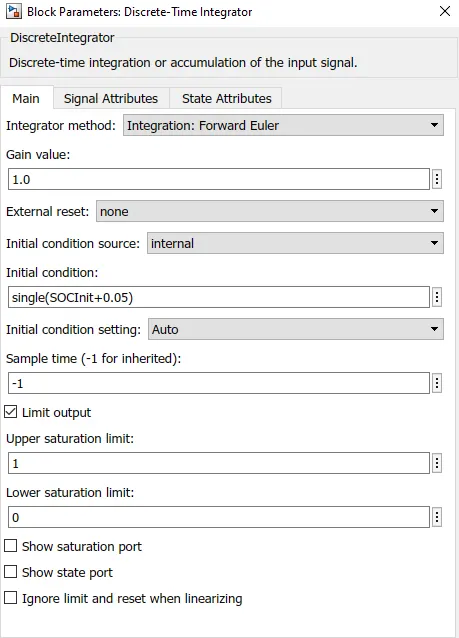
The saturation limits are 0 and 1 . This means the value of SOC will be between 0 and 1 multiplied by 100 to value in percentage .
So this is how coloumbs counting method helps in estimating the SOC .