Week 7 State of charge estimation
AIM: Simulate the 3 test cases from harness dashboard and write a detailed report on the results.
Battery Management System: A Battery management system (BMS) is any electronic system that manages Rechargable batteries, such as by protecting the battery from operating outside its safe operating Zone, monitoring its state, calculating secondary data, reporting that data, controlling its environment. A Battery pack built together with a battery management system with an external communication Data bus is a smart battery pack.
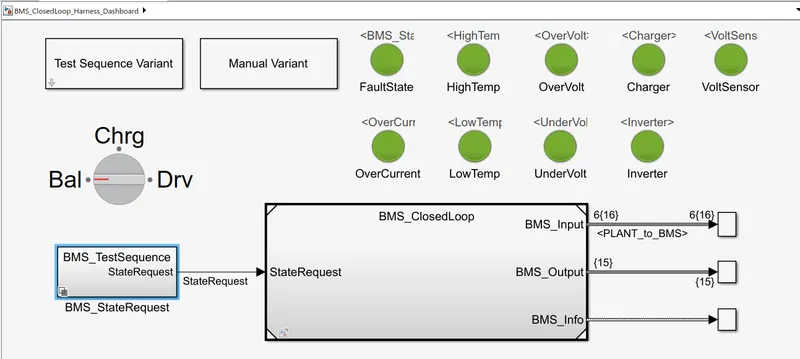
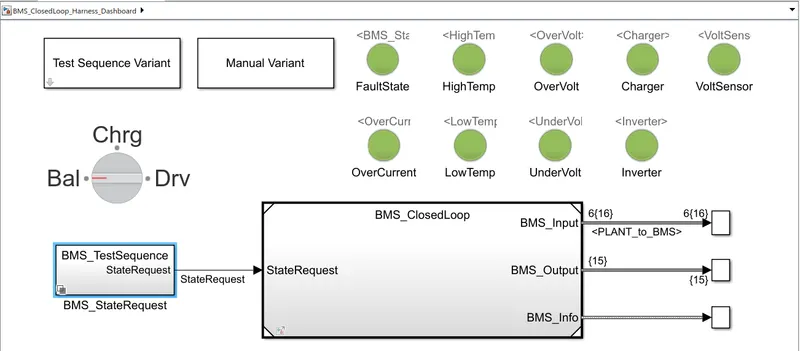
This is the dashboard which represents the dashboard in the vehicle. It indicates the battery states - Balancing, Charging and Driving. There are LEDs to indicate any faults or errors and for other purposes.
Procedure of Opening:
- In file exchange open the document of 'Design and Test Li-ion Battery Management Algorithm'.
- Download the Zip file and extract to a folder. The folder consist of these files as shown below.
- Open Matlab software and open the simulink model file of Closed loop BMS harness dashboard in Tests-System-BMS_Closedloop_Harness_Dashboard model file.
- Then give open project and model in pop-up dialog box to install all the model related library files into the current folders and workspace.
- Run this model with default running time (20,000 sec) with different Test sequence varient.
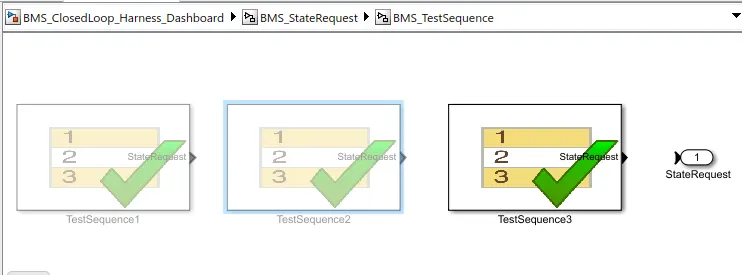
- There are 3 test cases or sequences. Each sequence is with a different algorithm.
- Test case 1 is Driving-Balancing-Charging-Balancing.
- Test case 2 is Driving-Charging.
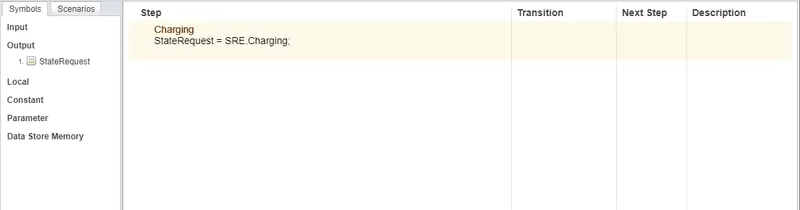
- Test case 3 is Charging only.
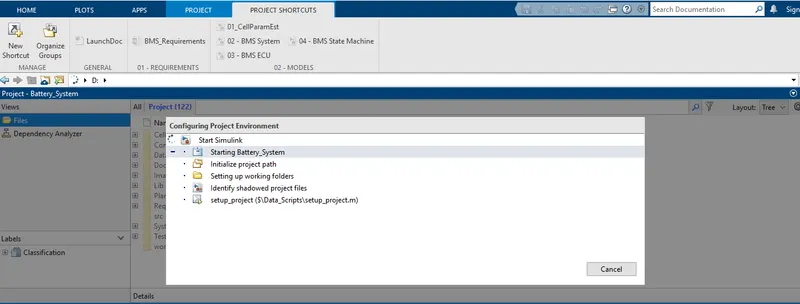
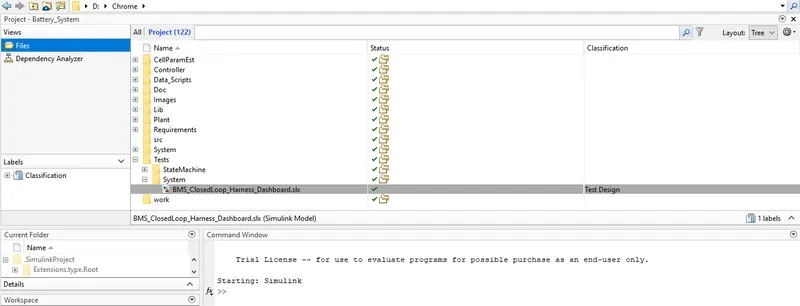
Matlab Model:
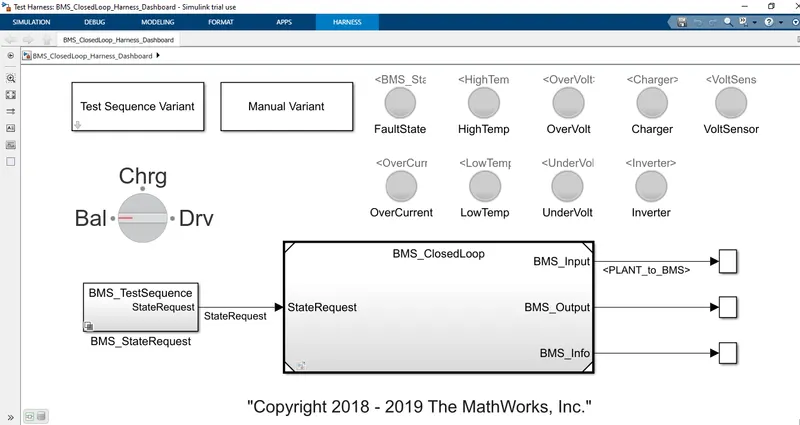
Blocks used in model:
Dash board:
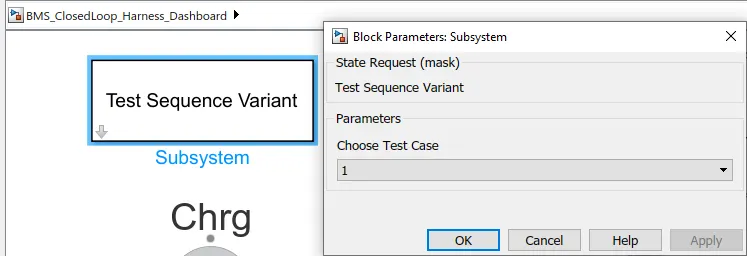
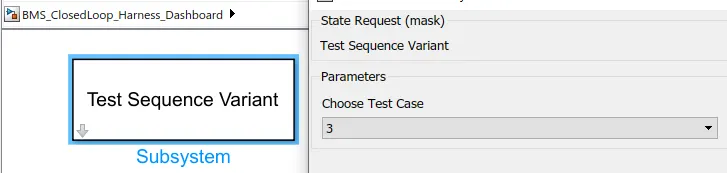
- Test Sequence Varient (Selector).
- Manual Varient (Selector).
- BMS_Testsequence state request (Subsystem) to provide state request commands.
- Lamps to indicate Fault state,High temperature, Over voltage, Over current, charging, voltage sensor operation, inverter operation, low temperature, Under voltage. If any fualt in these red indication will intimate.
- All in good conditions indicated by green indication.
- Rotating switch for manual Varient changes while running simulation.
- In scope results the SOC of module,Module current,Individual cell voltages,Individual cell temperature,Battery state,Cell balancing states are seen as outputs.
BMS_Closed loop:
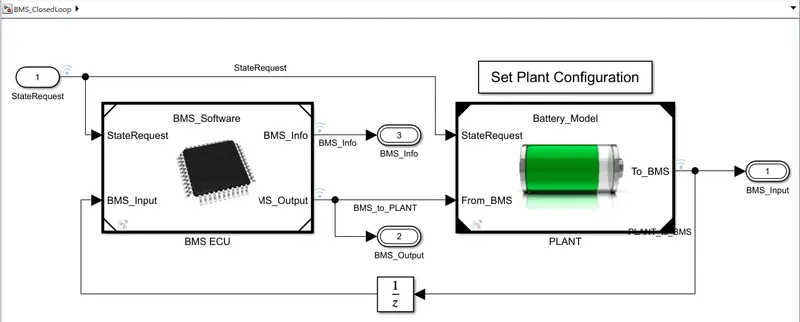
- In this main block consist of two subsystems, BMS ECU and PLANT units.
- The plant output from plant unit given as input to BMS ECU as BMS_input feedback loop.
- The state request is given to BMS ECU unit.
- The BMS Output commands given as input to plant unit as 'From_BMS'. Also the state request is given to Plant unit.
- The final outputs from closed loop model are BMS_input, BMS_Output, BMs_info.
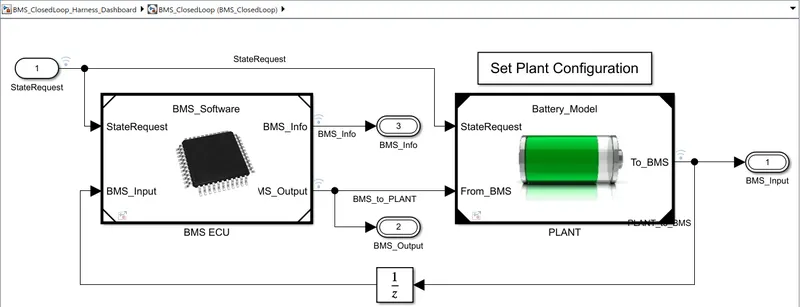
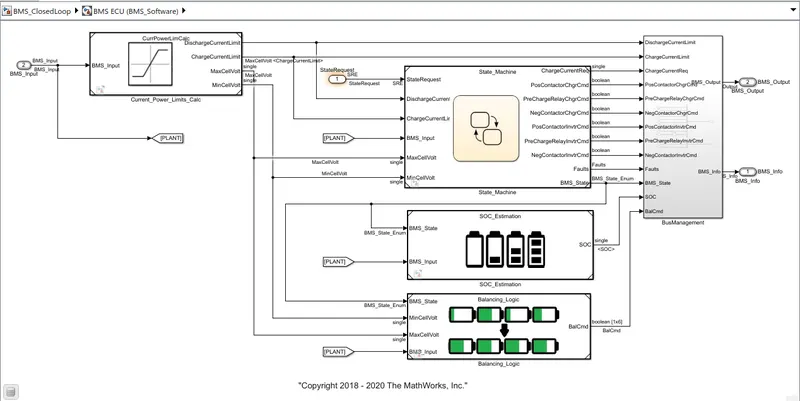
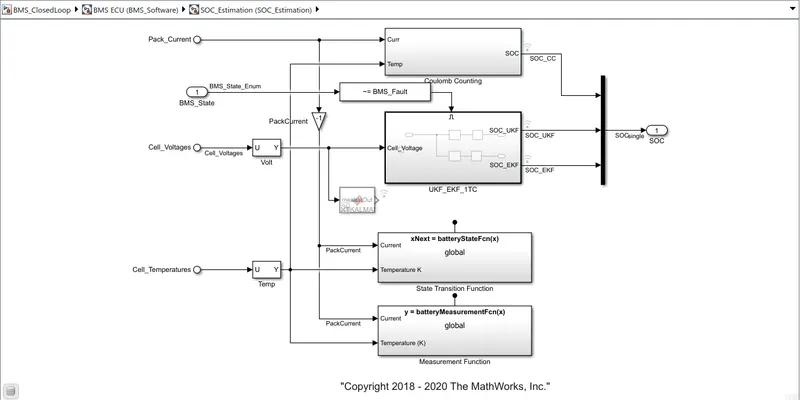
In BMS ECU unit, the current power limit calculations are done used in State machine block,Soc Estimations,Cell balancing logics as shown below,
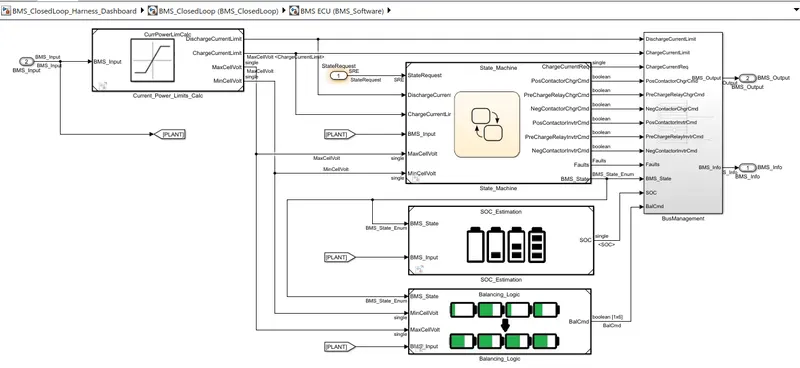
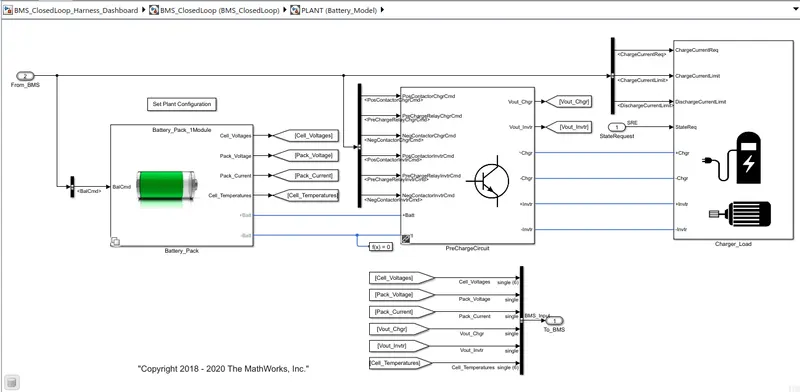
- In Plant unit,the battery pack unit,Pre charge unit,charger/load units are created.
- In battery packs there are two types of configurations as 1 module(6 cells) and 16 modules(96 cells).
- Here we are chossing 1 module for lesser simulation running time.
- Test case 1 is Driving-Balancing-Charging-Balancing.
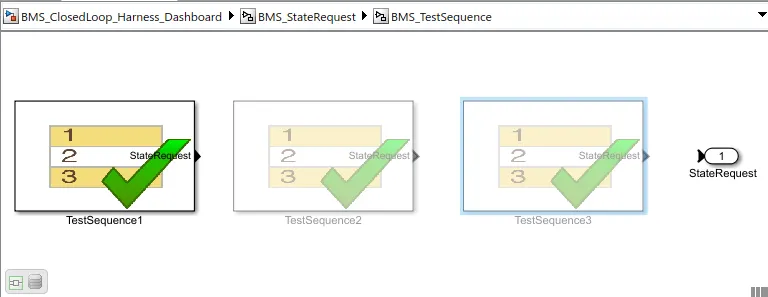
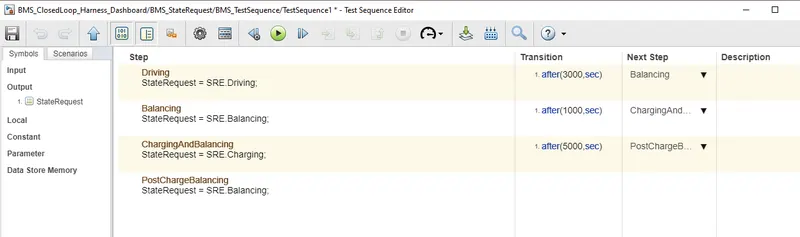
Here from the above test sequence editor figure it was set as,
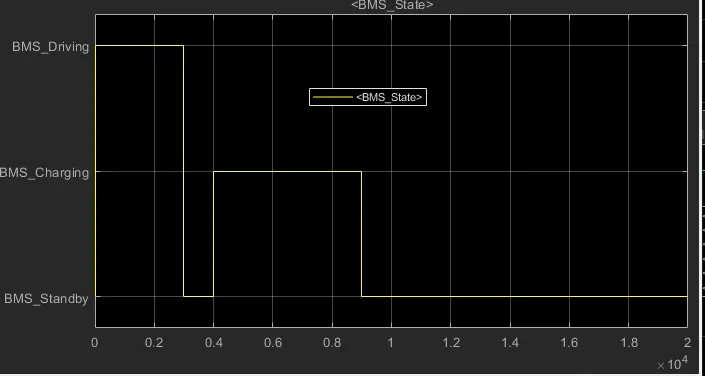
- Driving for first 3000 secs.
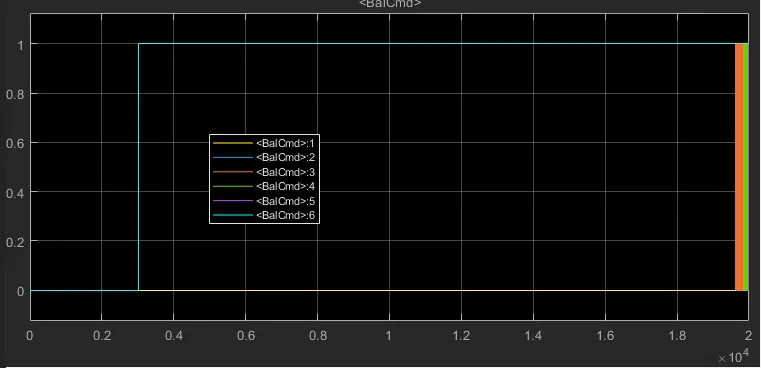
- After 3000sec starts balancing operations occure for next 1000 Secs.
- Then charging and balancing occurs for next 5000 secs.
- After that sequences post charge balancing operation occurs till end of the simulation period.
Results/Plot:
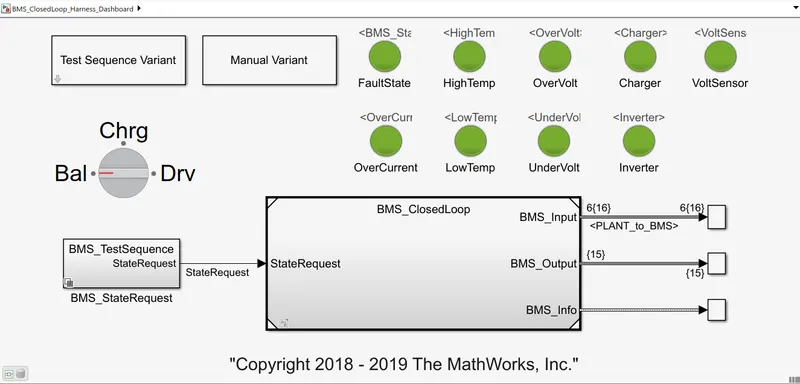
The lamp indications are showing green for overall simulation period showing that there are no faults occurs during the sequences.
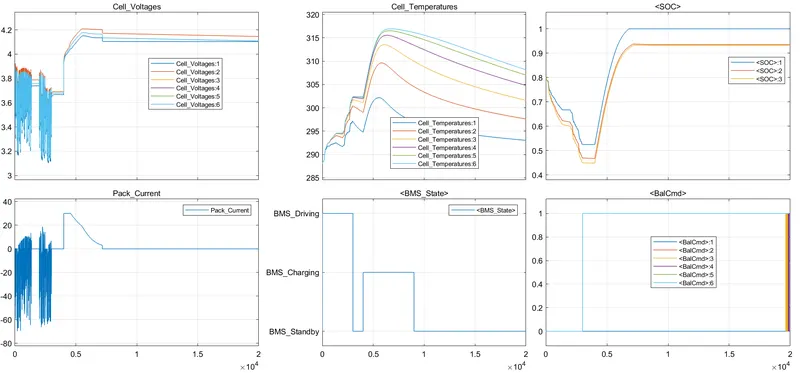
From the results we can understand that,
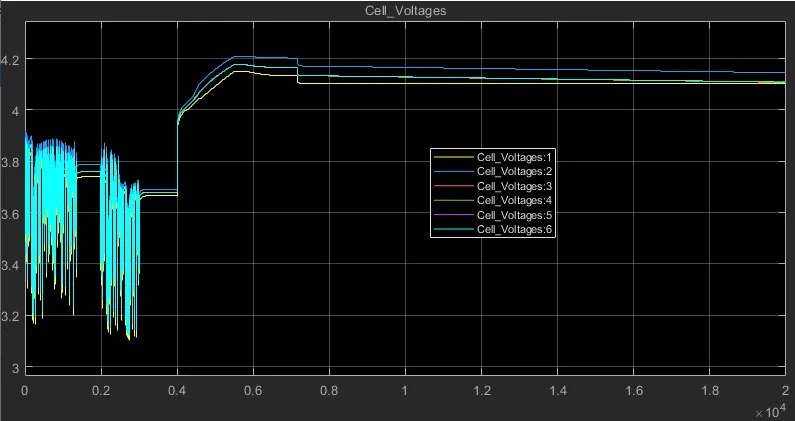
Cell Voltages and Pack Current:
|
 |
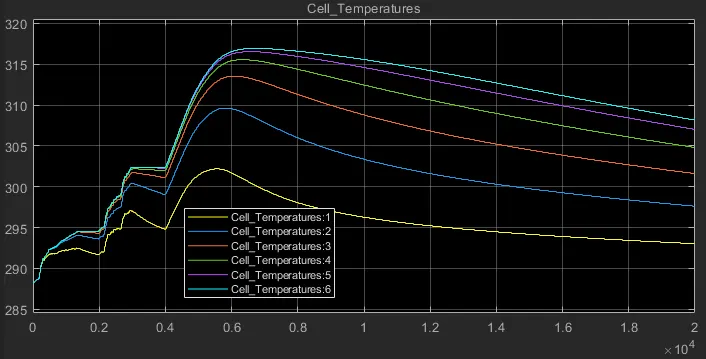
Cell temperatures:
|
 |
BMS State:
|
 |
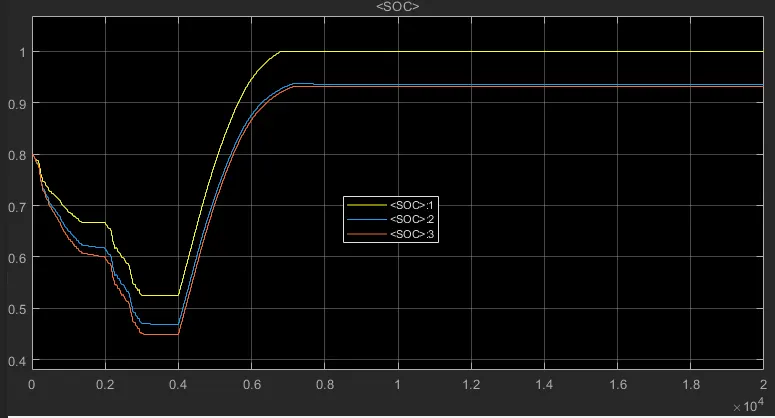
SOC:
|
 |
Balanceing cells:
|
 |
- Test case 2 is Driving-Charging.
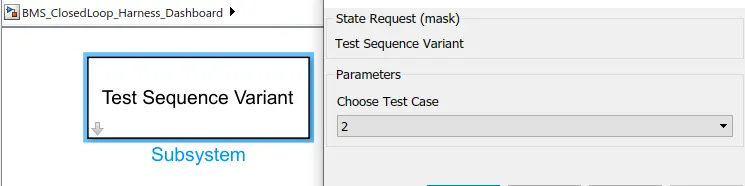
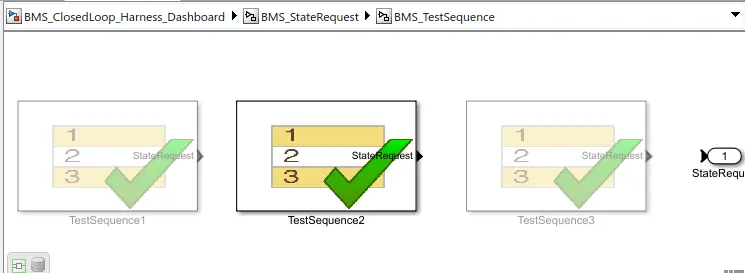
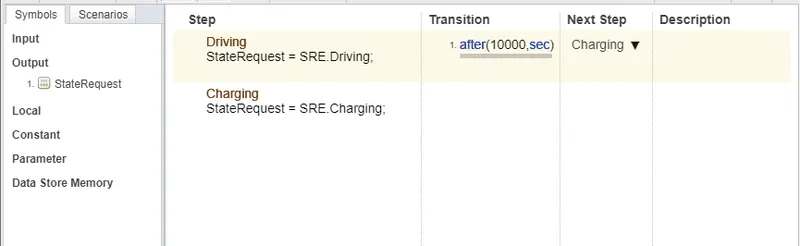
Here from the above test sequence editor figure it was set as,
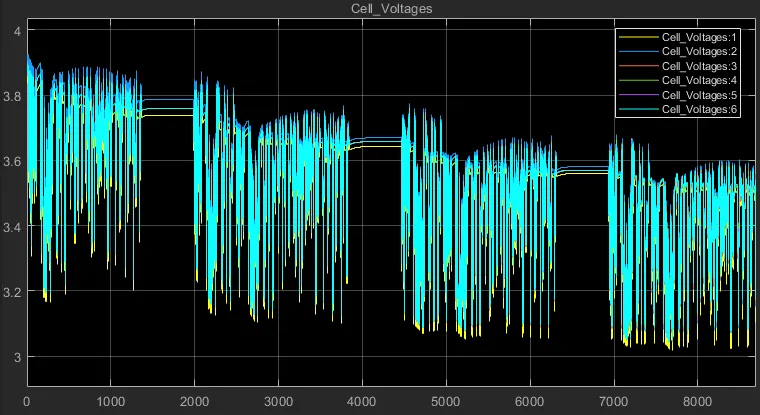
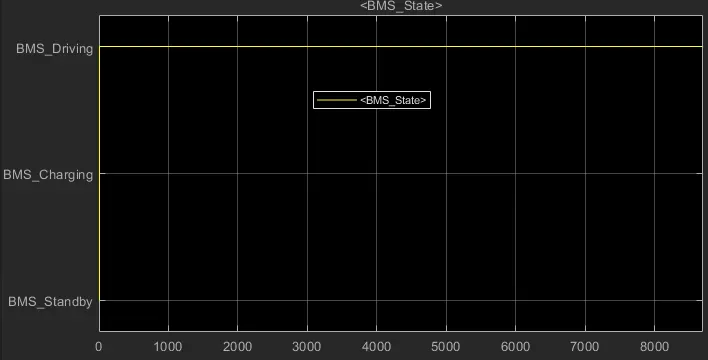
- This test case consist of drive mode for 10000 sec.
- And after that charging occurs till end of simulation.
Plot/Results:
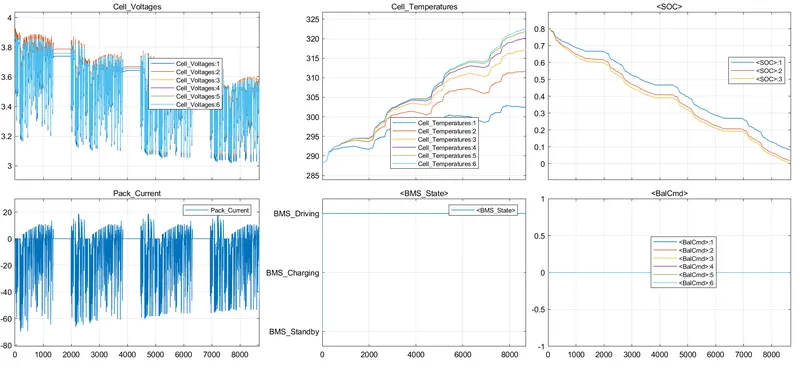
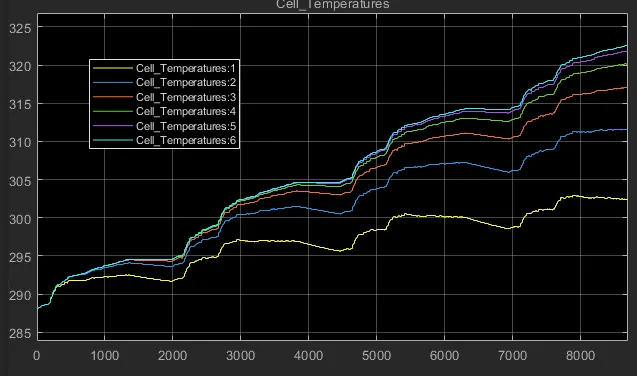
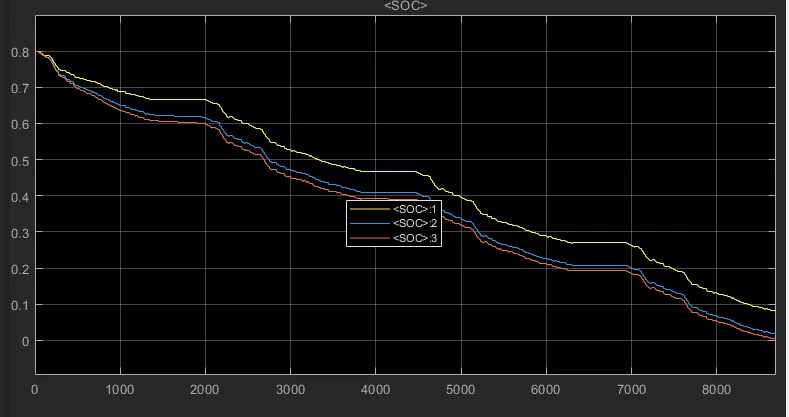
Here in these plots only driving mode of battery module is plotted.
Cell Voltages and Pack Current:
|
 |
Cell temperature:
|
 |
Battery module state:
|
 |
SOC of module:
|
 |
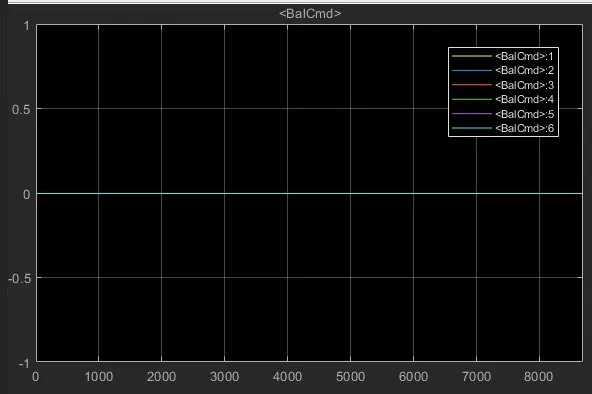
Balancing:
|
 |
- Test case 3 is Charging only.
Plots/result:
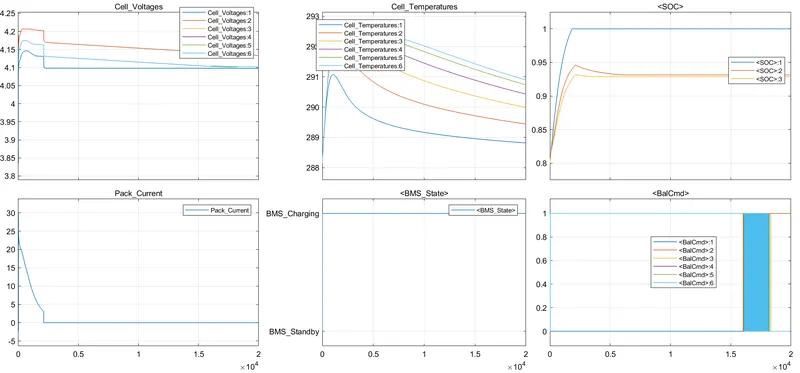
Run the model and results can be viewed.
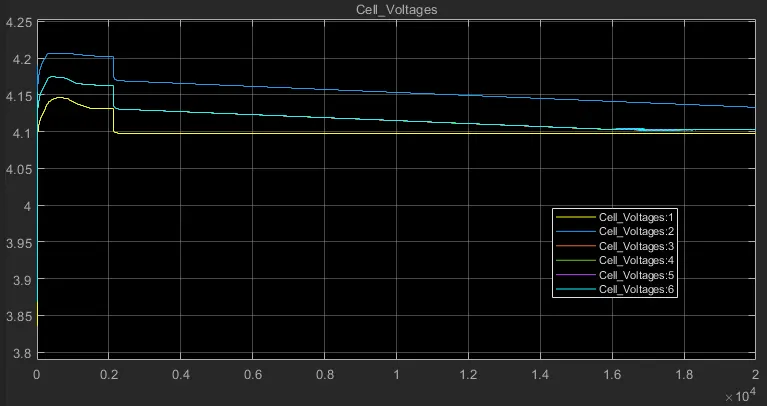
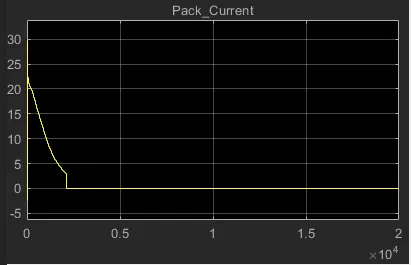
Cell voltages and pack current:
|
 |
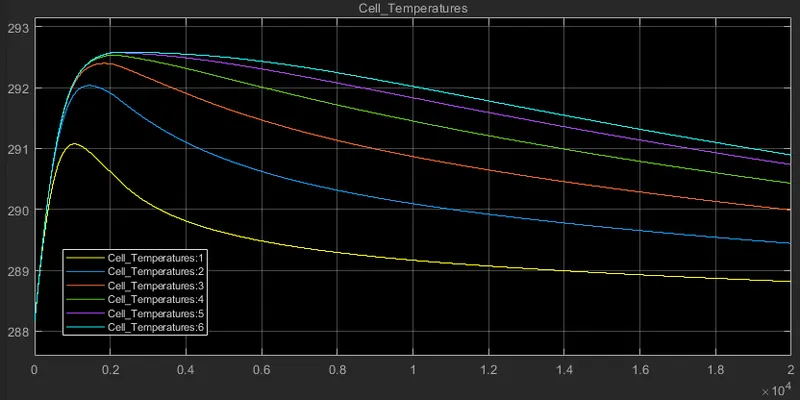
Cell Temperature:
|
 |
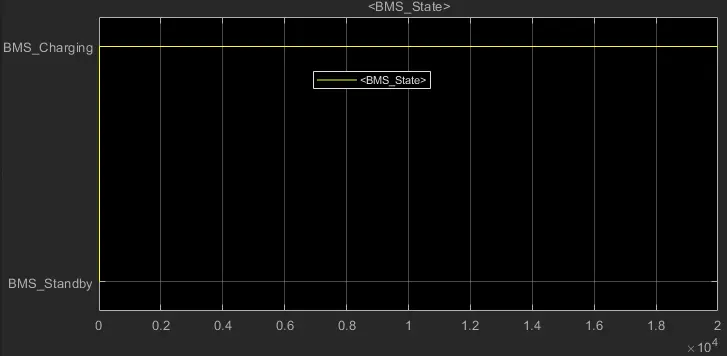
BMS State:
|
 |
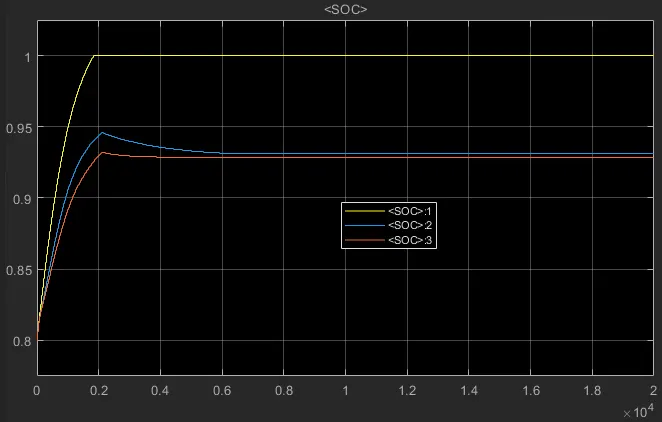
SOC:
|
 |
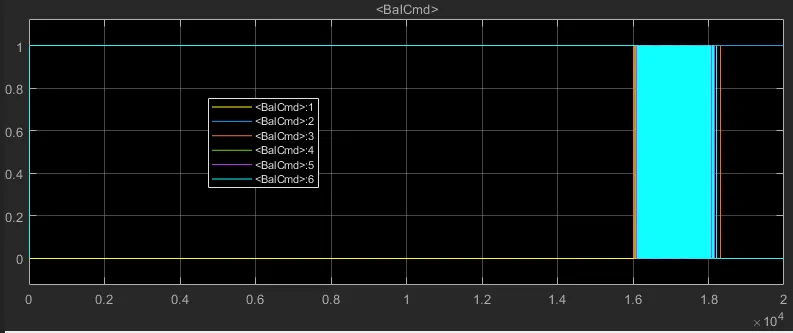
Cell Balancing:
|
 |
Conclusion:
Hence from above three test cases the performance of BMS on various factors are discussed and analysed.
AIM: What is coulomb counting? Refer to the above model and explain how BMS implements coulomb counting for SOC estimation ?
Coulomb counting: This is one of the method of SOC estimation. The coulomb counting method measures the discharging current of the battery and integrates the discharging current over time in order to estimate SOC.
The battery voltage is monitored, to calibrate the SOC when the actual charge approaches either end. If the SOC estimated through Coulomb Counting is uncalibrated (i.e) it is not equal to the actual SOC, eventually the battery will be charged or discharged so far. Using that Voltage Translation we can estimate SOC, and cablibrate the estimate value.
Example, If the actual SOC is 80% but the estimated SOC is 50%, and the Li-ion cell is charging, its voltage soon becomes higher than a threshold say, 3.4 V which corresponds to an actual SOC say, 90 %. At that point, the BMS sets the estimated SOC to 90 %, to calibrate it.
Going back to the issue of drift, in stand-by, the battery is kept full, meaning that Voltage Translation will be used, avoiding the drift of Coulomb Counting using the above mentioned method.
This is a one of the methods which Battery management system uses to estimate the State Of Charge. Similarly there are also many methods involved to do this.
What is SOC: State Of Charge is defined as the rate of available capacity to its maximum capacity when a battery is fully charged and describes the remaining percentage of the battery capacity. SOC can be estimated from discharrging current`I(t)`, previously estimated SOC values.The relation can be given as, `SOC(t)=SOC(t-1)+(I(t))/Q_n*delt`
Modified Coulomd counting: To improve the Coulomb counting method, a new technique called modified Coulomb counting method is proposed. In this technidue discharge current is corrected with a function and corrected current is found out for accurate SOC estimation. The corrected current is the function of discharging current. There is a quadratic relationship between the corrected current and discharging current of battery. The function can be given as,
`I_c(t)=K_2I(t)^2+K_1I(t)+k_0`
Where, `K_0, K_1, K_2` are constant values obtained from the practice experimental data.
The SOC relation can be given as, `SOC(t)=SOC(t-1)+(I(t))/Q_n*delt`
SOC estimation in BMS model: To see the model of coulomb counting technique in BMS model click the subsystem of SOC_Estimation and click Coulomb counting.
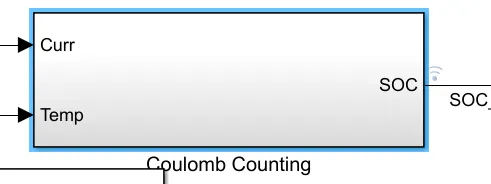
Coulomb Counting block is shown here and how its developed shown below.
- Within the coulomb counting, the SOC estimation is done.
- Temperature and current from the battery is given as inputs for coulomb counting.
- Current signal is given to a gain block.
- These inputs are given for integration where current will be integrated with respect to time.
- This output is given to another block where it is divided by capacity.
- This way the SOC is estimated.
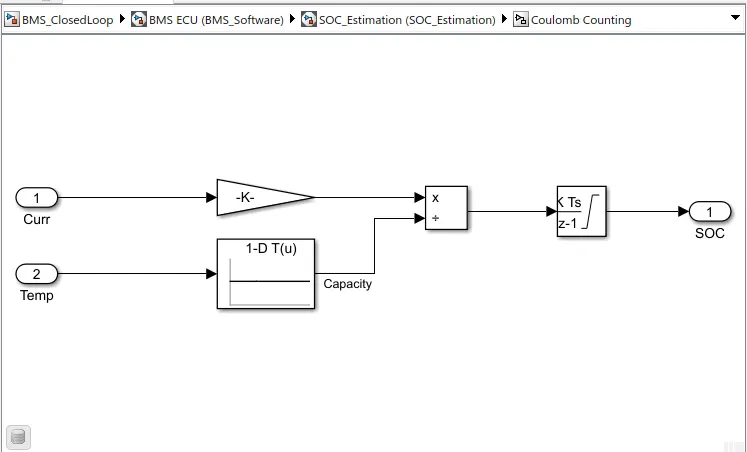
- Here the discharge current from battery given to gain with value as 1/3600 to convert current to Ahr.
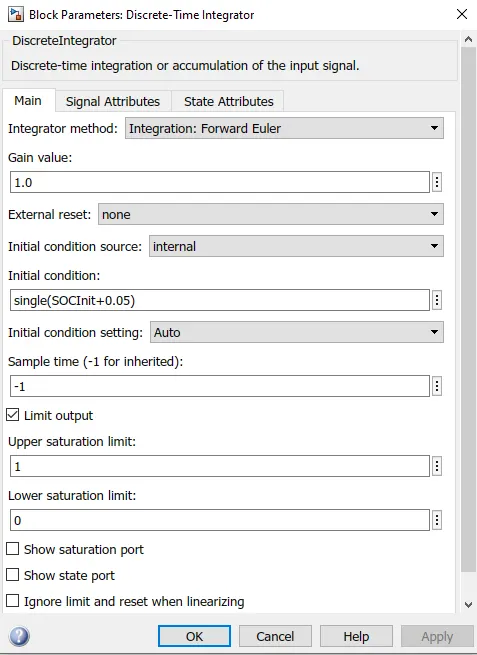
- The value is divided by capacity due to temperature change. Then integrated with a gain value of 1 with sample time -1 as we are using discrete integrator.
- The saturation limits are from 0 to 1.
- We will get the SOC values from 0 to 1 multiplied with 100 to get in percentage of SOC.
Test 1:
- During Charging the Battery pack voltage is increased up to 4.2V.
- The input cycle can be seen in the BMS_State plot in which the vehicle initially undergoes driving, then charging till SOC becomes 90% and then later in the standby state.
- The cell temperature increases during the driving and charging cycle and starts falling off in standby mode.
- The SOC drops to less than 50% after the driving cycle and then later put into charging until SOC Reaches 100%.
- The current supplied to the vehicle during the driving phase can be seen in the current plot.
Test 2:
- After 10,000 sec when the driving cycle is over, the fault condition occurs and so the SOC does not increase even for the charging phase.
- Cell temperature increases during driving, and since it is higher than recommended, BMS stops the battery from charging, so we can see a gradual decrease in temperature
Test 3:
- The SOC increases from 80 to 100% and then remains in standby mode.
- During charging SOC increases from 80 to 100%, temperature increases during charging and is reduced in the standby state of the BMS.